In today's fast-paced project management landscape, the Gantt chart is an indispensable tool widely used across various industries such as IT, construction, marketing, and more. It provides a clear visual representation of project progress, task dependencies, and resource allocation, aiding in better project control and understanding. Mastering the creation of Gantt charts is crucial for anyone looking to enhance their project management skills.
So, how do you create a Gantt chart? What are the key elements to pay attention to? This article will guide beginners through the detailed process and techniques of making a Gantt chart.
Knowledge about Gantt Charts
Definition
A Gantt chart is a common project management visual tool used to display project progress. It uses a timeline as the horizontal axis and tasks as the vertical axis, represented by bars indicating the start and end dates and completion levels of tasks. This graphical method allows project managers to easily grasp project progress and task arrangements.
History
The Gantt chart was invented in the early 20th century by Henry Gantt, an American mechanical engineer. It gained widespread use during World War I for managing military production and resource allocation, significantly improving efficiency. With advancements in computer technology, Gantt charts have been digitized. Modern project management software, such as Boardmix, now offers Gantt chart functionalities, making it easier to create, modify, and share them, thus enhancing project management efficiency.
Main Uses
-Project Planning and Scheduling: Helps determine task start and end dates and dependencies, useful for planning and resource scheduling.
-Progress Control: Allows comparison of actual progress with expected progress to identify and address deviations.
-Communication Tool: Visually displays overall project status and individual task states, facilitating communication with team members, clients, and stakeholders.
-Risk Management: Helps identify risks that might impact project timelines, such as delays in critical tasks.
-Decision Support: Provides a comprehensive view of the project, aiding in decisions like resource allocation and task adjustments.
Basic Elements of a Gantt Chart
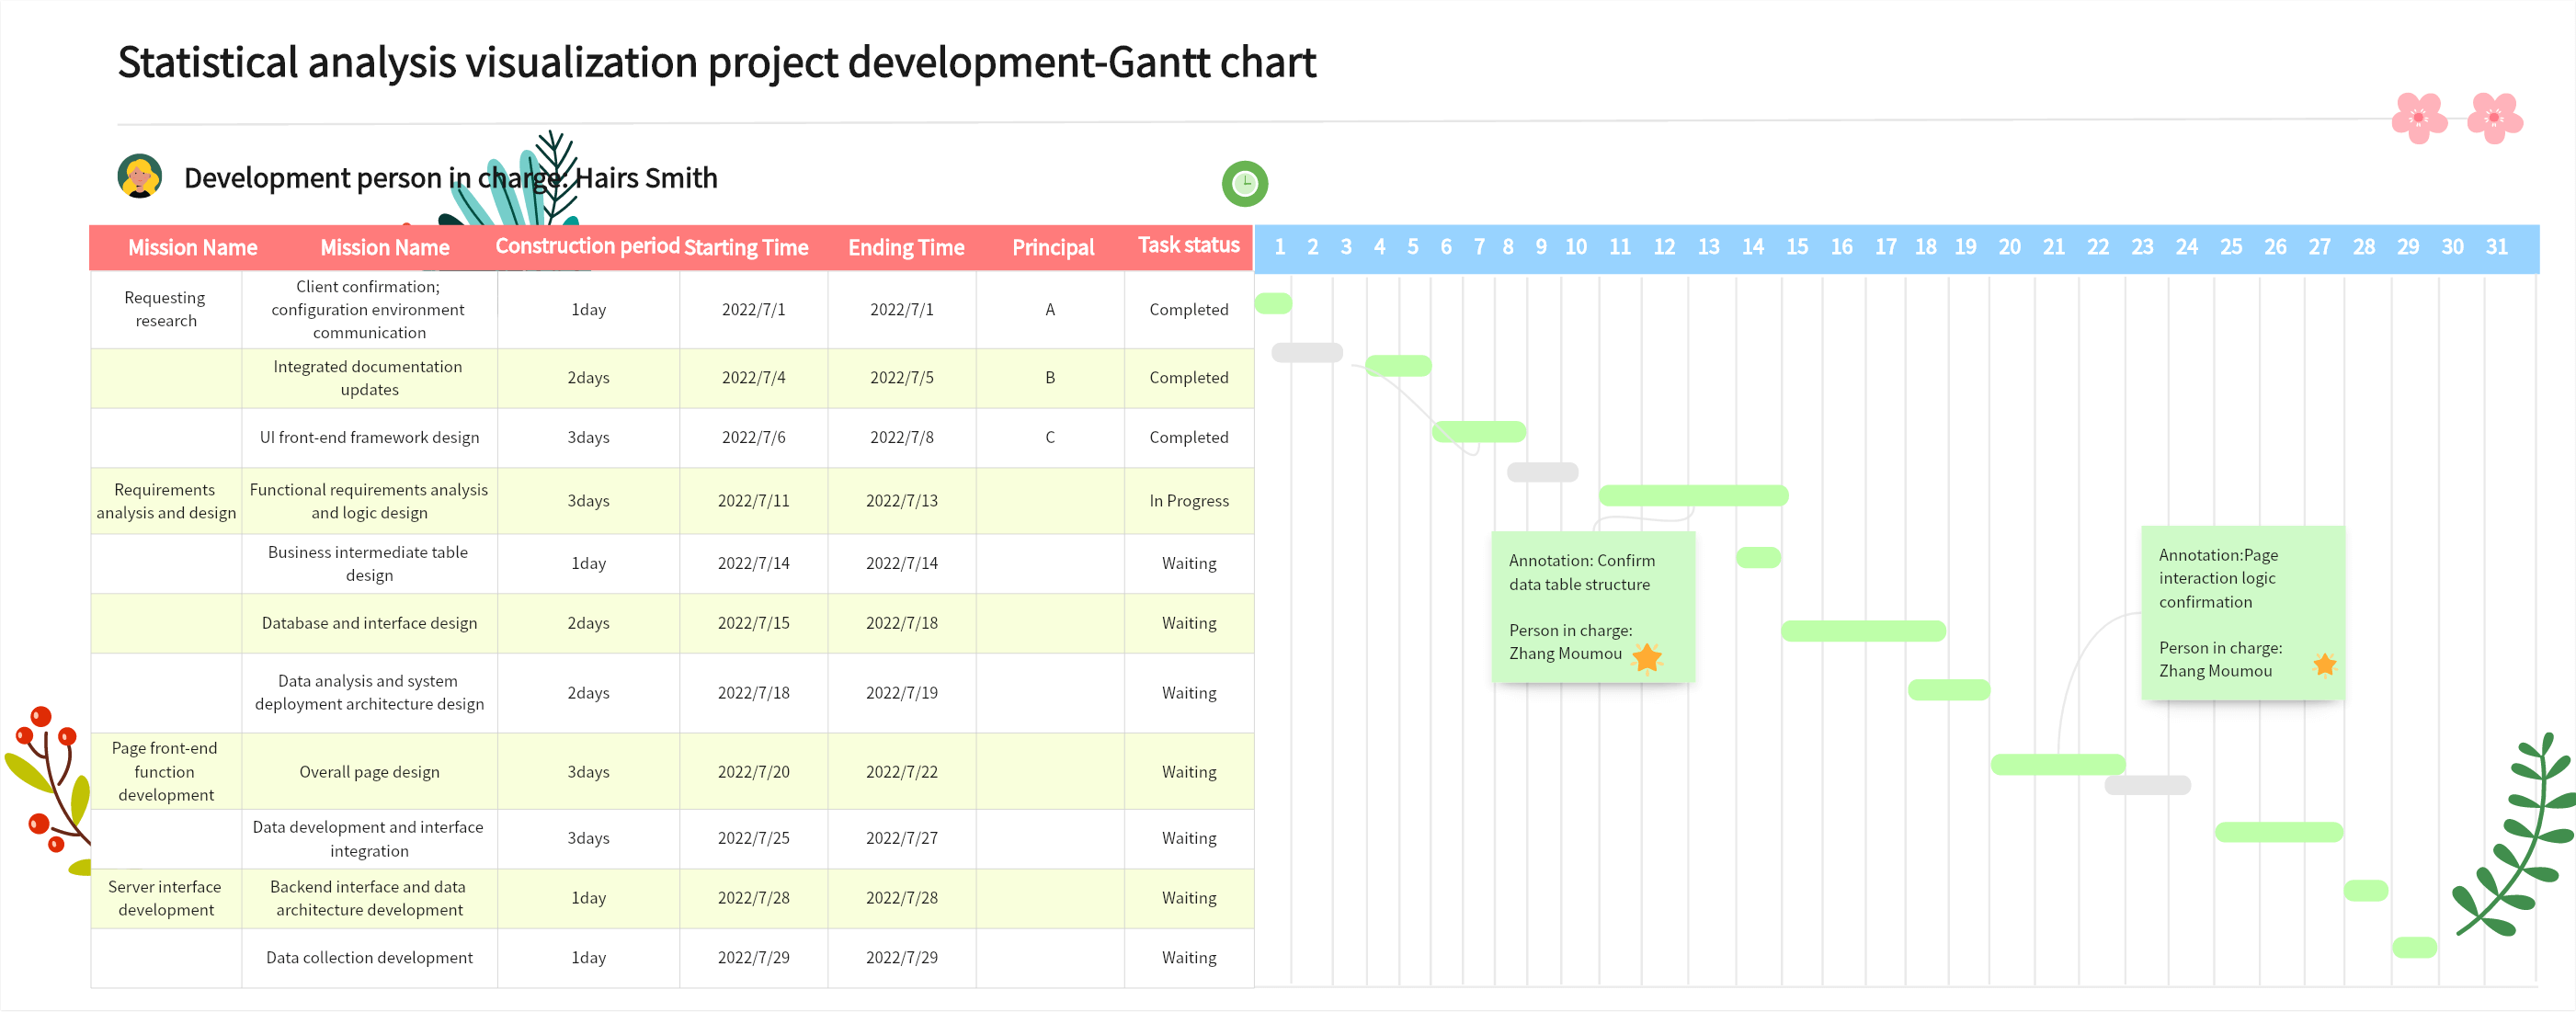
After understanding Gantt charts, the next step is to familiarize yourself with their components. A complete Gantt chart typically includes the following elements:
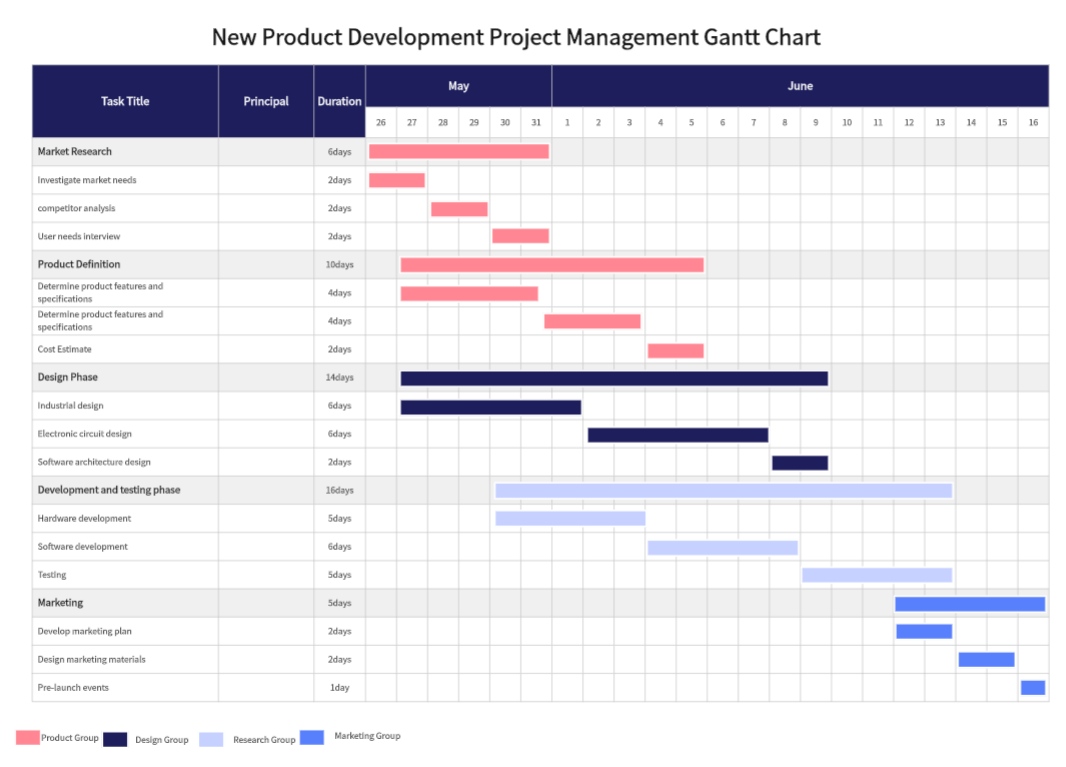
Task List
Usually located on the left side, listing all project tasks. Each task typically occupies a row, showing its position and status within the project. Information may include:
-Task name
-Responsible person
-Start date
-End date
-Duration
Tasks are often arranged logically, such as by dependency or project phase, to help understand relationships and impacts on overall progress.
Timeline
The timeline, usually at the top or bottom, displays the project’s duration in units like days, weeks, months, or years. It shows start and end dates for tasks and their durations, with a current date indicator to compare actual and expected progress.
Bars
The most intuitive element, bars indicate task start and end dates and durations, positioned according to the timeline. Observing the bars, project managers can see when tasks start, and end, their durations, sequences, and overlaps.
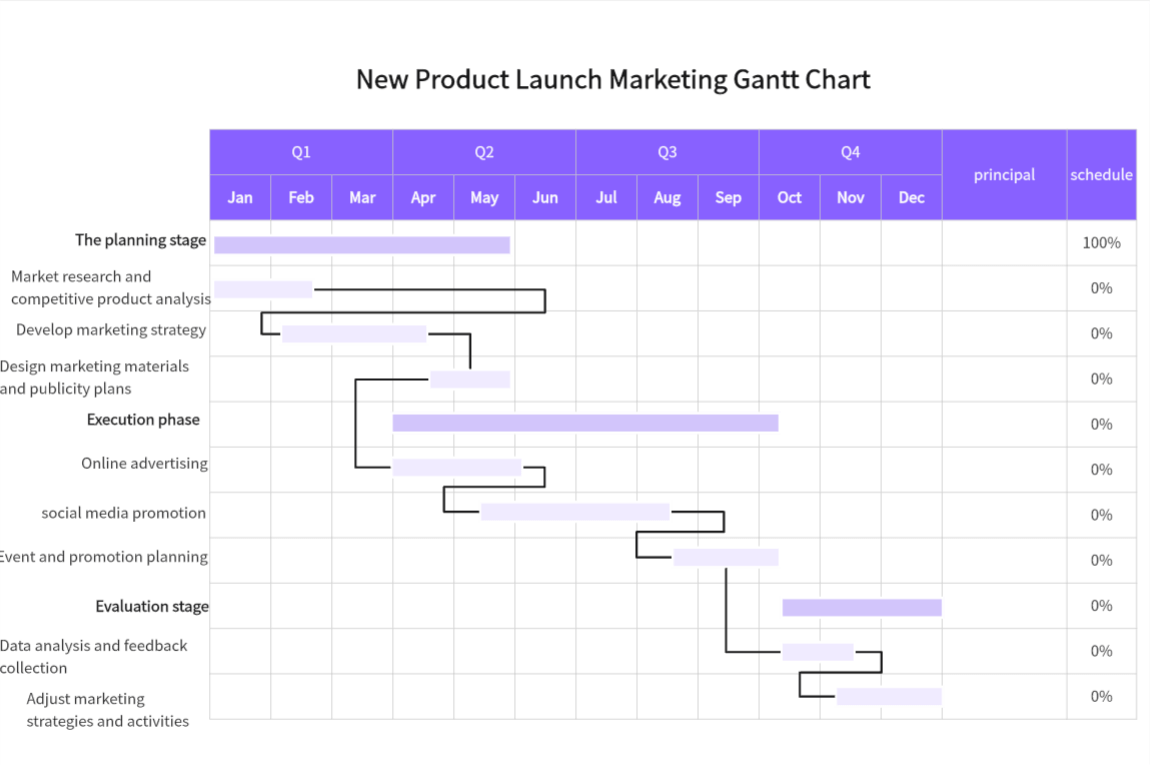
Dependency Lines
These lines show task dependencies. If one task must finish before another can start, a dependency line connects its bars, often with an arrow indicating the dependent task. This clarifies logical relationships and impacts on progress.
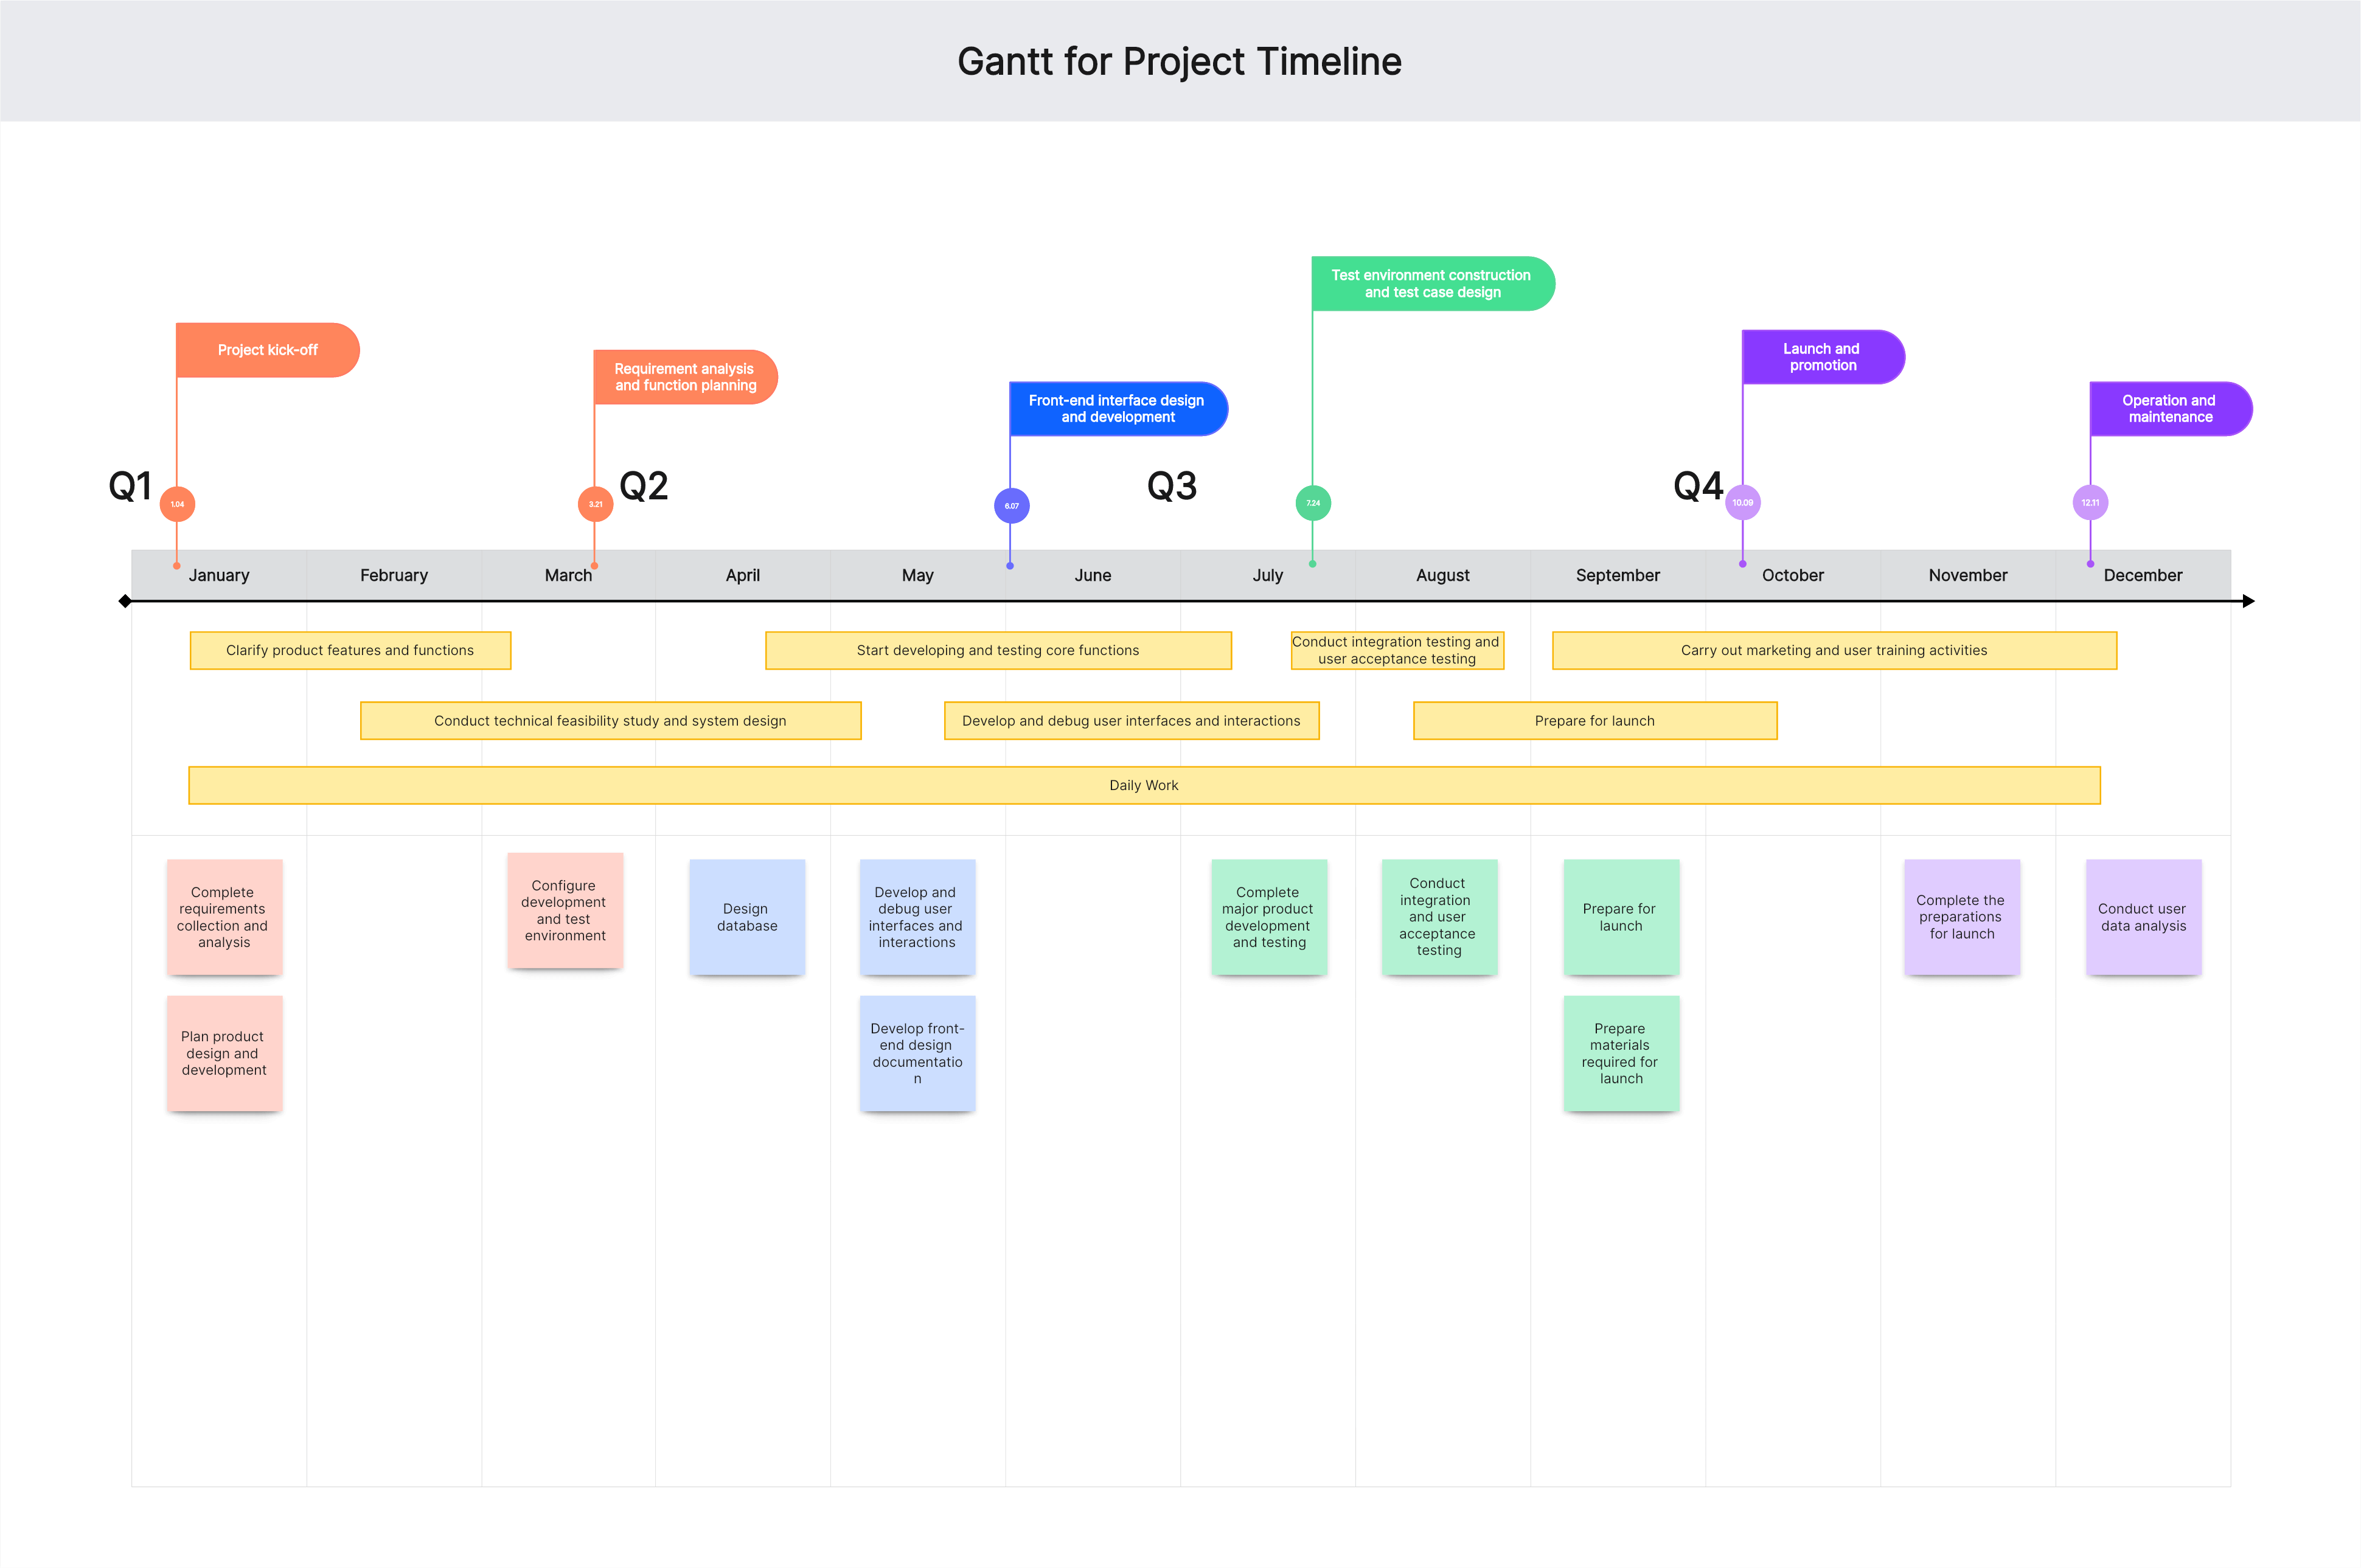
Milestones
Important events or key points in the project, like project start, end, key decisions, or major deliverables. Milestones are often symbolized (e.g., diamonds or stars) on specific dates, representing single points in time without duration. They aid communication by highlighting significant events and goals.
How to Create a Gantt Chart
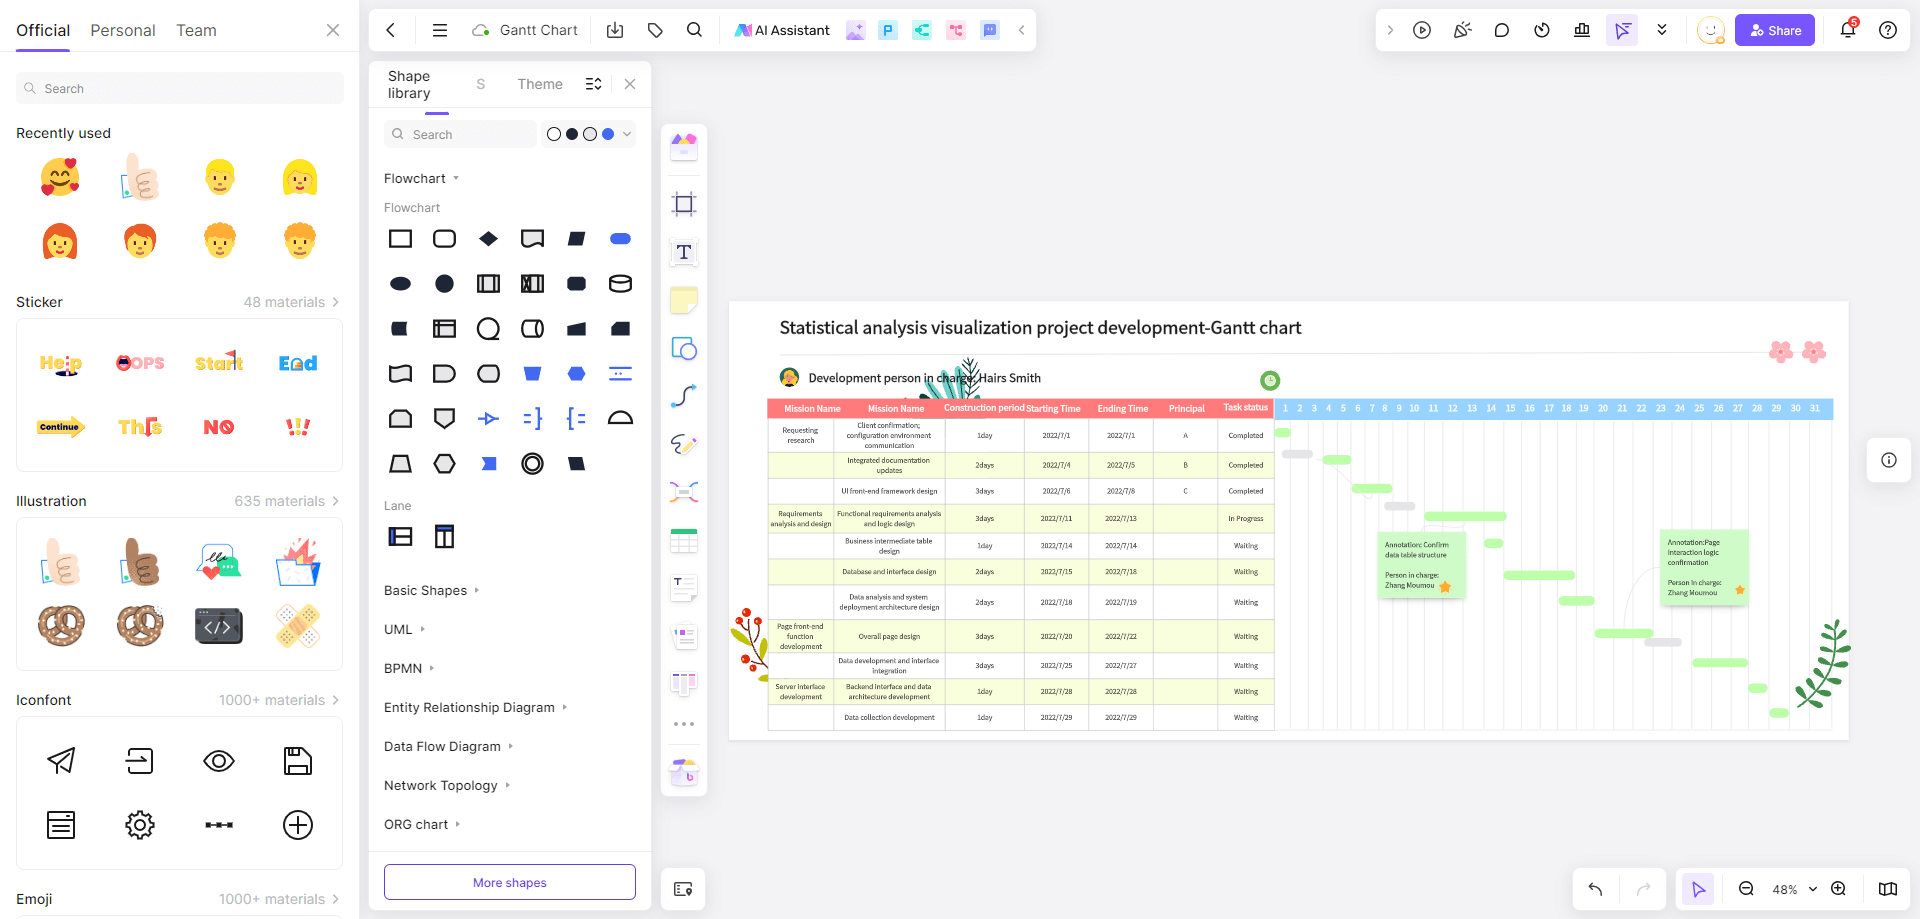
Common Tools
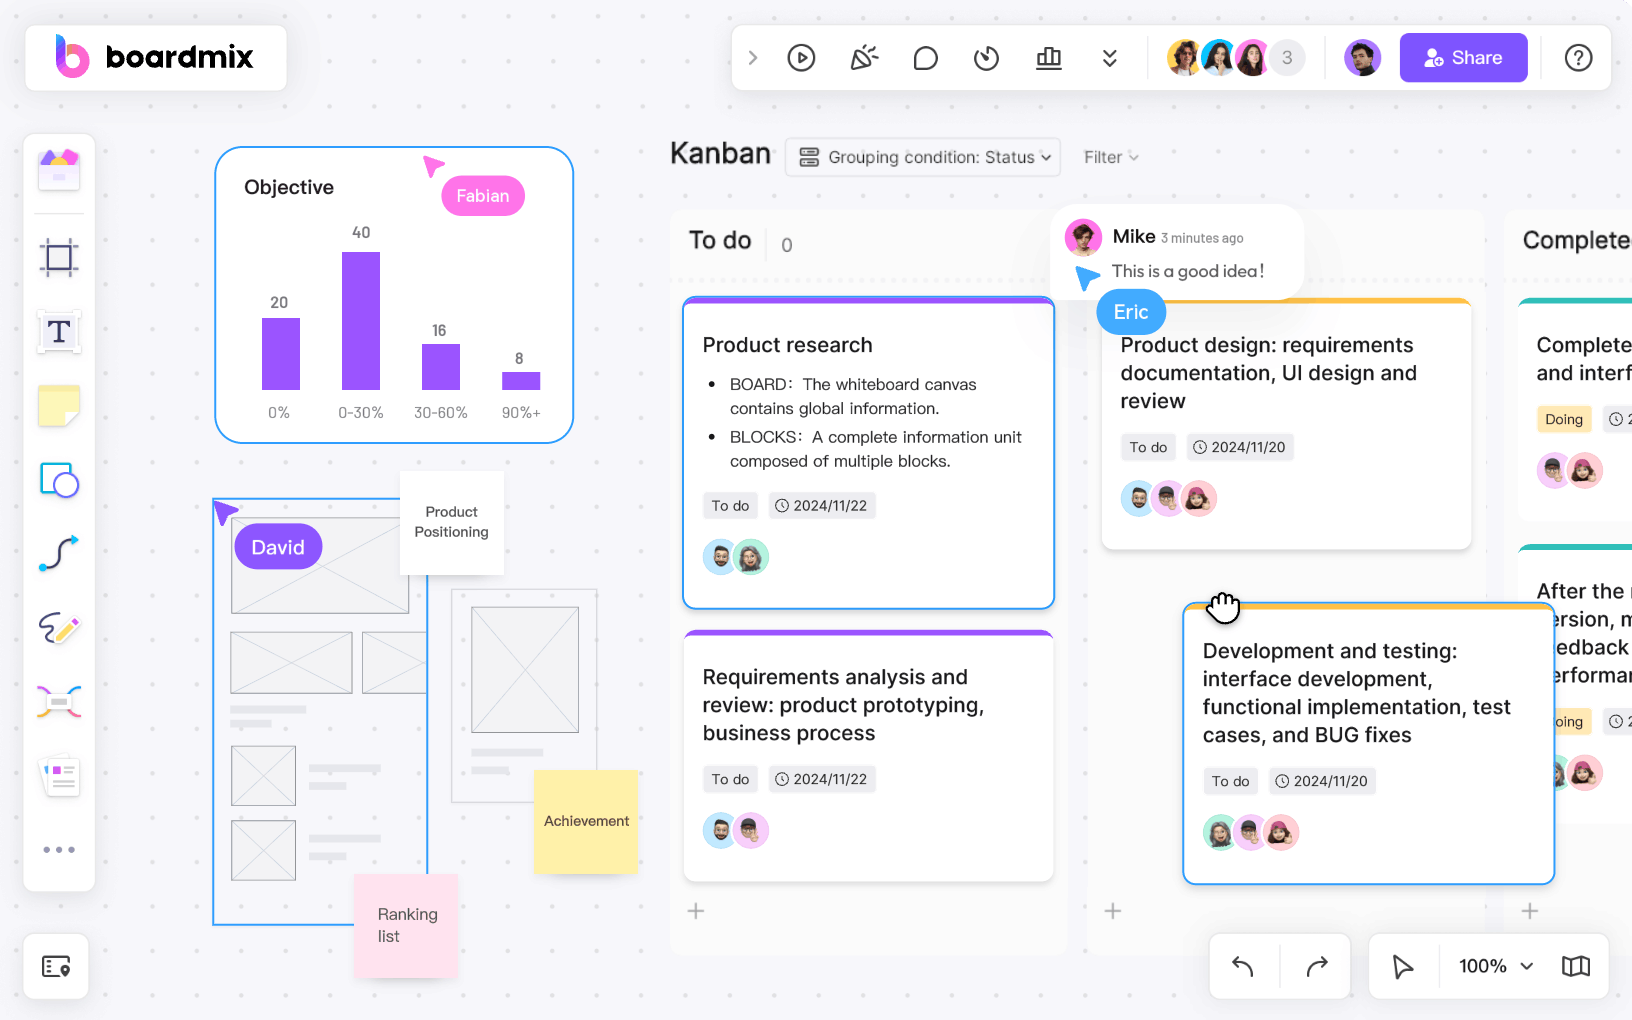
-Boardmix: A multifunctional Gantt chart tool with rich visualization features, supporting real-time collaboration.
-Microsoft Project: A professional project management software with robust Gantt chart functionalities for planning, tracking progress, and resource analysis.
-Smartsheet: A flexible work management platform with templates and tools for creating Gantt charts, supporting real-time collaboration and automatic updates.
-Asana: A popular project management tool offering basic Gantt chart features for planning, task assignment, and progress tracking.
Steps to Create a Gantt Chart
-Identify Project Tasks: List all tasks to be completed, making them as specific as possible.
-Determine Task Order and Dependencies: Establish dependencies and task order.
-Estimate Task Durations: Estimate how long each task will take using historical data or expert input.
-Create Project Schedule: Based on task order, dependencies, and durations, create a project schedule with start and end dates.
-Build the Gantt Chart: Use the gathered information to create the Gantt chart, positioning bars to represent tasks.
-Update and Adjust: Regularly update and adjust the Gantt chart based on actual progress.
The Benefits of Using Gantt Charts
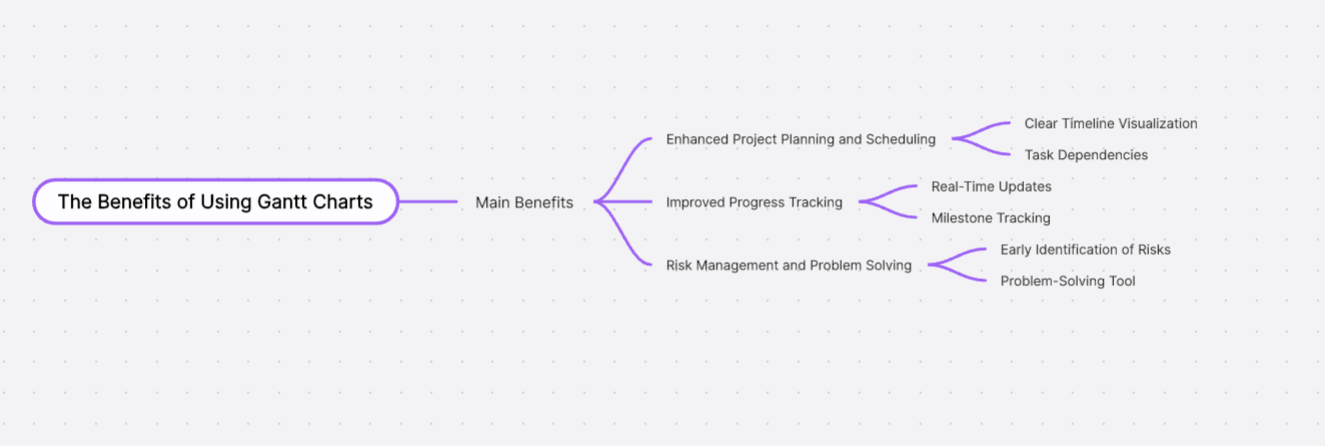
Gantt charts are widely recognized as a powerful tool in project management due to their ability to provide a clear visual representation of a project's timeline, tasks, and progress. Here are some key benefits of using Gantt charts:
Enhanced Project Planning and Scheduling
Clear Timeline Visualization: Gantt charts display project tasks along a timeline, making it easy to see when tasks are scheduled to start and end. This visualization helps in planning the entire project efficiently.
Task Dependencies: By showing dependencies between tasks, Gantt charts help identify which tasks need to be completed before others can begin, ensuring a logical and orderly progression of work.
Improved Progress Tracking
Real-Time Updates: Modern Gantt chart tools allow for real-time updates, enabling project managers to track the progress of tasks as they are completed. This real-time visibility helps in making timely adjustments and keeping the project on track.
Milestone Tracking: Milestones can be highlighted on Gantt charts to signify key points or goals within the project. This helps in tracking significant achievements and ensuring that the project is progressing as planned.
Risk Management and Problem Solving
Early Identification of Risks: Gantt charts help identify potential risks early by highlighting tasks that are falling behind schedule. This early detection allows project managers to take corrective actions before issues escalate.
Problem-Solving Tool: When a project deviates from its original plan, Gantt charts can be used to analyze the impact of delays or changes. This analysis helps in developing strategies to get the project back on track.
Common Issues and Solutions
-Overly Complex Tasks: Simplify by breaking down into smaller, more manageable subtasks.
-Unclear Dependencies: Mark dependencies when creating the Gantt chart.
-Inaccurate Time Estimates: Use historical data or expert opinions for more accurate estimates.
-Outdated Gantt Chart: Regularly update to reflect the latest progress.
-Team Misunderstanding: Provide training to ensure everyone understands and uses the Gantt chart.
-Ineffective Tool Usage: Learn and master project management tools for better efficiency.
Recap
-Gantt charts are powerful tools for better project planning, execution, and control.
-A complete Gantt chart includes a task list, timeline, bars, milestones, and dependency lines.
-Choose suitable tools, plan tasks and time wisely, and display project progress.
-Boardmix is ideal for creating Gantt charts, offering a simple interface and real-time collaboration.