

How can we enhance our management and control of time and projects? This article provides an in-depth look at a simple and intuitive project management tool the Gantt chart. Learning to use a Gantt chart effectively can help project managers and team members better plan and control project progress, thereby improving project execution efficiency and success rates.
What is a Gantt Chart?
A Gantt chart is a project management tool used to display project plans and progress control. It is presented in the form of a horizontal bar chart, with the horizontal axis representing time and the vertical axis representing tasks or activities. Each task or activity is represented by a bar on the Gantt chart, and the length of the bar indicates the duration of the task. The Gantt chart can also show task dependencies, milestones, and resource allocation.
Role of Gantt Chart in Project Management
As one of the best tools for project management, Gantt charts are typically used to help project teams plan and control project progress:
Visualize Project Progress: Gantt charts display various tasks and milestones of the project on a timeline, reflecting the start and end times of tasks clearly through color, length, and position.
Manage Task Dependencies: Gantt charts can clearly show task dependencies, indicating which tasks must be completed before others can start. This helps project managers understand the sequence and interrelation of tasks better.
Resource Allocation and Optimization: Gantt charts help project managers identify and allocate necessary resources, including manpower, materials, and finances, optimizing resource distribution and arranging team workloads to improve resource utilization and work efficiency.
Progress Control and Risk Management: By comparing actual progress with planned progress on the Gantt chart, project managers can take timely measures for adjustments and optimizations.
Gantt Chart Creation Tutorial
(1) Identify Project Tasks
Tasks are the basic units in a Gantt chart, representing specific work to be completed in the project. Clearly list all tasks or activities that need to be completed in the project.
(2) Estimate Task Time
Estimate the time required to complete each task, marking the start and end dates. Use past similar projects, professional knowledge, or team discussions for time estimation.
(3) Determine Task Dependencies
Identify the sequence and dependencies of tasks. Mark which tasks must be completed before others can start and which tasks can run concurrently.
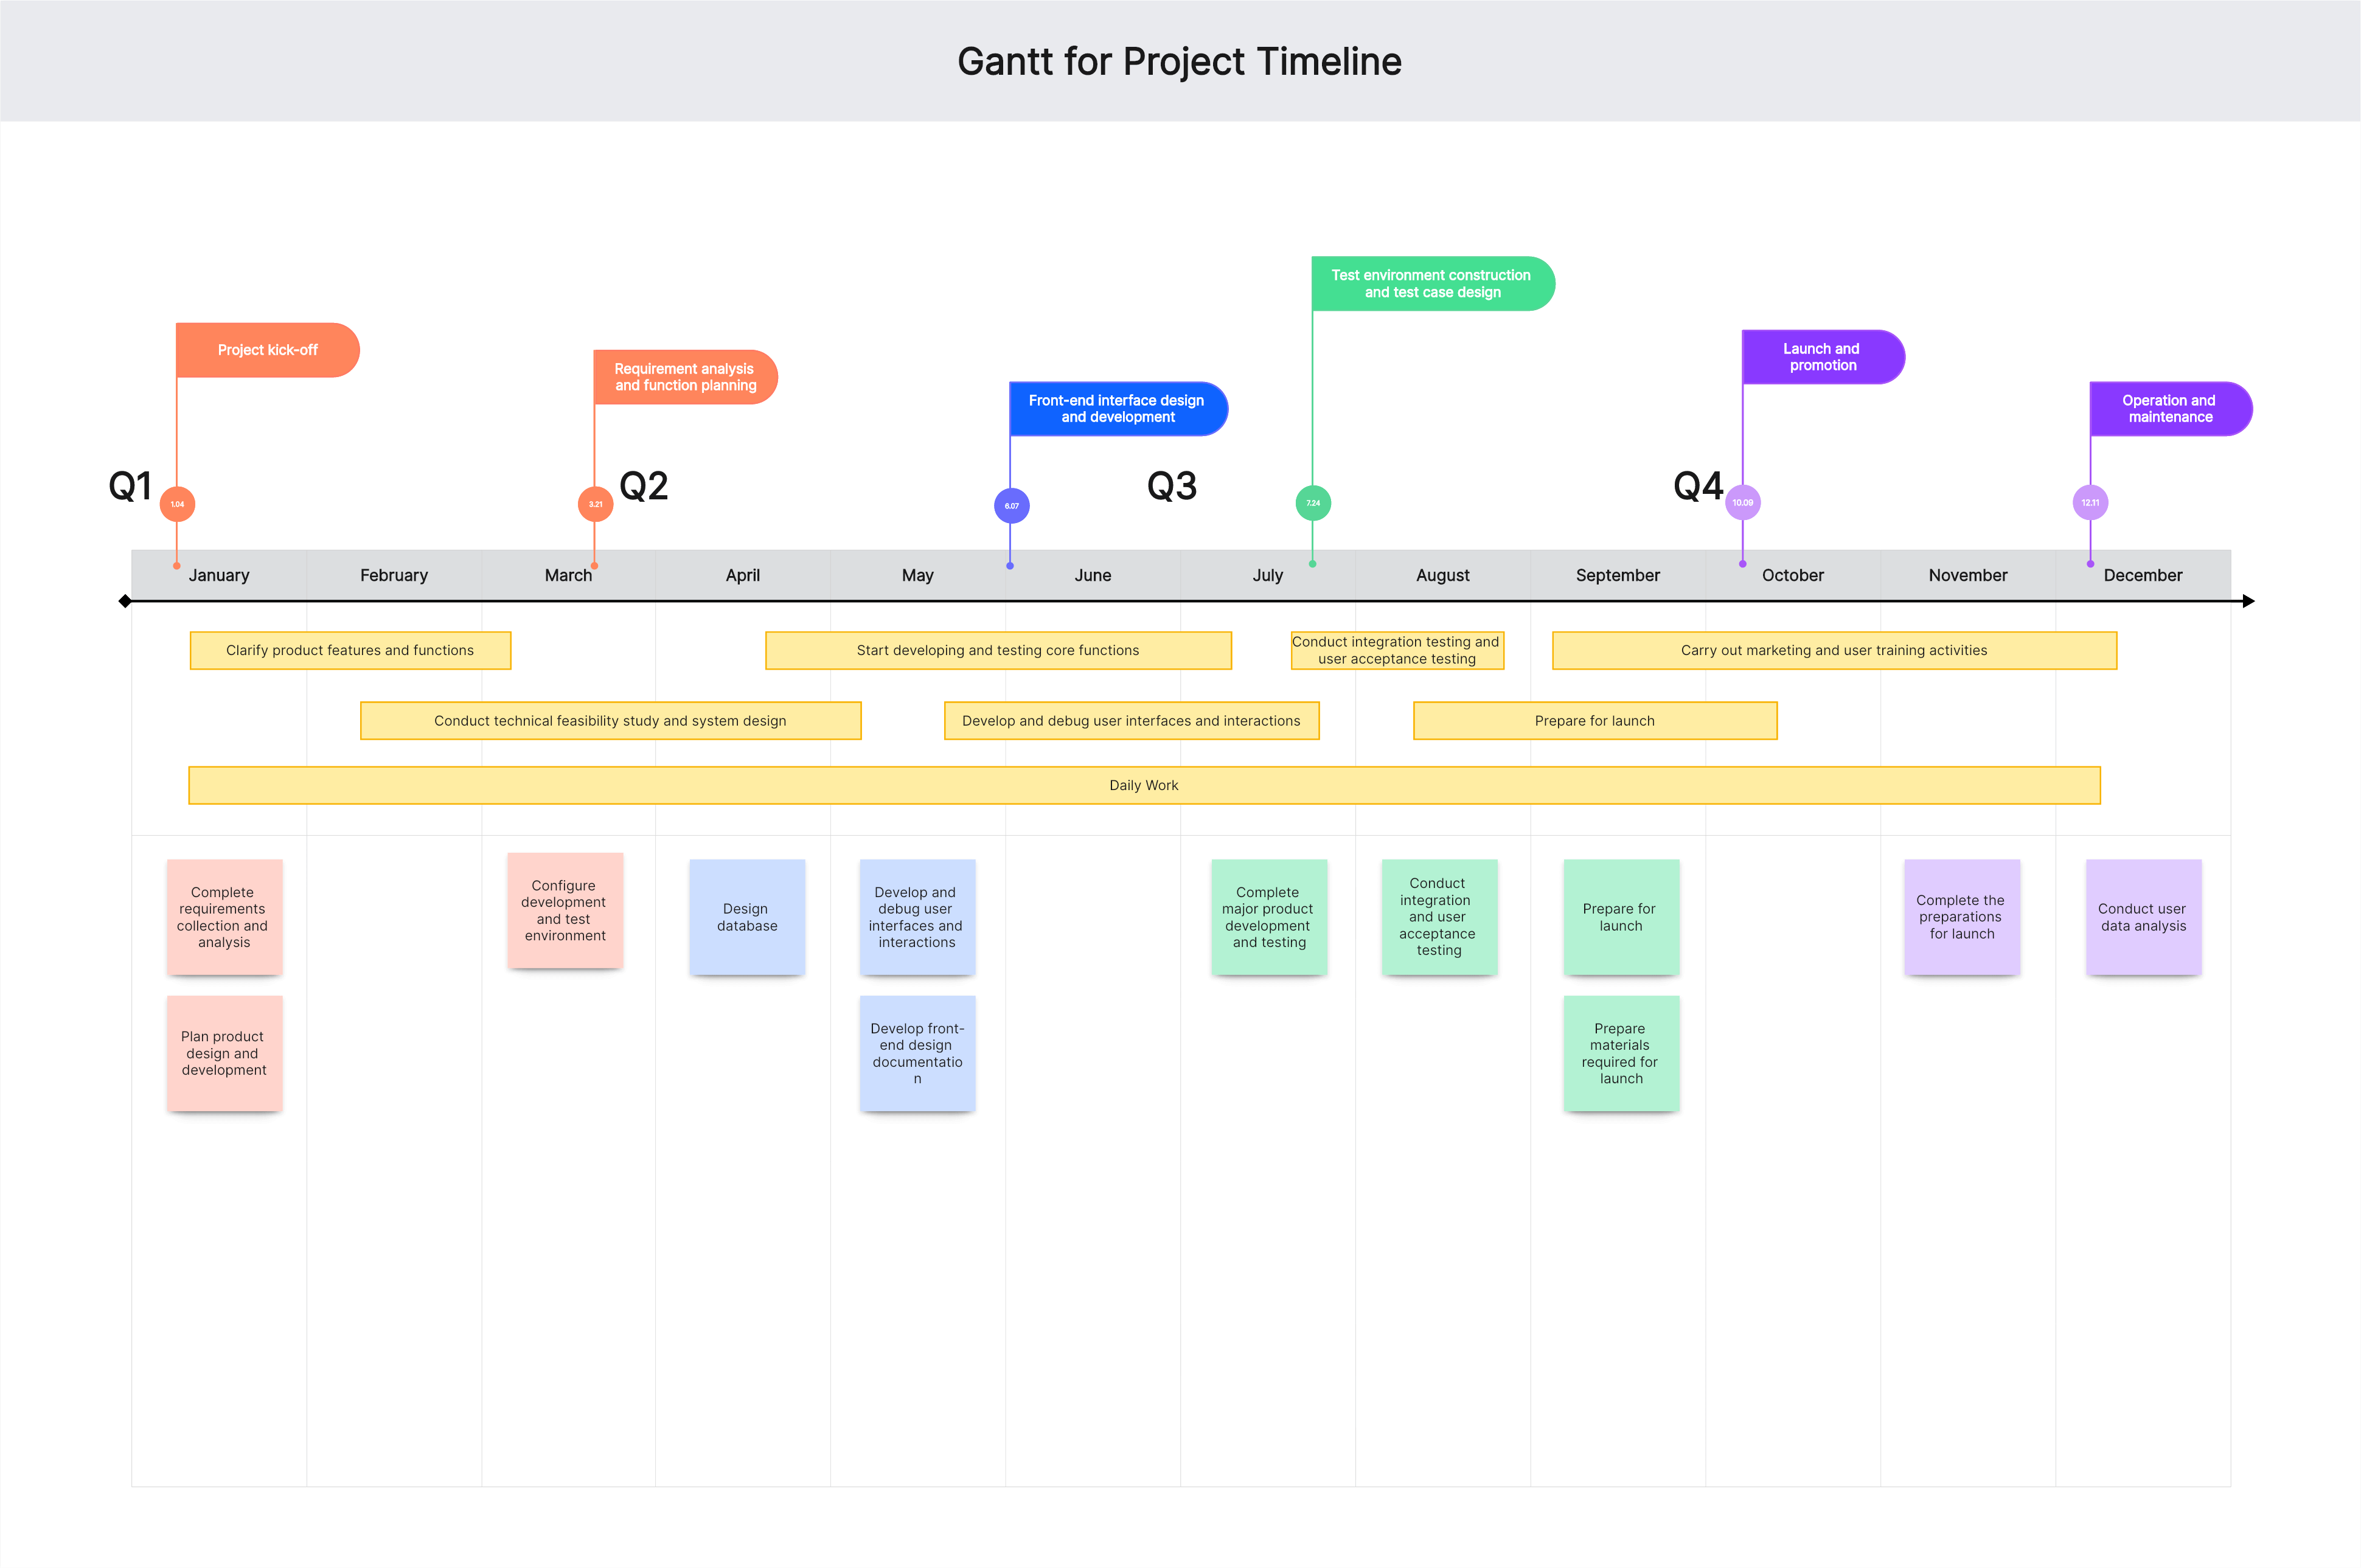
(4) Draw the Gantt Chart
Use Gantt chart tools for drawing, such as Boardmix, Microsoft Project, or Excel. Create a new Gantt chart project in the tool, fill in task and time information according to the task list and time estimates, and generate the Gantt chart.
(5) Add Milestones
Add milestones in the Gantt chart to mark important project nodes or key events, which usually do not involve duration but indicate significant completion points.
(6) Track and Update
Continuously update the Gantt chart as the project progresses, recording actual progress and comparing it with planned progress for timely adjustments.
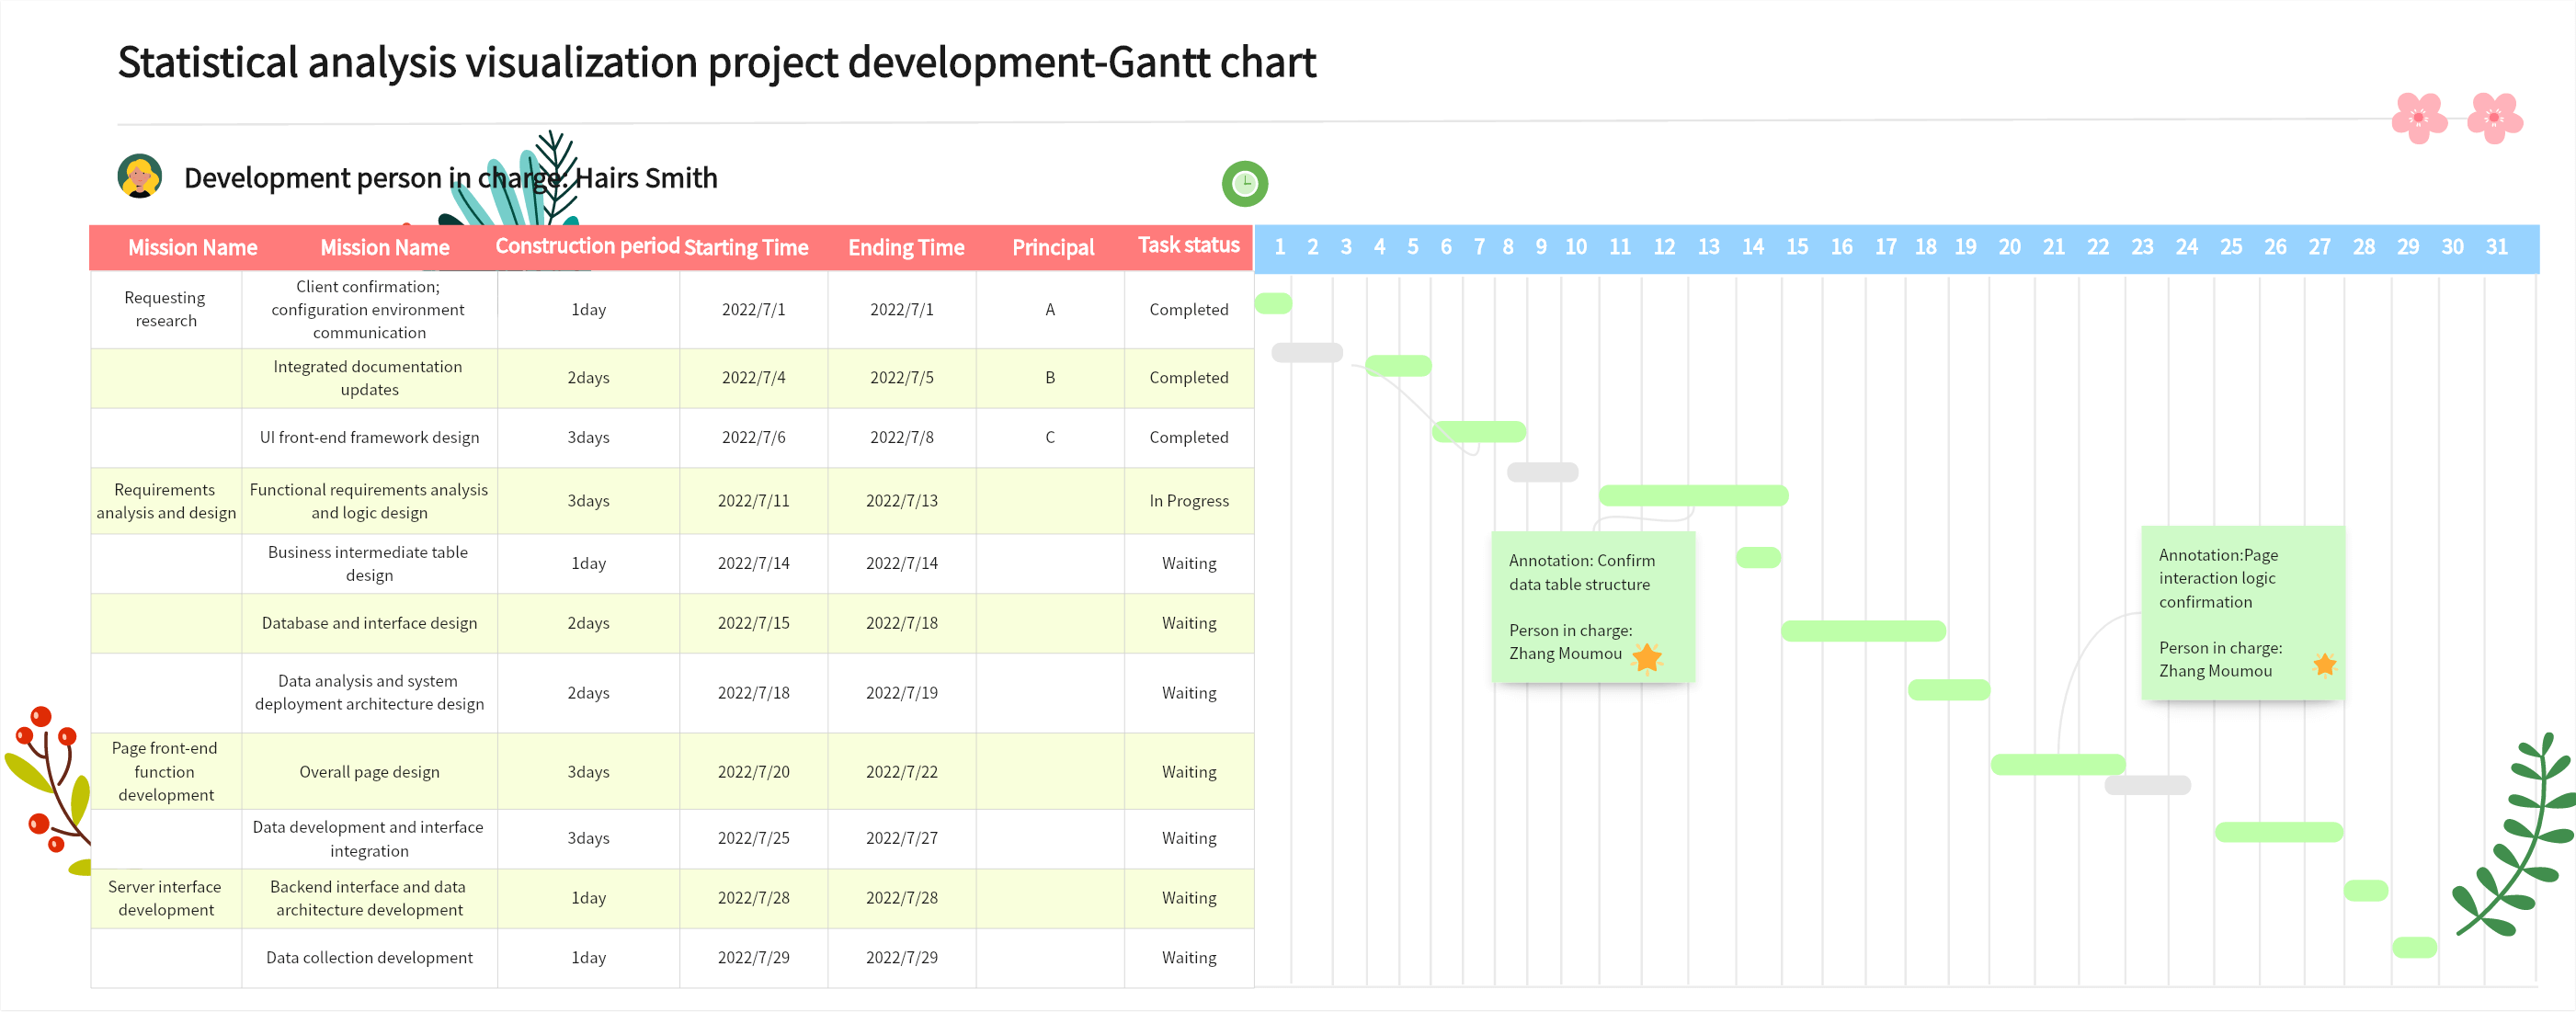
Application Case of Gantt Chart
Project A involves developing a new product by a tech company aiming to launch a smart home system. Here's a Gantt chart analysis for Project A:
Project Start Date: January 1, 2022
Project End Date: June 30, 2022
Main Tasks: Market research, product design, software development, and market promotion.
Task Timing: Market research lasts one month (January 1, 31). Product design lasts two months (February 1, March 31). Software development lasts three months (April 1, June 30). Market promotion lasts one month (May, 1 31).
Key Milestones: For example, completing the market research report and determining the target market during the market research phase.
Task Dependencies: Market research must precede product design so that the design team can base their work on the research results.
Resource Allocation: The Gantt chart shows necessary resources for each task, such as more developers and testers during the software development phase.
Progress Control: Project managers can clearly understand project progress via the Gantt chart, tracking it against task timing and milestones, and taking action to address any delays.
Tips for Efficient Use of Gantt Charts
(1) Reasonable Time and Task Setting
Accurately estimate the time for each task using past project experience or professional knowledge.
Reasonably assign task priorities and workloads. High-priority tasks should be completed first, and tasks with large workloads should have appropriate resources and time allocated.
Consider the capabilities of team members and resource availability.
(2) Maintain Team Communication and Timely Updates
Regularly update the Gantt chart to reflect changes such as task completion times, new tasks, etc.
Please identify and resolve delays quickly, reallocating resources or adjusting task priorities as needed.
Please share updates with team members to make sure everyone knows about the latest progress and plans, promoting collaboration and communication.
(3) Choose Suitable Gantt Chart Software
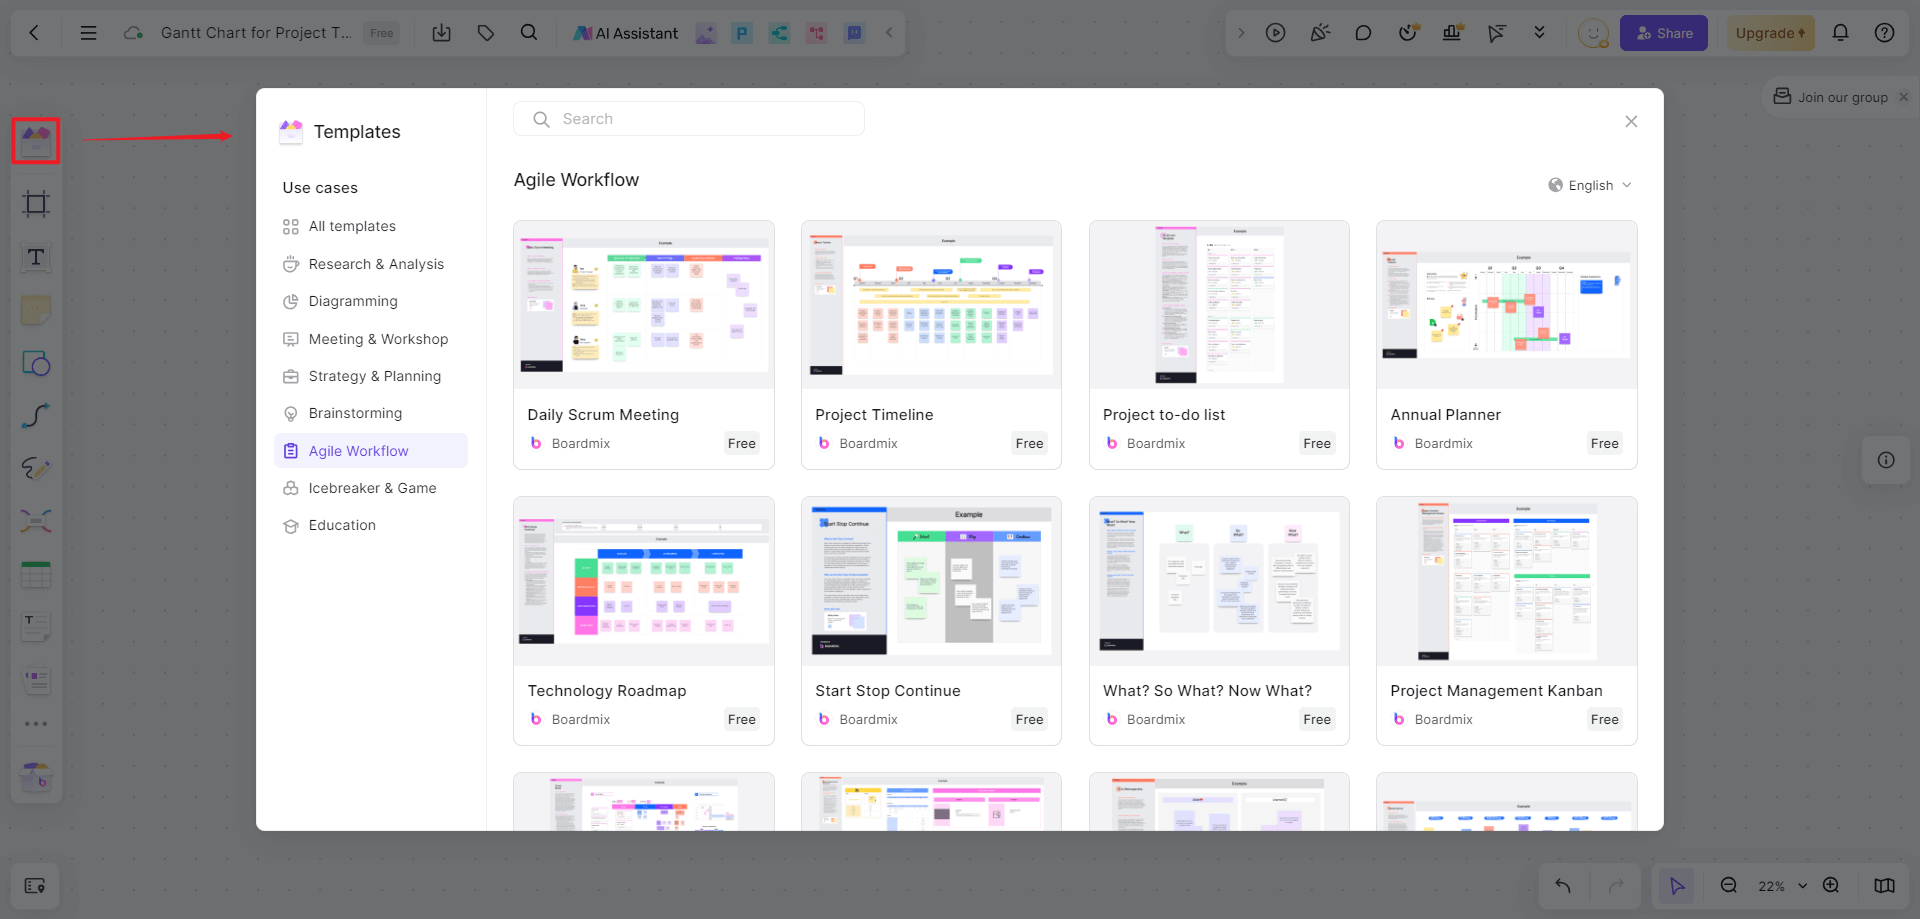
Boardmix is a popular online collaborative whiteboard among project managers. It not only has powerful drawing functions but also supports efficient team collaboration. The project team can communicate on a shared whiteboard, fulfilling needs like online document editing, remote presentations, and progress tracking anytime, anywhere. Boardmix's community section also offers free Gantt chart templates to help you quickly create project Gantt charts.
That's all there is to know about Gantt charts. Utilizing a good Gantt chart can help project team members better understand and control the progress of the project, and improve the success rate of the project.
If you are looking for a perfect combination of powerful, easy-to-use, multi-person collaboration and creative tools, we highly recommend using Boardmix, which not only improves your thinking ability, but also promotes teamwork and creativity, experience it now!


