State one observable effect
Describe what changed, where it appears, and when it started. Avoid putting a suspected cause in the effect statement.


Online Collaborative Whiteboard

Boardmix Developer Platform

AI tools for diagrams, writing, and ideas

UI/UX Tool, Figma Alternative

AI PPT Maker, Gamma Alternative
Run workshops, plan projects, and work with colleagues on a shared whiteboard.
Explore collaborative workBOARDMIX · AI ROOT CAUSE ANALYSIS
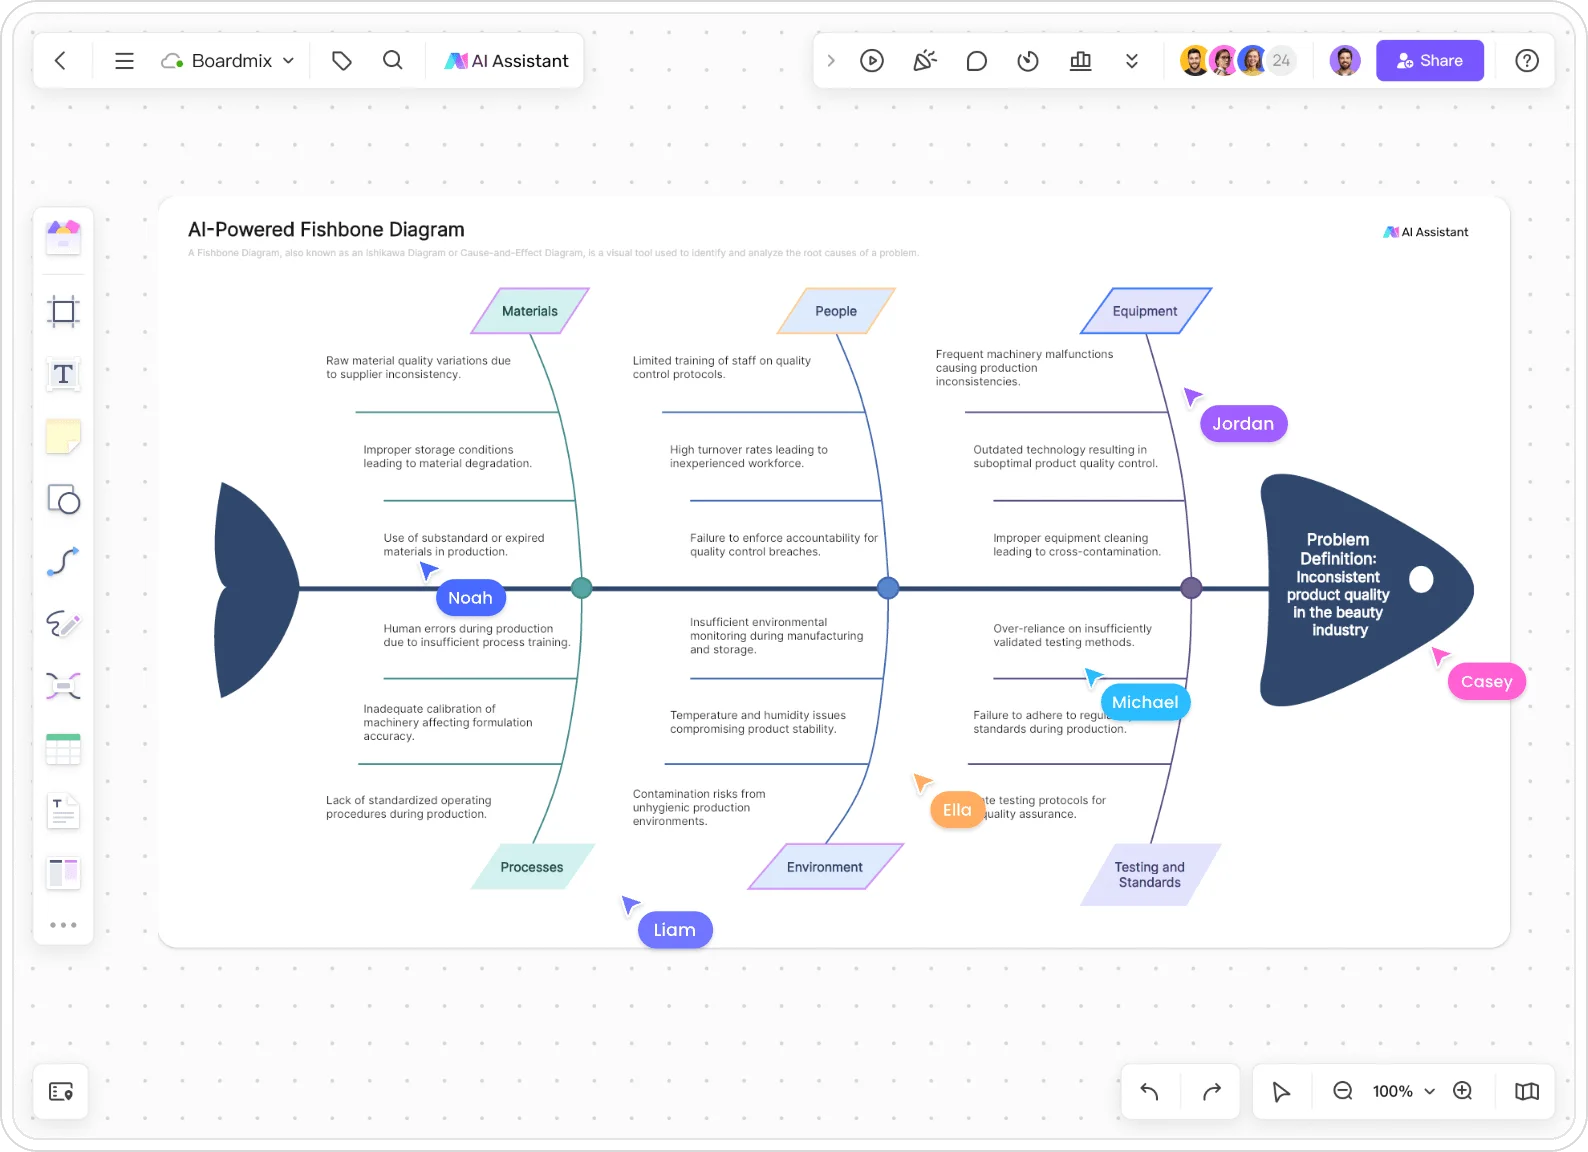
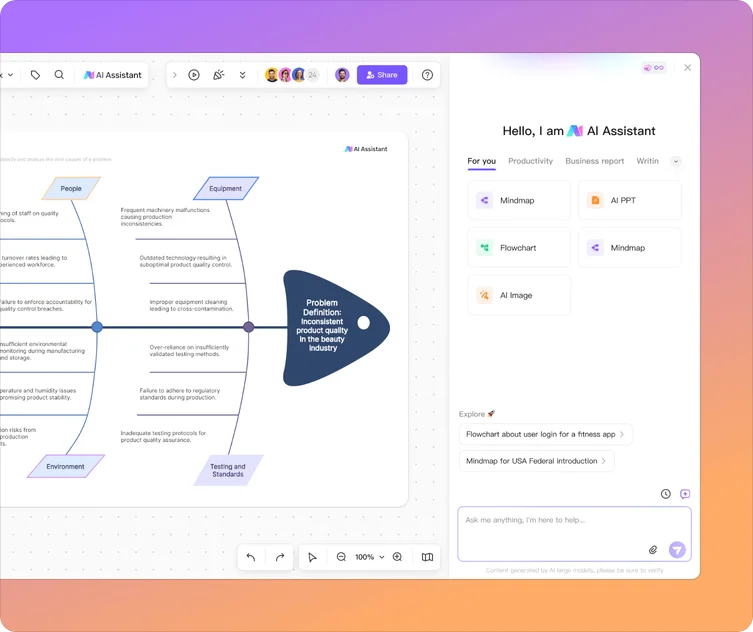
Turn a problem statement into an editable fishbone diagram. Use AI to suggest cause categories, then test the ideas with your team on Boardmix’s collaborative online whiteboard.
MAKE THE QUESTION VISIBLE
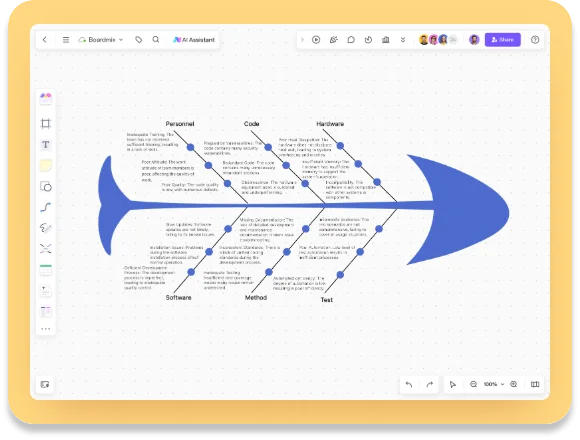
Use an Ishikawa diagram to separate a problem from the causes that might contribute to it. The visual structure helps a team widen the search before it narrows the work to causes that can be checked.
WORKED EXAMPLE
Suppose a team sees more checkout failures after a payment update. The diagram below is a starting hypothesis, not a finding. Each branch needs a source, an owner, and a check.
A PRACTICAL WORKFLOW
Boardmix AI helps with the first draft. Your team supplies the context, evidence, and decision about what to test next.
Describe what changed, where it appears, and when it started. Avoid putting a suspected cause in the effect statement.
Enter the problem in the hero prompt. AI can expand the map into people, process, technology, policy, measurement, or categories that fit your context.
Invite teammates to add sources and mark unknowns. Keep the map editable so a new observation can change the branch without rewriting the whole analysis.
Use votes, comments, and linked notes to choose a small, observable check. A fishbone diagram narrows the investigation; it does not prove a root cause by itself.
WHY BOARDMIX
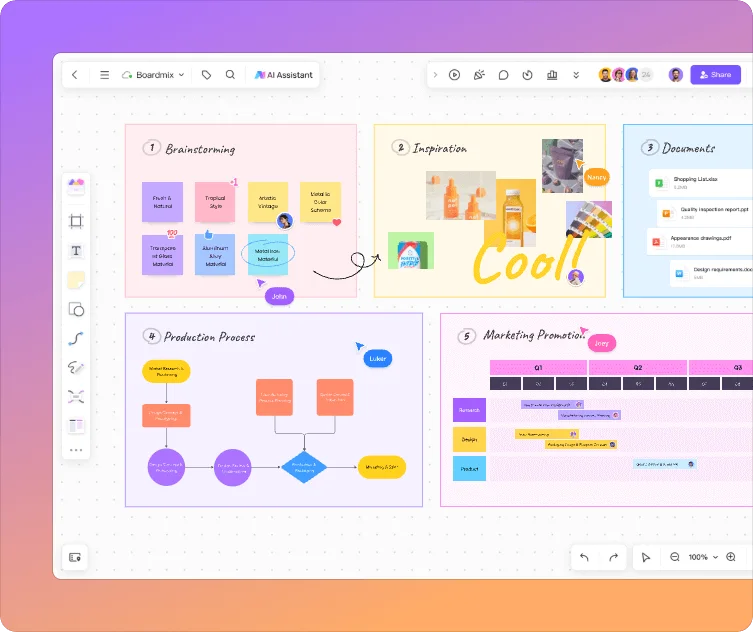
A fishbone is most useful when the team can move from a cause hypothesis to the material that can confirm or challenge it. Boardmix gives the investigation room to grow beyond one diagram.
FROM ANALYSIS TO ACTION
When a branch looks important, pull the relevant notes into view, assign a follow-up, and connect the result to a process or project plan. The canvas keeps the reasoning visible after the meeting ends.
Explore diagrams for the next step →TEAM CONTEXT
Invite operations, product, engineering, support, or quality teammates into the same board. Comments and live cursors make it clear which branch is being discussed and what still needs evidence.
See collaborative whiteboard workflows →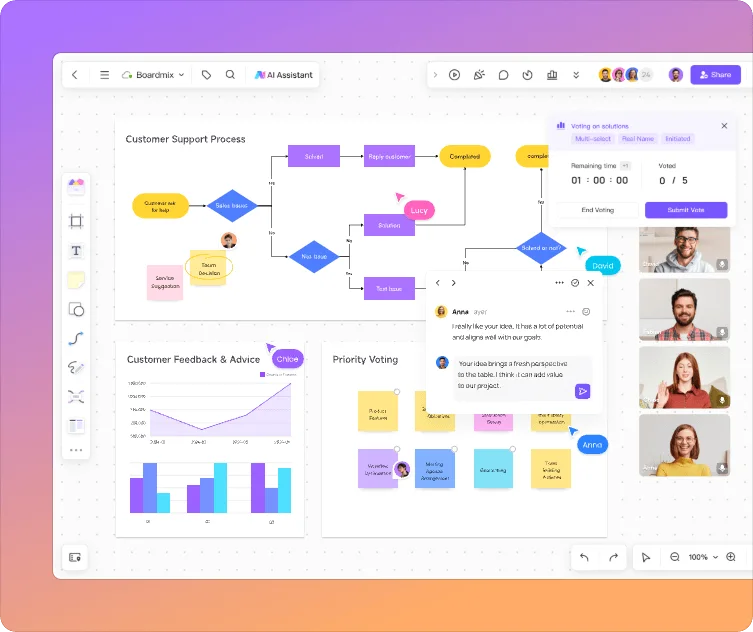
FISHBONE DIAGRAM FAQ
It creates an editable starting structure for a cause-and-effect or Ishikawa diagram from a problem description. The suggestions are hypotheses to investigate, not proof of a root cause.
Describe one observable effect, the context, and the time window. Add the process or audience involved. For example, “checkout failures increased after a payment update” gives the AI a clearer starting point than “payment problem.”
Manufacturing teams often use Man, Machine, Method, Material, Measurement, and Mother Nature or Environment. You can adapt the categories to software, services, healthcare, or another setting instead of forcing a manufacturing model.
Yes. Boardmix diagrams remain editable on the online whiteboard, where teammates can add notes, comment on branches, and connect the analysis to other diagrams or planning work.
No. It helps the team organize possible causes. Confirm important branches with observations, data, interviews, or controlled checks before changing a process.
Yes. Open the fishbone diagram template collection when you want a ready-made structure, or use the prompt above when you want AI to draft categories for a specific problem.
MAKE THE NEXT CHECK CLEAR
Generate an editable fishbone diagram, add the evidence you have, and decide what to investigate next.