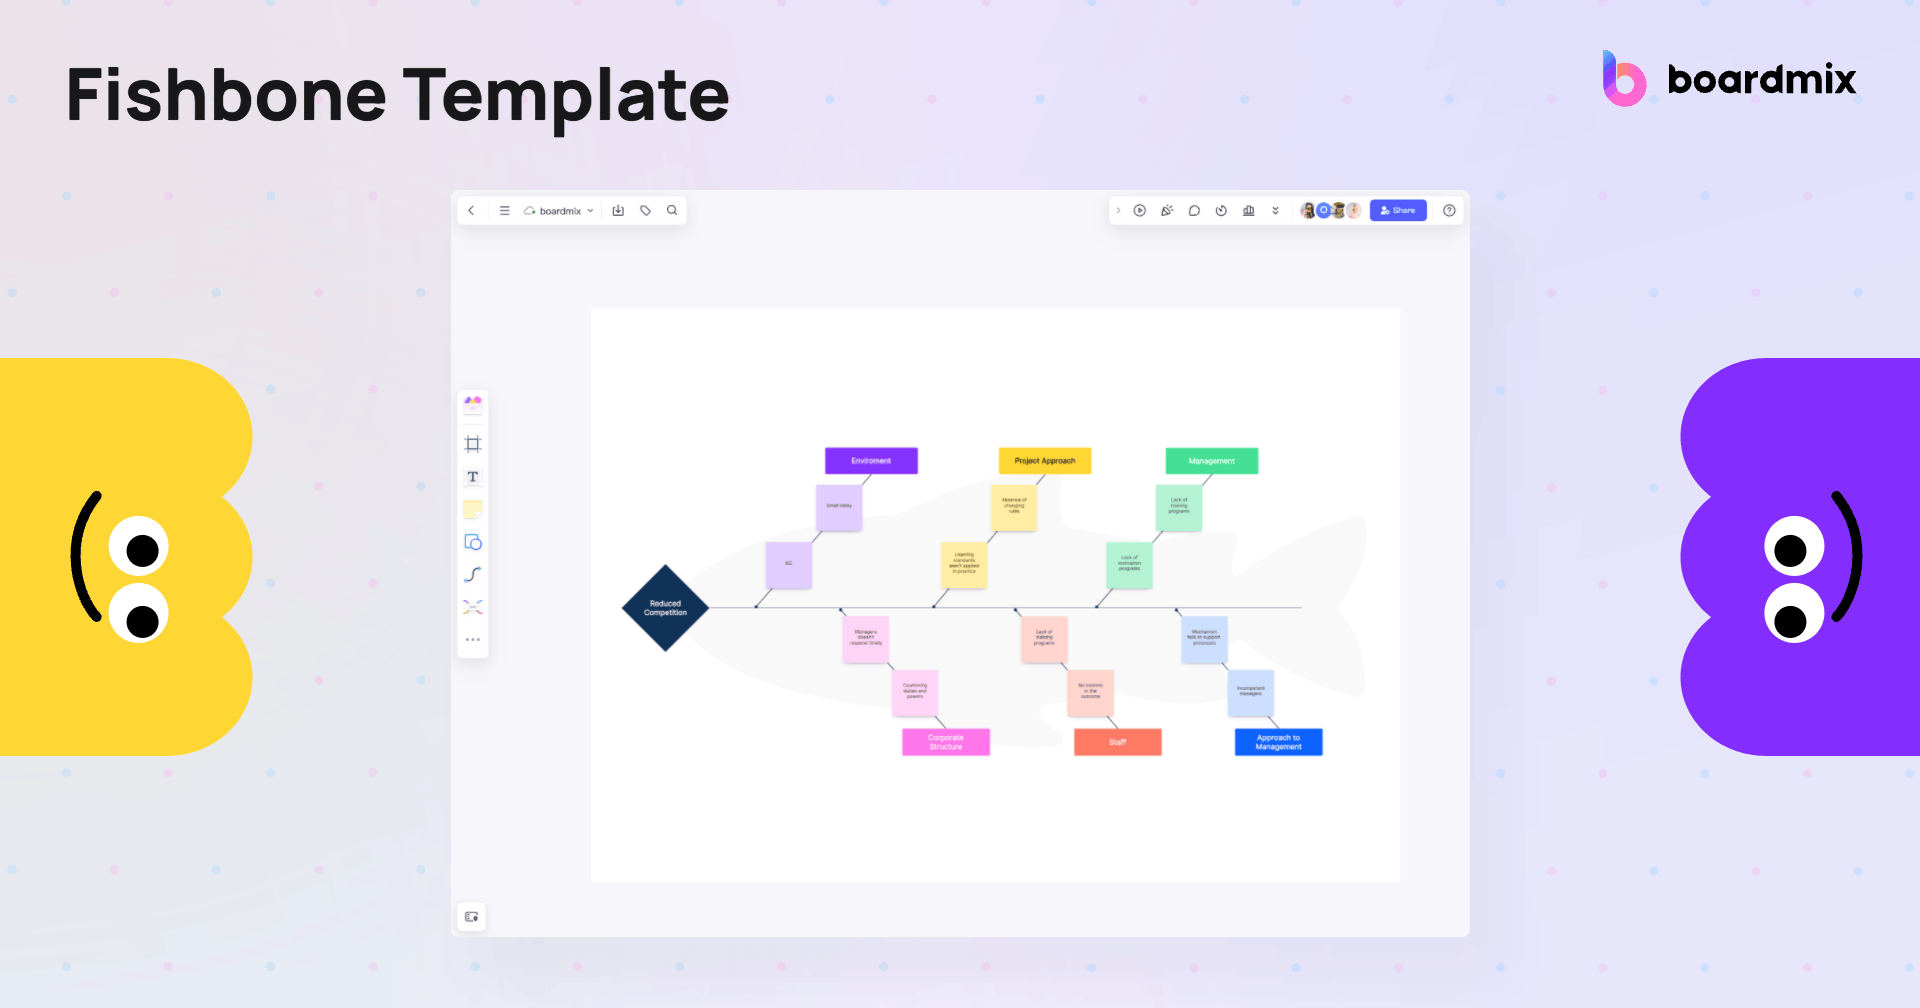
About the fishbone diagram template
Definition of fishbone diagram
A fishbone diagram is a discovery tool most managers use to identify the reasons for failures, defects, and variations within a business process. It generally breaks down, in layers, the root cause, which significantly contributes to a specific effect. The diagram is also called the cause-and-effect analysis, one of the main tools utilized during a root cause analysis.
Make Your Fishbone Diagram for Free
Whether it is the traditional drawing of the diagram on whiteboards or sketching its skeleton on digital boards, the bottom line is that this diagram promotes efficiency and improved problem-solving processes.
History and development of the fishbone diagram
Some call the fishbone diagram as Ishikawa diagram to honor a Japanese engineering professor, Kaoru Ishikawa. There are reports that the diagram has existed since the 1920s; however, Ishikawa popularized it and pioneered quality management techniques in the 1960s. Ishikawa was also notably responsible for implementing the quality management procedures for Kawasaki shipyards. Along the way, the fishbone has been helpful for most companies, not only for root-cause analysis but also during the design stage to prevent problems.
Importance of fishbone diagram in problem solving
The fishbone diagram is essential in problem-solving as it allows businesses to identify specific reasons for failures or defects of certain business processes. Along the way, your team can develop ways to address these concerns. Since the diagram contains several categories, you can also identify which of the stages of the process needs urgent resolutions.
When to Use the Fishbone Diagram Template
Fishbone diagram template is an incredibly useful tool that should be used whenever you need to conduct a thorough analysis of a problem or situation. It's particularly beneficial when you're dealing with complex issues where multiple factors could be contributing to the overall problem.
Fishbone diagram is often used in situations where a team needs to identify, explore, and visually display the various potential causes related to a problem or issue. It's especially effective when you need to delve into the root cause of a problem, rather than just addressing the symptoms.
One of the prime times to use the fishbone diagram template is during brainstorming sessions. It helps teams move beyond the obvious causes and delve deeper into what's driving an issue. This can lead to more robust solutions that address underlying issues rather than just patching up surface problems.
Another ideal time to use this tool is when you're dealing with a recurring problem. If you find yourself facing the same issue over and over again, there are likely deeper root causes that haven't been addressed. The fishbone diagram can help you uncover these hidden issues and develop strategies for resolving them.
Lastly, it's also beneficial to use this diagram when there's confusion about why a problem exists. By visually mapping out potential causes, teams can gain a clearer understanding of what's contributing to an issue and work towards resolving it.
Components of a Fishbone Diagram
The main problem statement
The main problem refers to the specific issue your team is facing. It pays to discuss this among the members to ensure everyone is on the same page. For every fishbone diagram, there must only be one issue to address. It would be confusing to cater to two problems in one chart.
Major categories/branches of potential causes
These categories refer to the factors which may be part of the problem. Like how your team decides on the main issue, everyone must agree on the significant branches you will put into the fishbone diagram. They could include systems, equipment, human resources, and external forces. They are primarily general ideas since you can specify them with sub-categories as you go along with your fishbone diagram template.
Sub-categories/branches of potential causes
Sub-categories are placed under each major category. These are the possible causes of the problem related to every main branch. You can expect multiple insights for your sub-categories; hence there must be thorough brainstorming to ensure you input only the essential details that can support the major category. The main and sub-categories must have an evident relationship to move forward with the diagram.
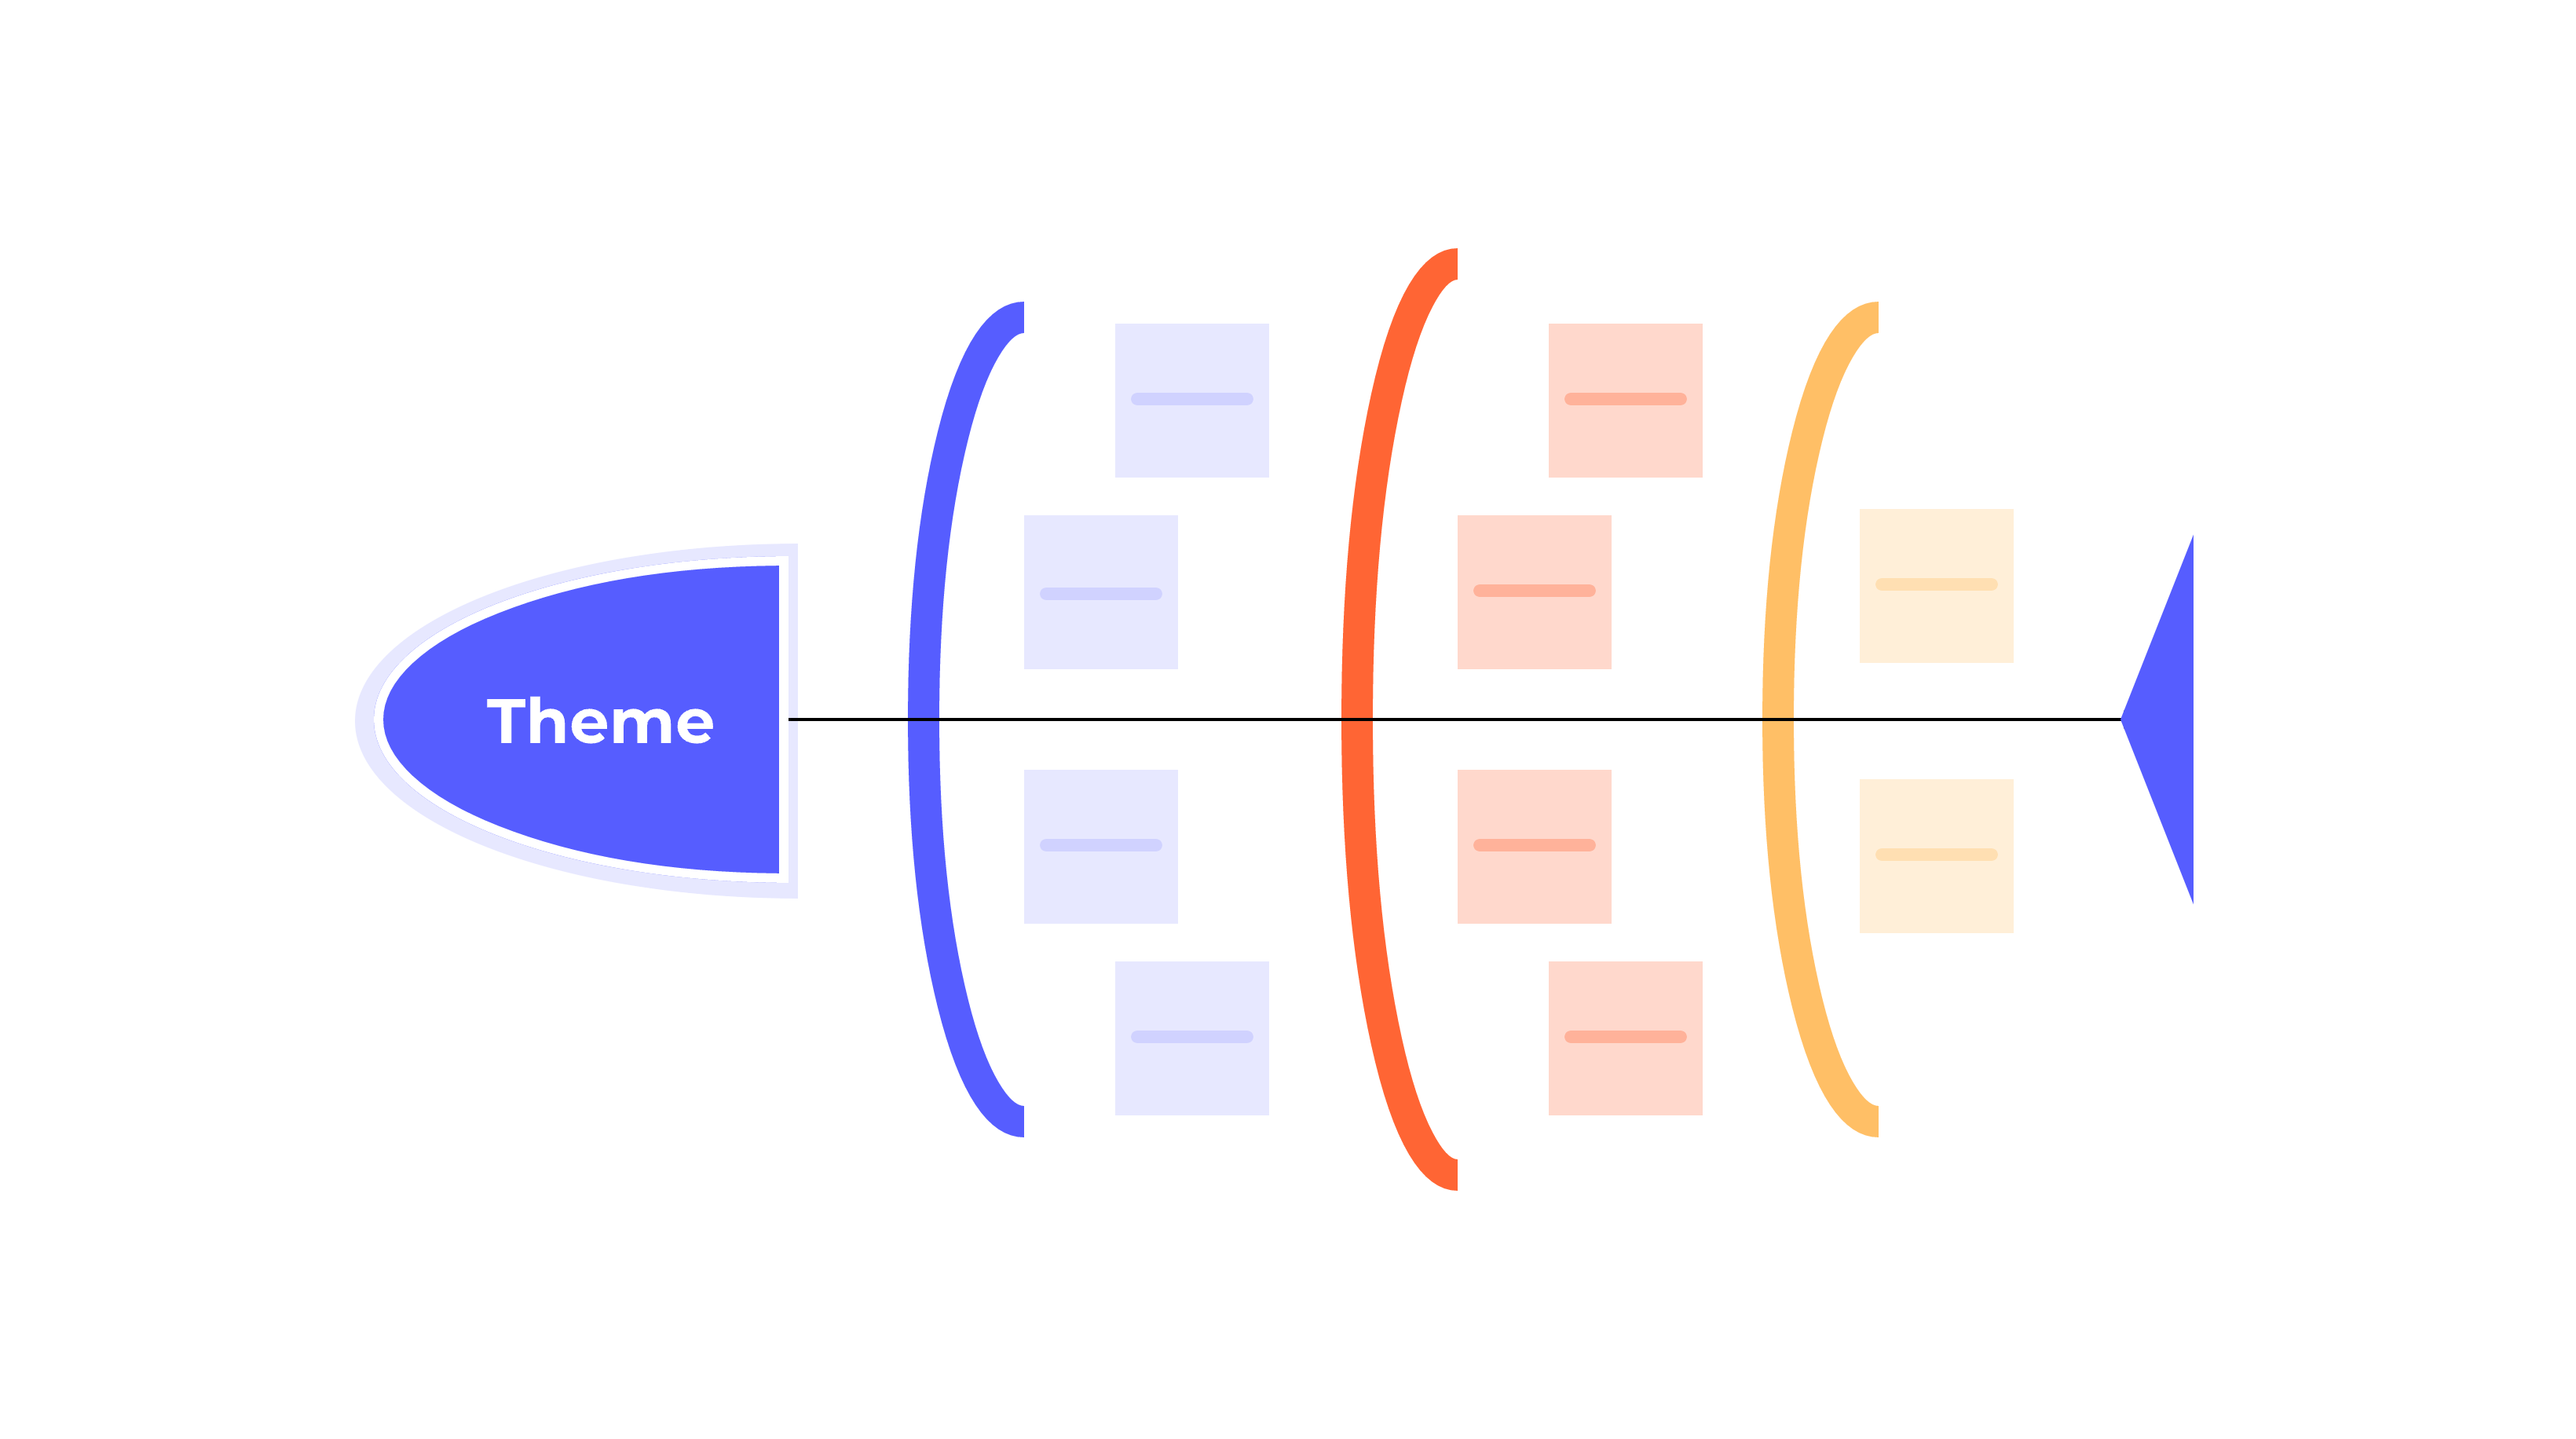
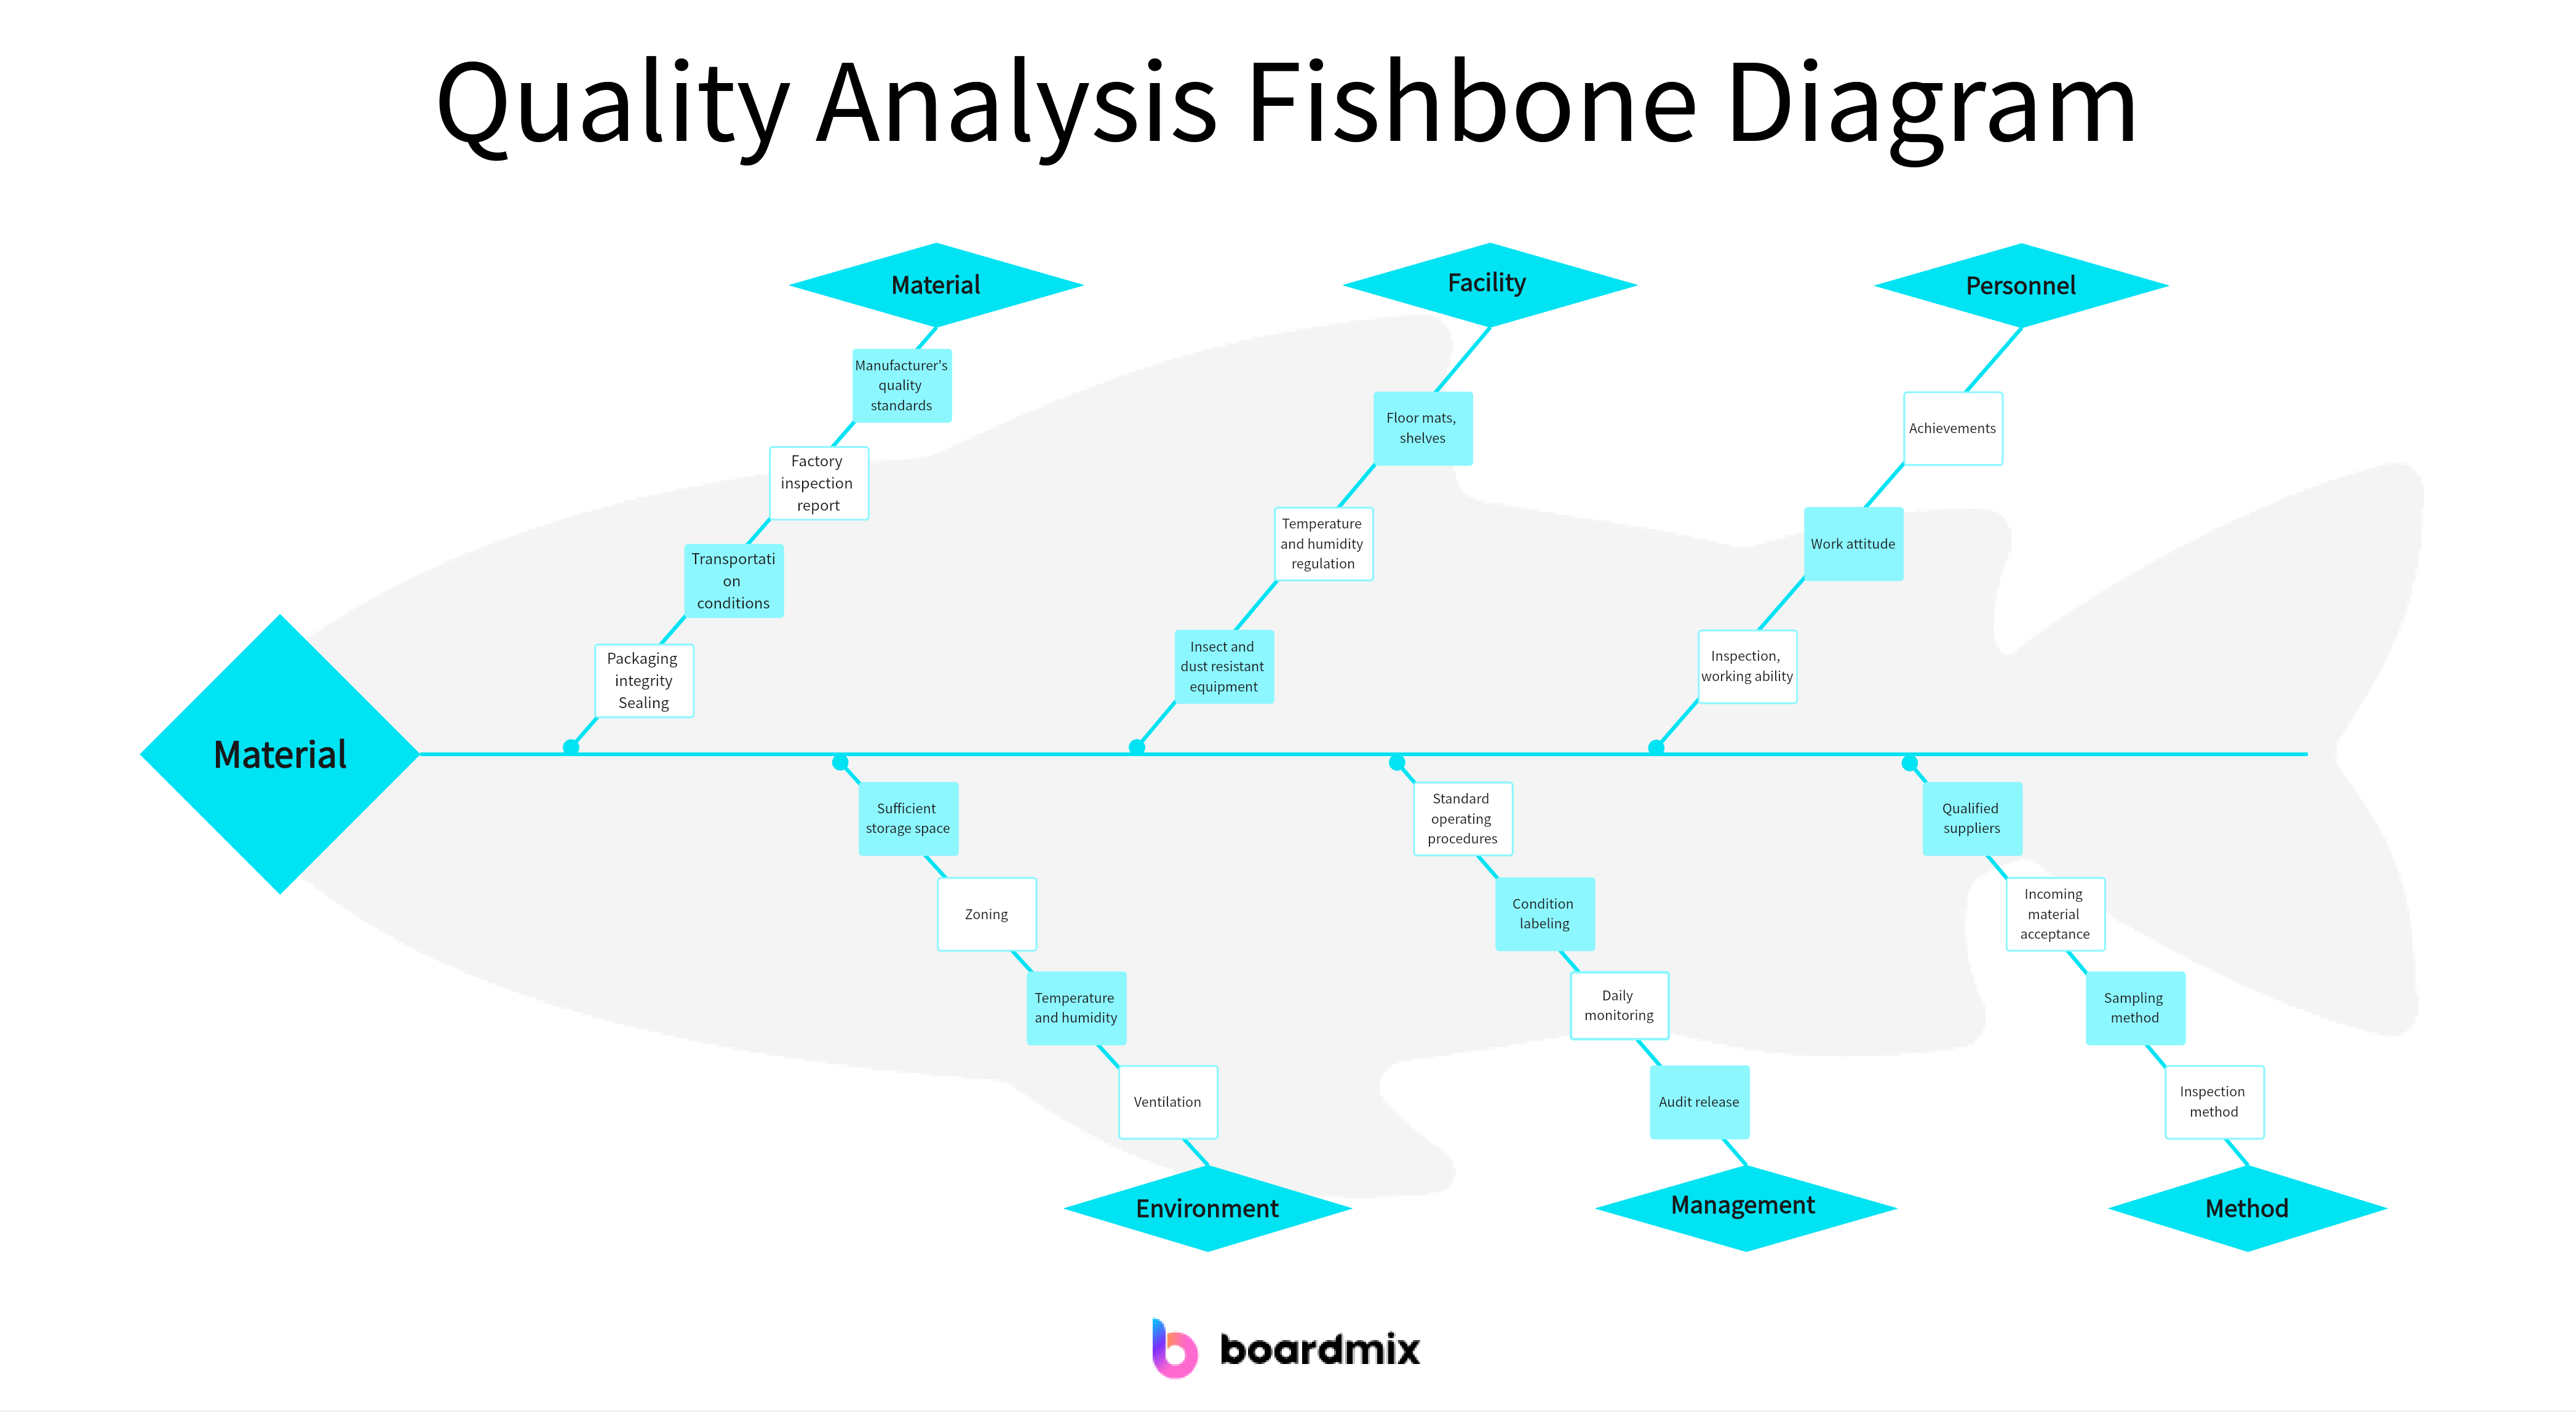
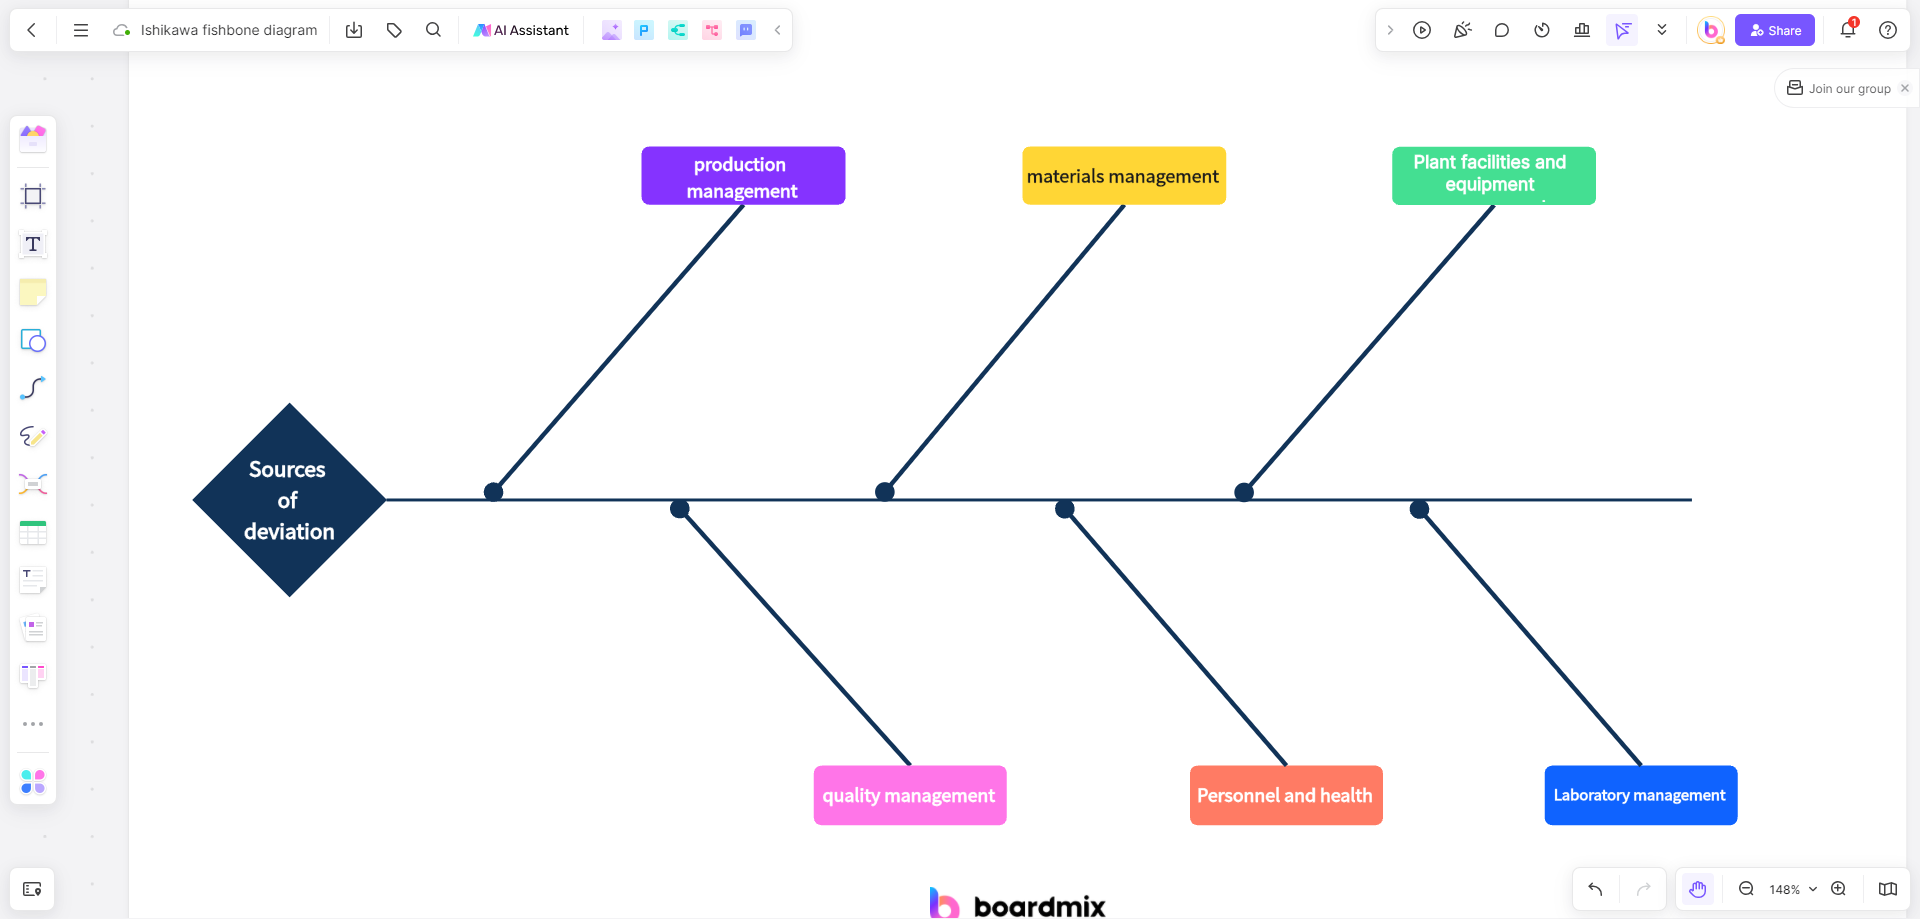
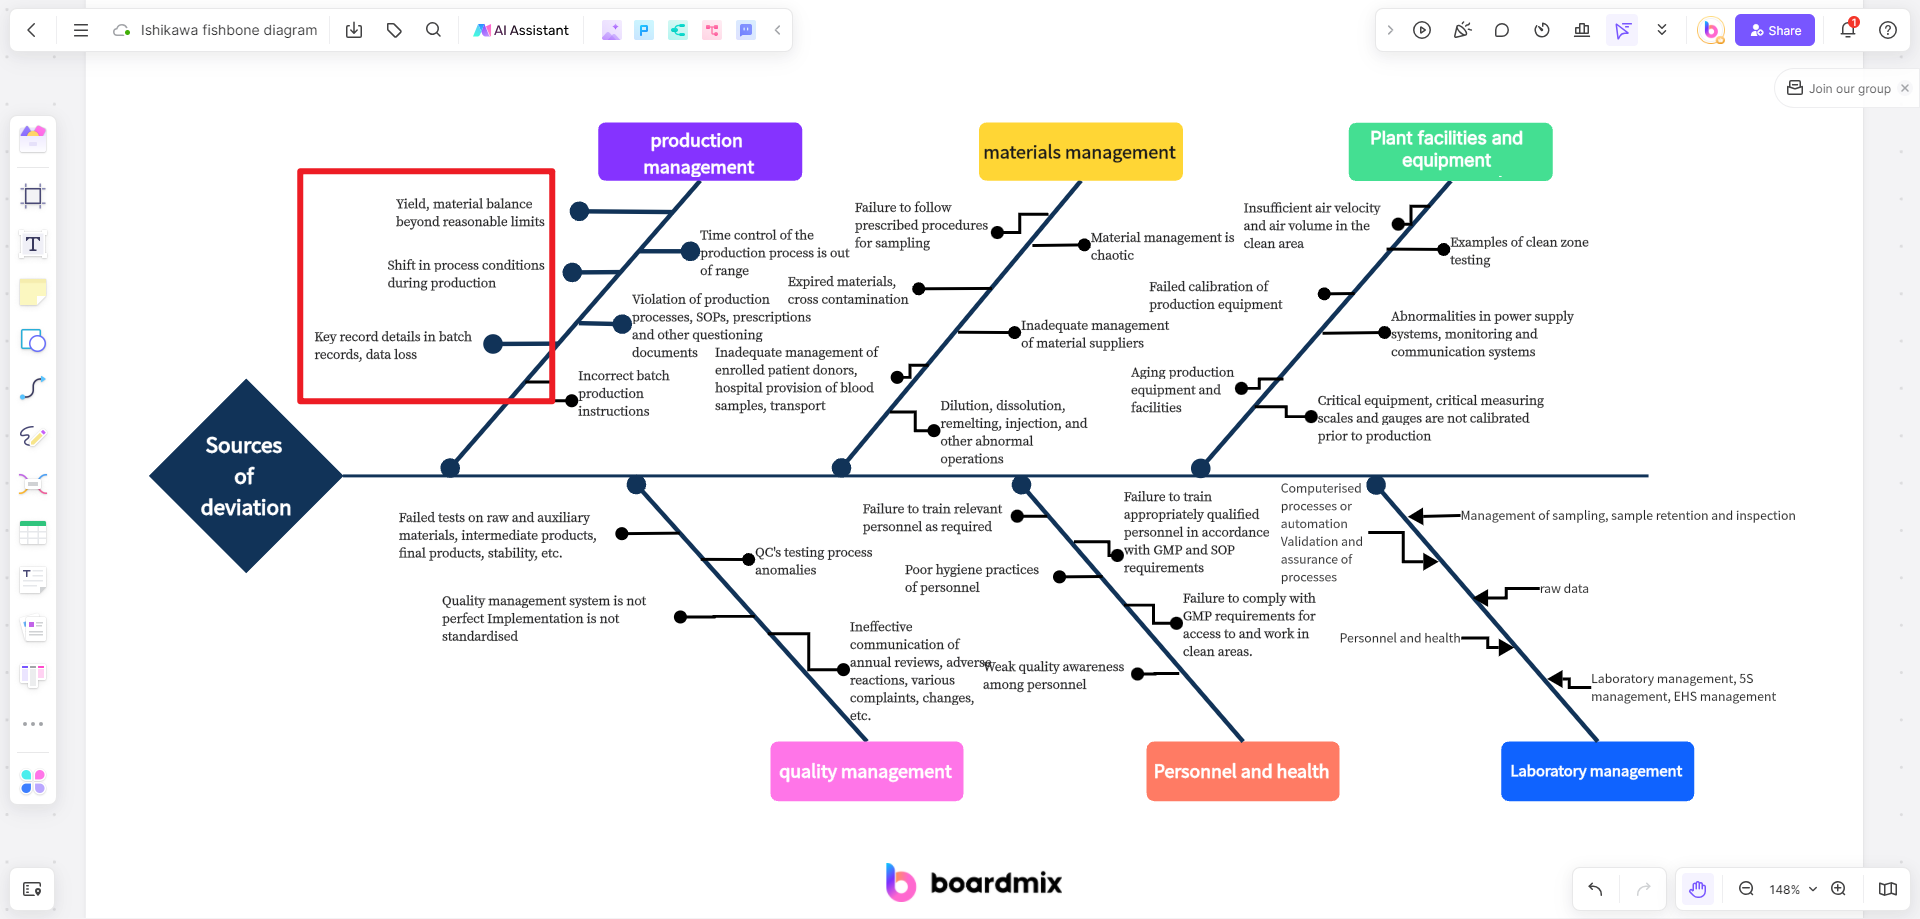
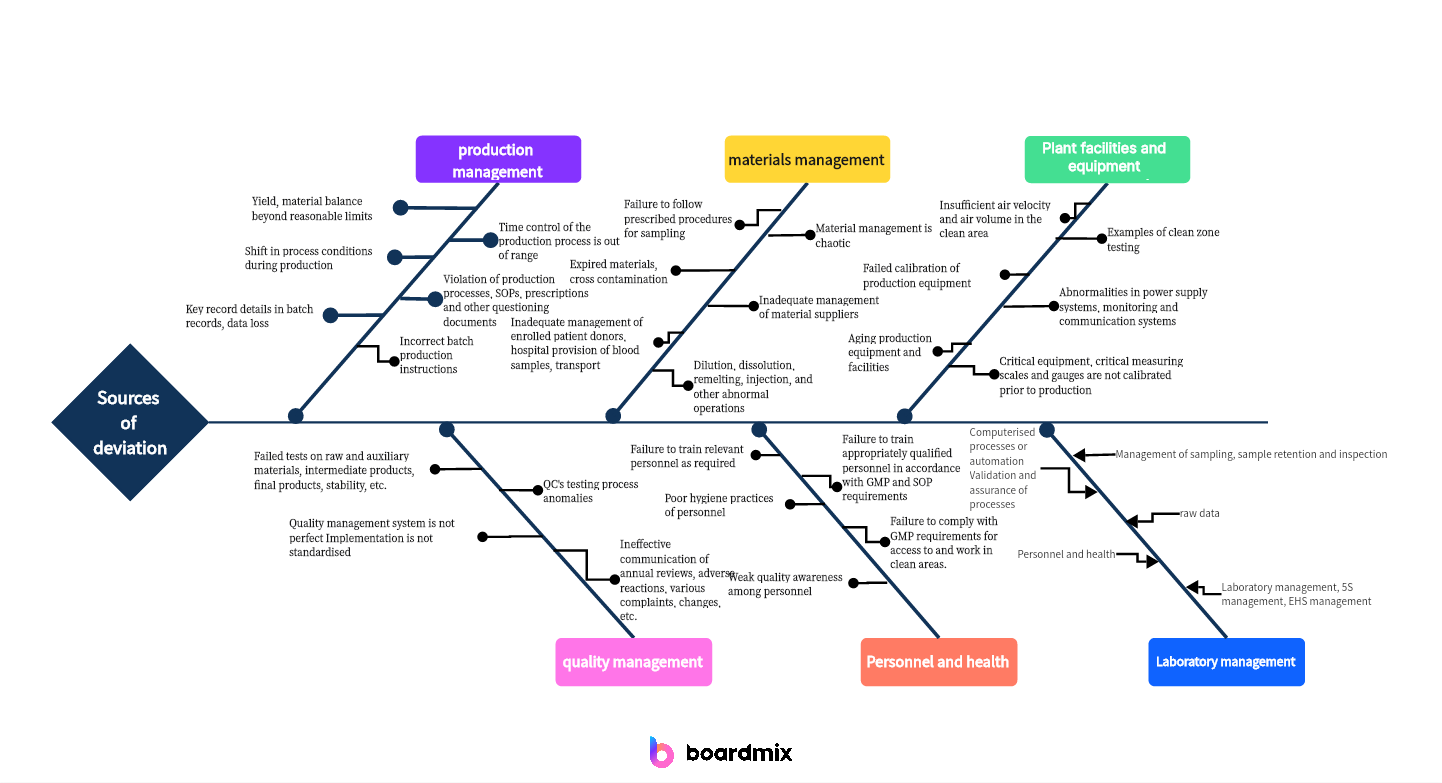
The fishbone diagram template
The fishbone diagram template looks similar to a fish. The problem (the effect on the illustration below) is at the fish's head, facing right. Meanwhile, the causes then extend to your left, which serves as the bones of the skeleton. The major reasons are those branches. The sub-categories are the small branches under each major cause. You can branch off to as many layers as you wish. Ensure they are still related to the main problem to be useful during the analysis.
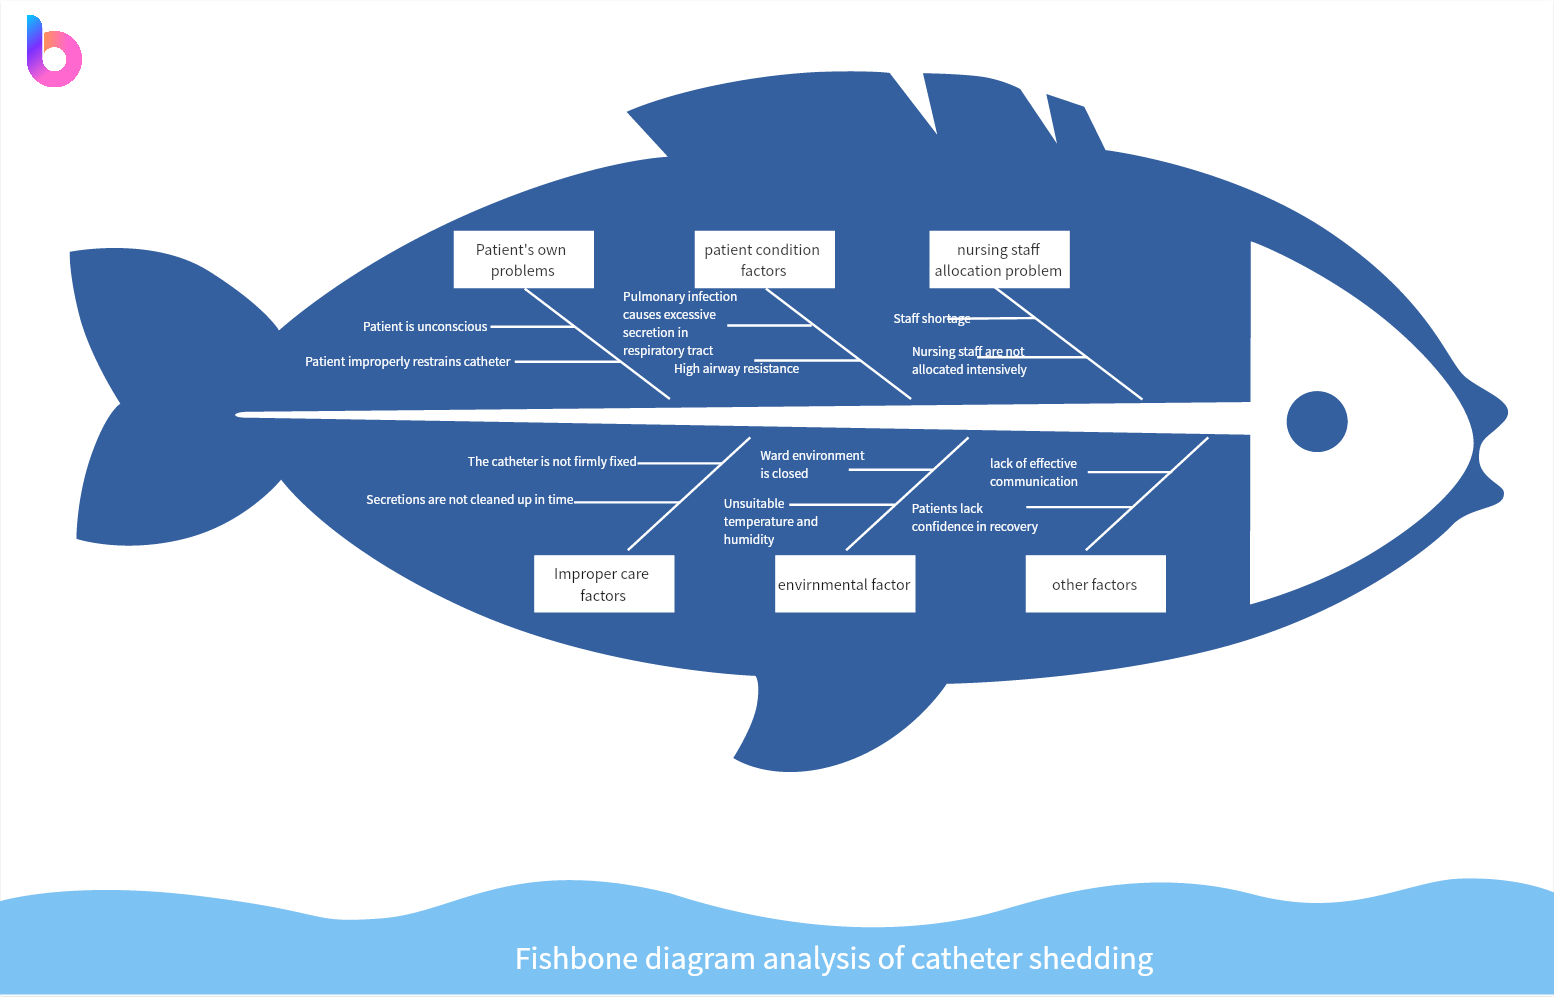
Ishikawa Fishbone Example
Make Your Fishbone Diagram for Free
- Define the problem: Identify the issue of catheter shedding that you want to analyze using the fishbone diagram.
- Identify major categories: Determine the main categories or causes that could contribute to catheter shedding. These categories could include factors like Material, Process, Manpower, Equipment, Environment, and Measurement. Brainstorm and list all possible causes under each category.
- Draw the backbone: Draw a horizontal line in the middle of the diagram as the backbone. Write "Catheter Shedding" on this line.
- Add major category branches: Extend lines from the backbone to represent each major category. Label each branch with the corresponding category name.
- Identify causes: For each major category, brainstorm and list all possible causes that could contribute to catheter shedding. Add these causes as smaller branches extending from the corresponding major category branch.
- Analyze causes: Evaluate each cause and consider its potential impact on catheter shedding. Use tools like data analysis, process observation, or expert knowledge to assess the causes. Document your findings and observations under each cause branch.
- Identify sub-causes: If necessary, further break down the causes into sub-causes or sub-factors. Add these sub-causes as smaller branches extending from the corresponding cause branch.
- Analyze sub-causes: Evaluate each sub-cause and consider its potential impact on catheter shedding. Document your findings and observations under each sub-cause branch.
- Identify root causes: Based on your analysis of causes and sub-causes, identify the primary or root causes of catheter shedding. These are the underlying factors that directly contribute to the problem. Focus your attention on addressing these root causes rather than just treating the symptoms.
- Propose solutions: For each root cause, brainstorm and propose potential solutions or actions that can address the cause of catheter shedding. Document your recommendations under each root cause branch.
- Implement solutions: Select and implement the most feasible and effective solutions based on your analysis and recommendations. Monitor the results and evaluate their impact on solving the problem of catheter shedding.
Cause and Effect Fishbone Diagrams
Make Your Fishbone Diagram for Free
- Quality Issue: Start by identifying the quality issue or problem that needs to be analyzed. This could be a defect, error, or any other quality-related issue.
- Major Categories: Create the main branches of the fishbone diagram, representing the major categories of potential causes. Common categories include People, Methods, Machines, Materials, Measurements, and Environment. These categories are often referred to as the 6Ms.
- Causes: Under each major category, identify the specific causes or factors that could contribute to the quality issue. For example, under the People category, causes could include lack of training, inadequate skills, or poor communication. Under the Methods category, causes could include incorrect procedures, lack of standardization, or outdated processes.
- Sub-causes: For each cause identified, you can further break it down into sub-causes or contributing factors. This helps to identify the root causes of the quality issue. For example, if the cause is lack of training, sub-causes could include budget constraints, time constraints, or lack of access to training resources.
- Analysis: Once all the causes and sub-causes have been identified, analyze their relationships to the quality issue. Determine which causes are most likely to contribute to the problem and prioritize them for further investigation or action.
- Solutions: Based on the analysis, develop appropriate solutions or actions to address the identified causes and improve the overall quality. These solutions can be implemented to prevent future occurrences of the quality issue.
Steps in Creating a Fishbone Diagram
Identify the problem or issue to be addressed
Ensure that team members agree upon the problem. The problem you identified will serve as the head of the fishbone diagram. Besides identifying the problem, you can add details like where and when the issue occurred. It is more specific.
Determine the major categories of potential causes
The backbone of the diagram is where your major categories will be. You can add lines or boxes branching from the backbone to represent the cause categories. Most businesses focus on the six Ms, including workforce, material, mother nature, measurement, method, and machine. You can have more main categories if your team finds it necessary.
Identify and list the sub-categories of potential causes
The sub-categories serve as the branches of the main cause categories. You can list all elements related to every category and discuss with your team which to include in the diagram. Remember that you can delve deeper and add mini branches under the sub-categories. All ideas must be considered during this phase before deciding what to place on the fishbone diagram. This means you can gather as many insights as possible; and ensure they relate to the leading causes. Assigning colors or shapes for every main reason would be fitting to avoid confusion during data collection.
Draw the fishbone diagram
You can draw your fishbone diagram template using shapes, images, and stickers. Remember that the diagram must look like a fish. There are diagramming tools online that you can use. They are more flexible as you can incorporate different colors for your main causes and the branches. Most are even editable, making modifying some points in the diagram easier when needed.
The shape and orientation of your diagram will not matter - whether it is upwards or sideways, so long as it follows the structure of a fish. You can even use lines to complete the diagram.
Analyze potential causes and determine the root cause(s)
After filling the fishbone diagram with all the necessary details, your team must examine the potential causes of the diagram and find the root cause of the problem. As you would know, these things are easier said than done since each member might have varied opinions and ideas.
There needs to be brainstorming before deciding the root causes of the problem at hand. Along the way, you can generate better resolutions to fix the concerns involved in your fishbone diagram.
Develop solutions and recommendations
Identifying the root causes is one hurdle while coming up with solutions and recommendations is another agenda you must address. It pays to be more specific as you develop solutions to the issues. This is to ensure your business will not be addressing the same problem in the future. It is also like solving the issue and preventing it from recurring. You can save time, effort, and other logistics.
Benefits of Using a Fishbone Diagram
Improved problem-solving skills
Since the fishbone diagram template is your guide to problem-solving, there will not be assumptions and guesses. As a result, your team will have a strategic approach to solving issues concerning the organization. As you know, these issues might be about business processes, so the earlier you detect and resolve the problem, the better it will be for your business operations.
A better understanding of the problem and its potential causes
As you expand the branches under the main causes, you will better grasp the factors affecting your main concern. Additionally, the fishbone diagram template gives you a clearer picture of the issue allowing your team to address it accordingly. In short, the diagram will have no vague insights since you can make your illustration as specific as possible.
Enhanced communication and collaboration among team members
The fishbone diagram template promotes collaboration, and along with that comes healthier communication among members. You know that creating the diagram is not a one-person show. Each member must actively contribute to develop the best possible insights for the diagram. Besides the team members, the use of this tool welcomes better interaction and collaboration with other departments. This applies explicitly to broader issues that might need inputs from different areas within the company.
As you consult other sectors within the company, your organization will experience a more harmonious working environment.
Improved decision-making and problem resolution
Teams will not be second-guessing the recommendations they must perform to solve the problem at hand. You can expect better decision-making once you grasp your fishbone diagram entirely. The solutions and recommendations are specific enough to address the issue accordingly.
Create Your Fishbone Diagram on Boardmix
Boardmix is an online tool that allows you to create fishbone diagrams easily. With Boardmix, you can quickly and efficiently analyze the causes of a problem and identify potential solutions. Here's how you can use Boardmix:
1. Visit the Boardmix website and sign up for an account.

2. Once you're logged in, click on the "Create Diagram" button.
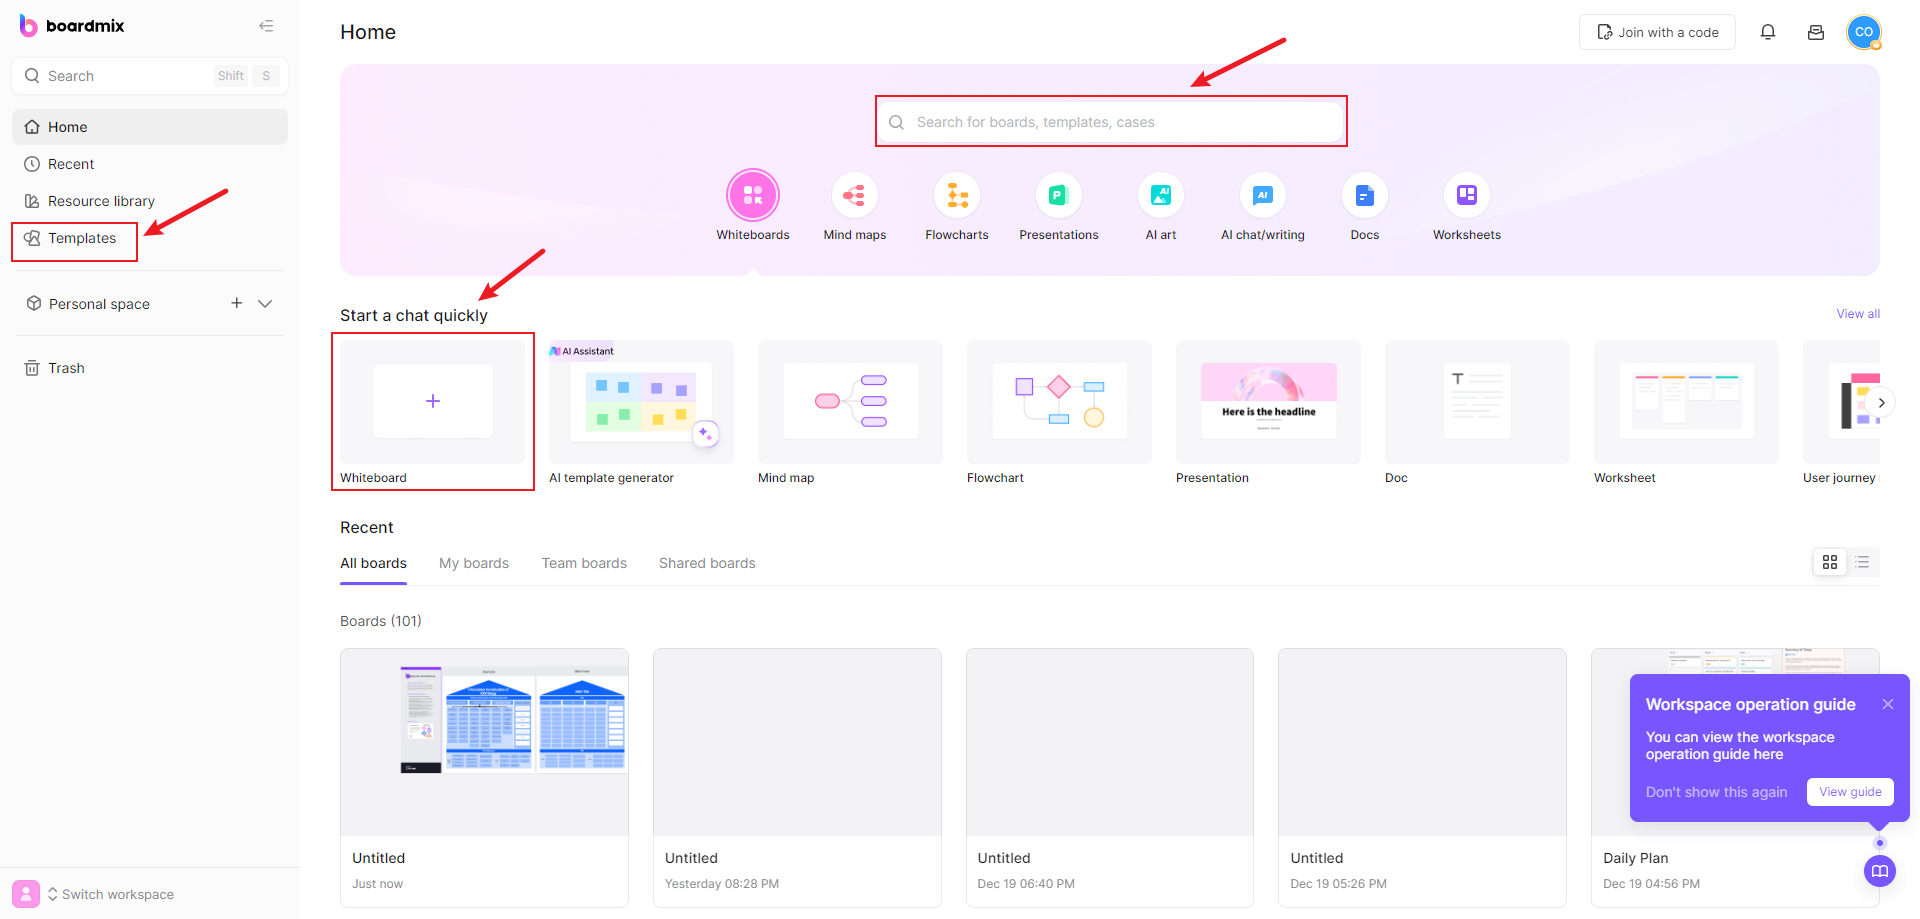
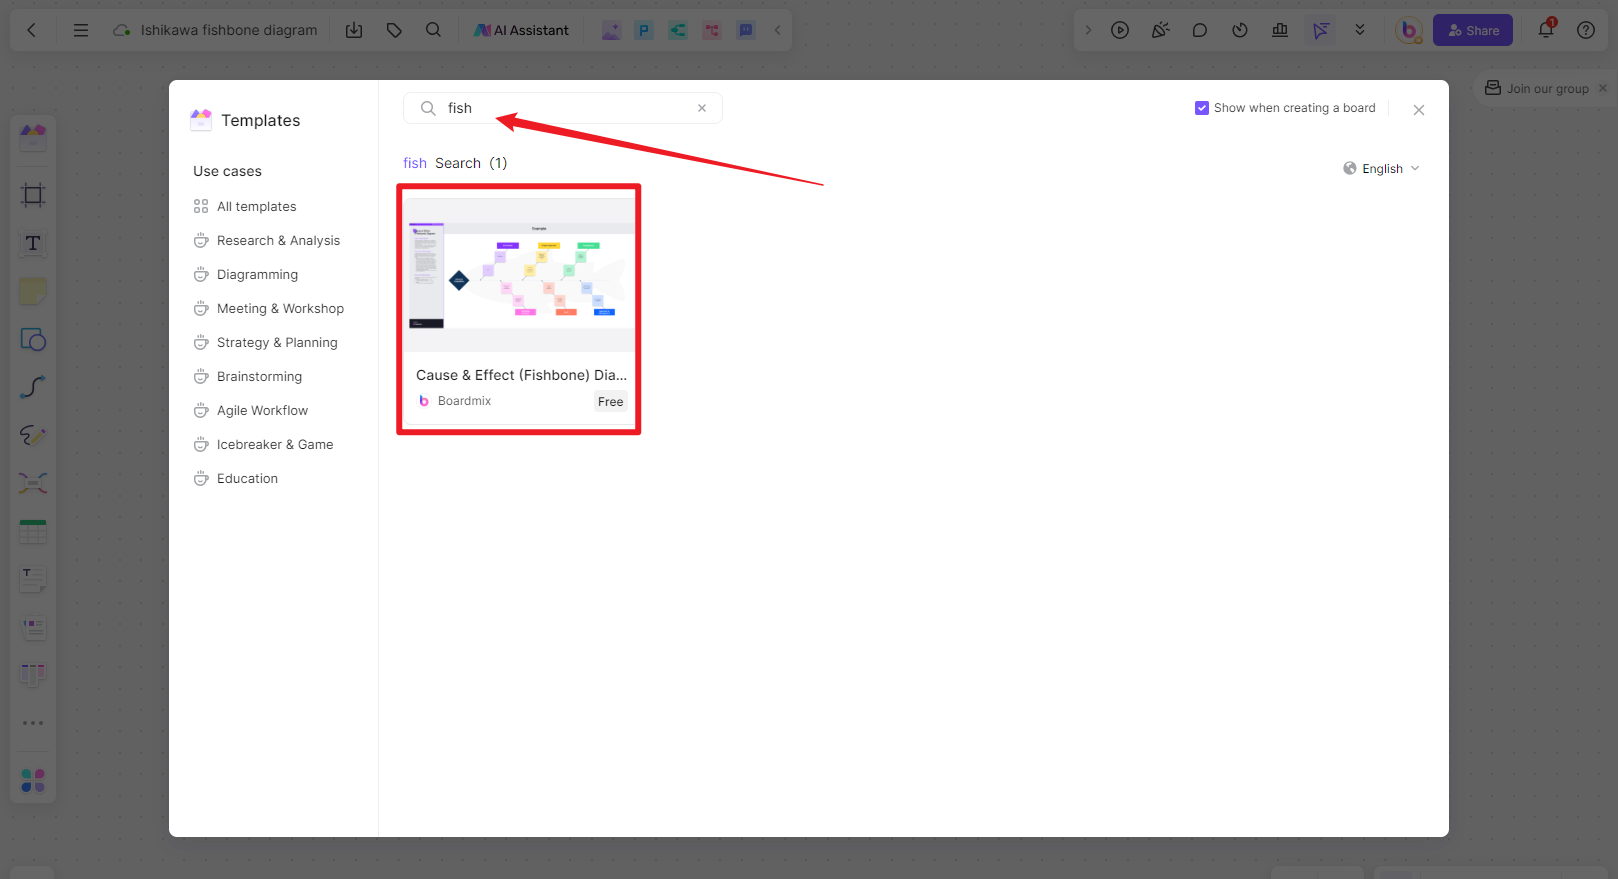
3. Select the fishbone diagram template from the available options.
4. Start by defining the problem or issue you want to analyze. Type it in the main title section of the diagram.
5. Identify major categories that could contribute to the problem. These categories could include factors like Material, Process, Manpower, Equipment, Environment, and Measurement. Add these categories as branches extending from the main title.
6. Add causes to each major category branch. Brainstorm and list all possible causes that could contribute to the problem. Add these causes as smaller branches extending from the corresponding major category branch.
7. Analyze each cause and consider its impact on the problem. You can add additional information or details under each cause branch to further explain or support your analysis.
8. If necessary, you can break down causes into sub-causes or sub-factors. Add these sub-causes as smaller branches extending from the corresponding cause branch.
9. Analyze each sub-cause and consider its impact on the problem. Document your findings or observations under each sub-cause branch.
10. Once you've identified the root causes of the problem, focus on proposing solutions or actions that can address these root causes. Add these solutions as branches extending from the corresponding root cause branch.
11. Evaluate and select the most feasible and effective solutions based on your analysis. You can add additional notes or details under each solution branch to further explain or support your recommendations.
12. Share and collaborate on your fishbone diagram with others if needed. Boardmix allows you to invite team members or stakeholders
to view and edit the diagram together.
By using Boardmix, you can streamline the process of creating a fishbone diagram and collaborate effectively with your team or colleagues. Start using Boardmix today to improve problem-solving and decision-making in your organization!
Conclusion
The fishbone diagram has guided companies in resolving issues in various organizations for decades. Other businesses use this tool to prevent future problems affecting business operations. Regardless of your one's purpose, the fishbone diagram template makes problem-solving more efficient and concise.
Technology makes it easier for organizations and businesses to develop solutions through fishbone diagrams. Today, more diagramming tools are available online, which your teams can utilize. You can skip the conventional drawing of the fishbone diagram template and shift it to a more convenient way. Most importantly, you can collaborate with other members as the diagram can be accessed by other members wherever they may be.