


What is the Ishikawa diagram used for?
Ishikawa fishbone diagram, also known as a cause-and-effect diagram, can represent the possible causes of a specific problem or event visually. It helps identify and categorize the potential root causes by breaking them down into different categories, such as people, methods, machines, materials, measurements, and the environment. The diagram allows for a systematic analysis of the problem, enabling individuals or teams to identify the primary causes and develop appropriate solutions.
What are the types of Ishikawa fishbone diagrams?
Several types of Ishikawa fishbone diagrams can be used to analyze different aspects of a problem. Some common types include:
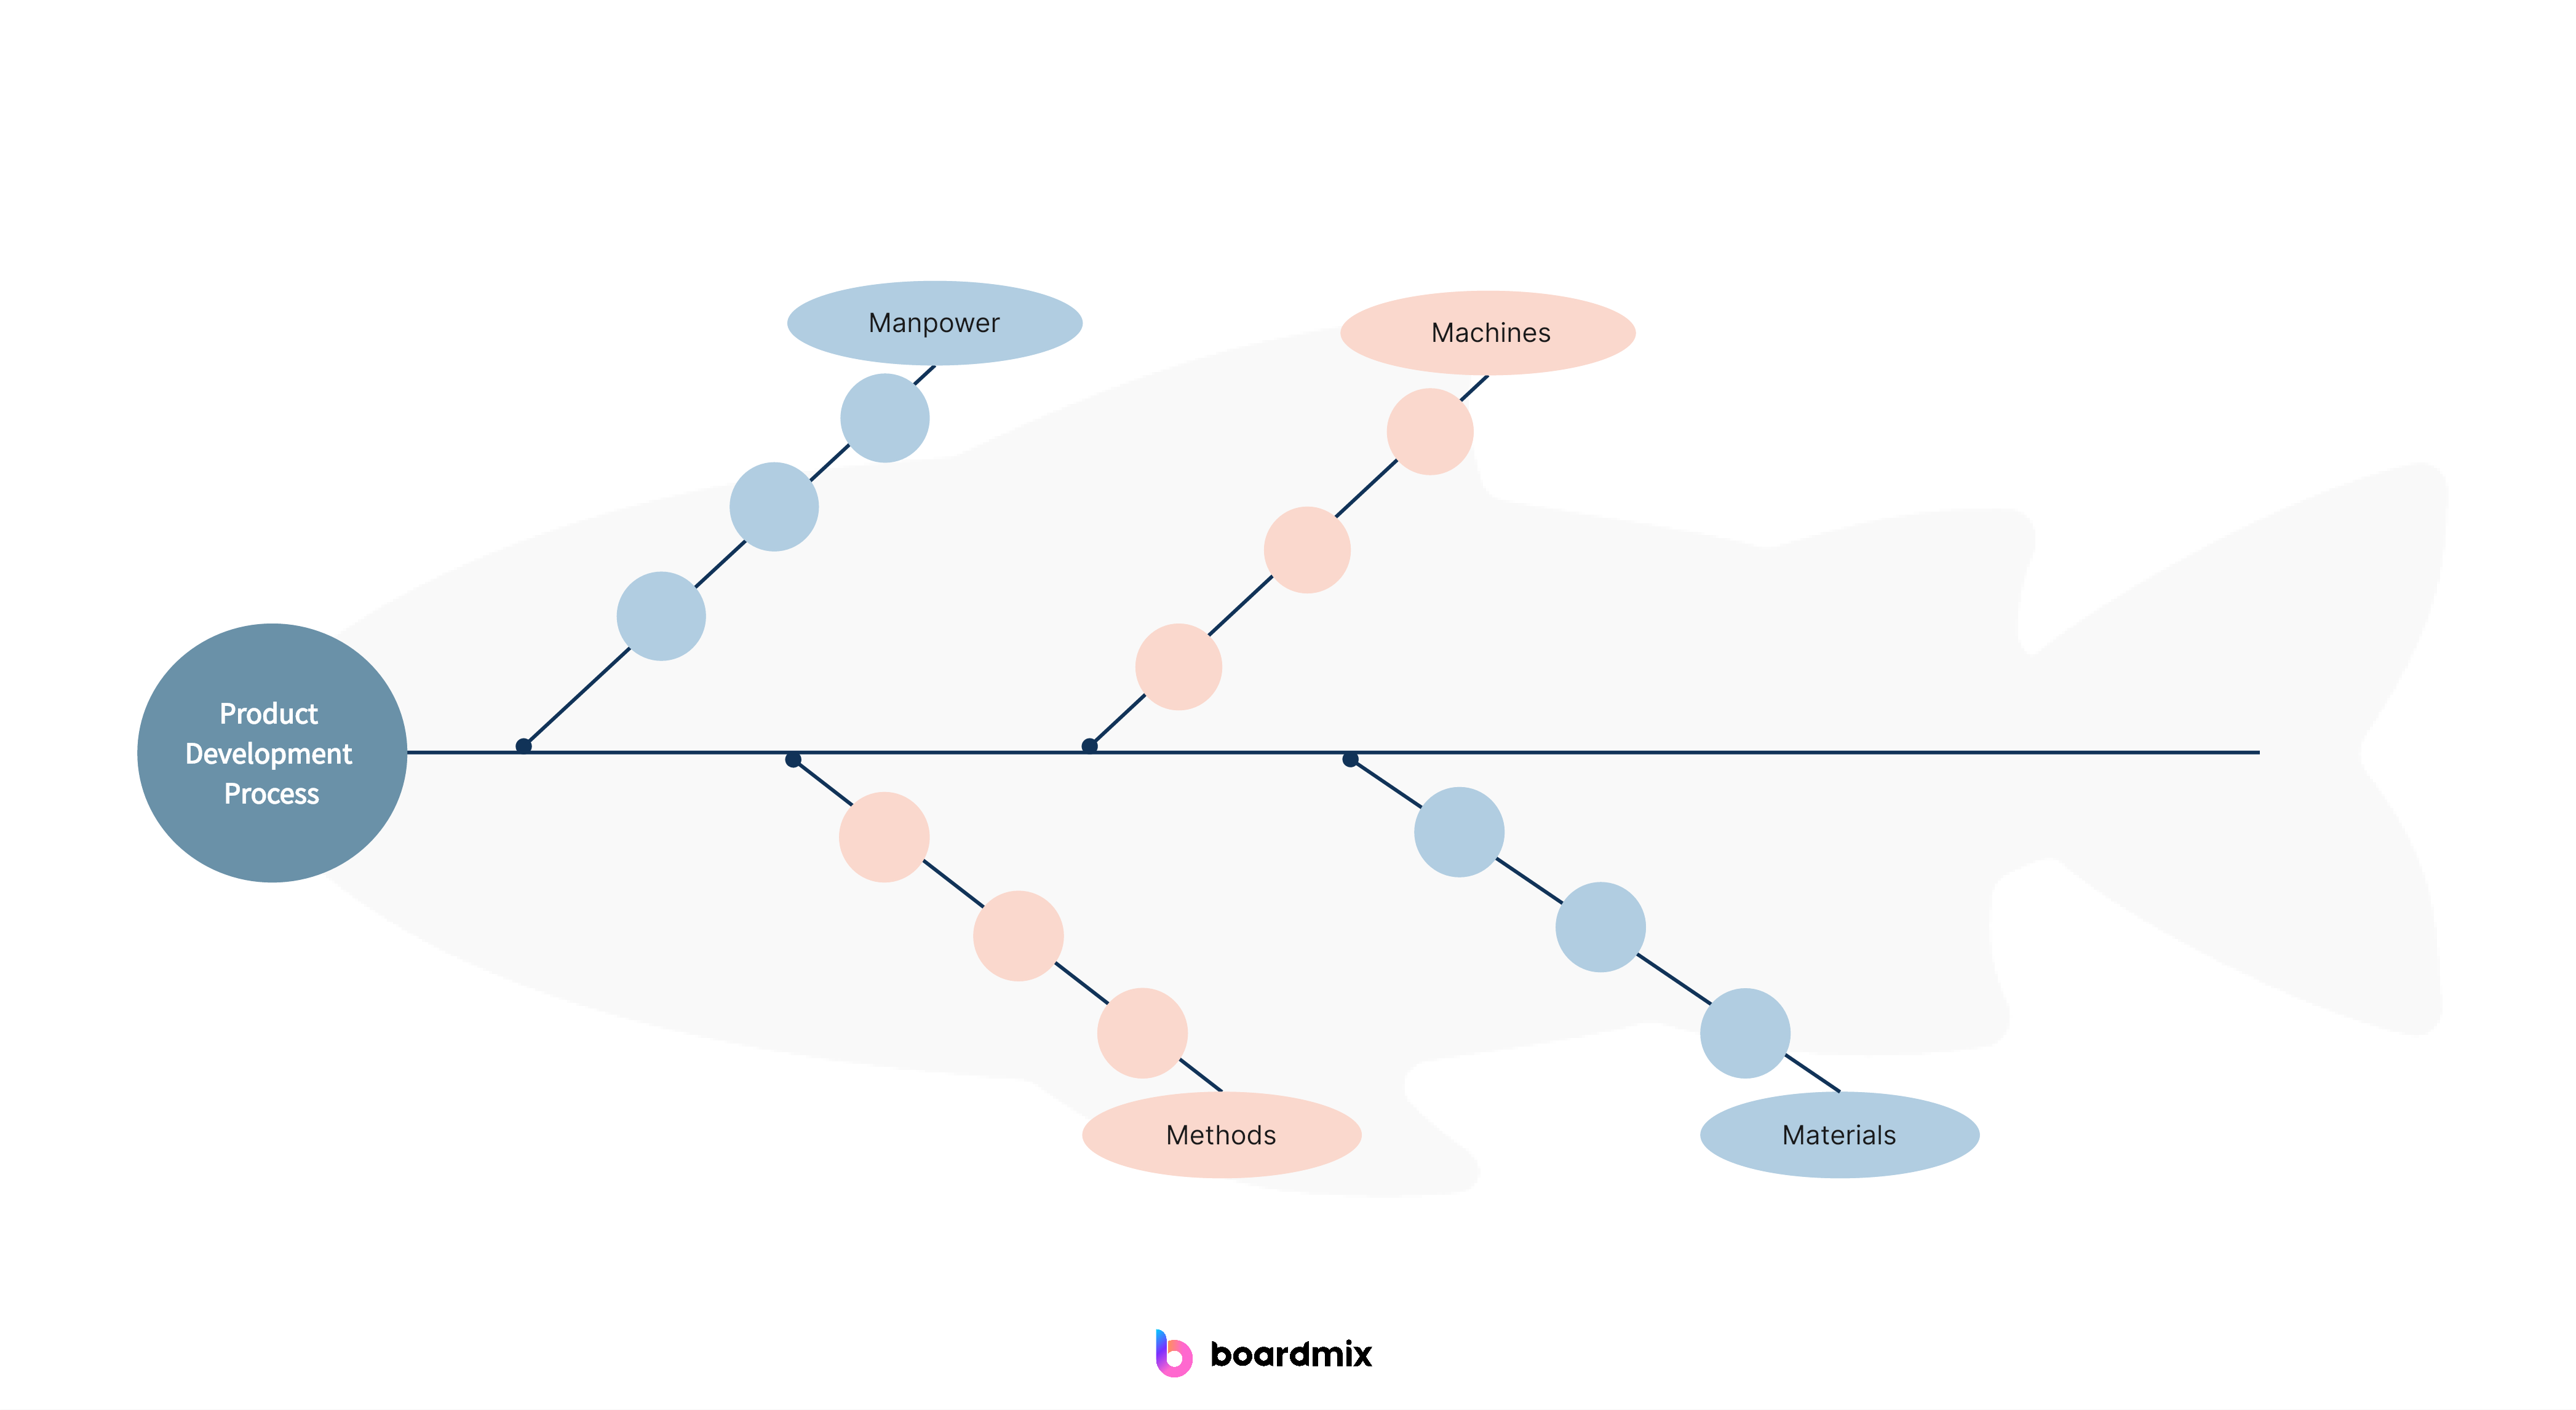
- 4M Diagram: This type of fishbone diagram focuses on four main categories: Manpower (people), Methods, Machines, and Materials. It is often used in manufacturing or production processes.
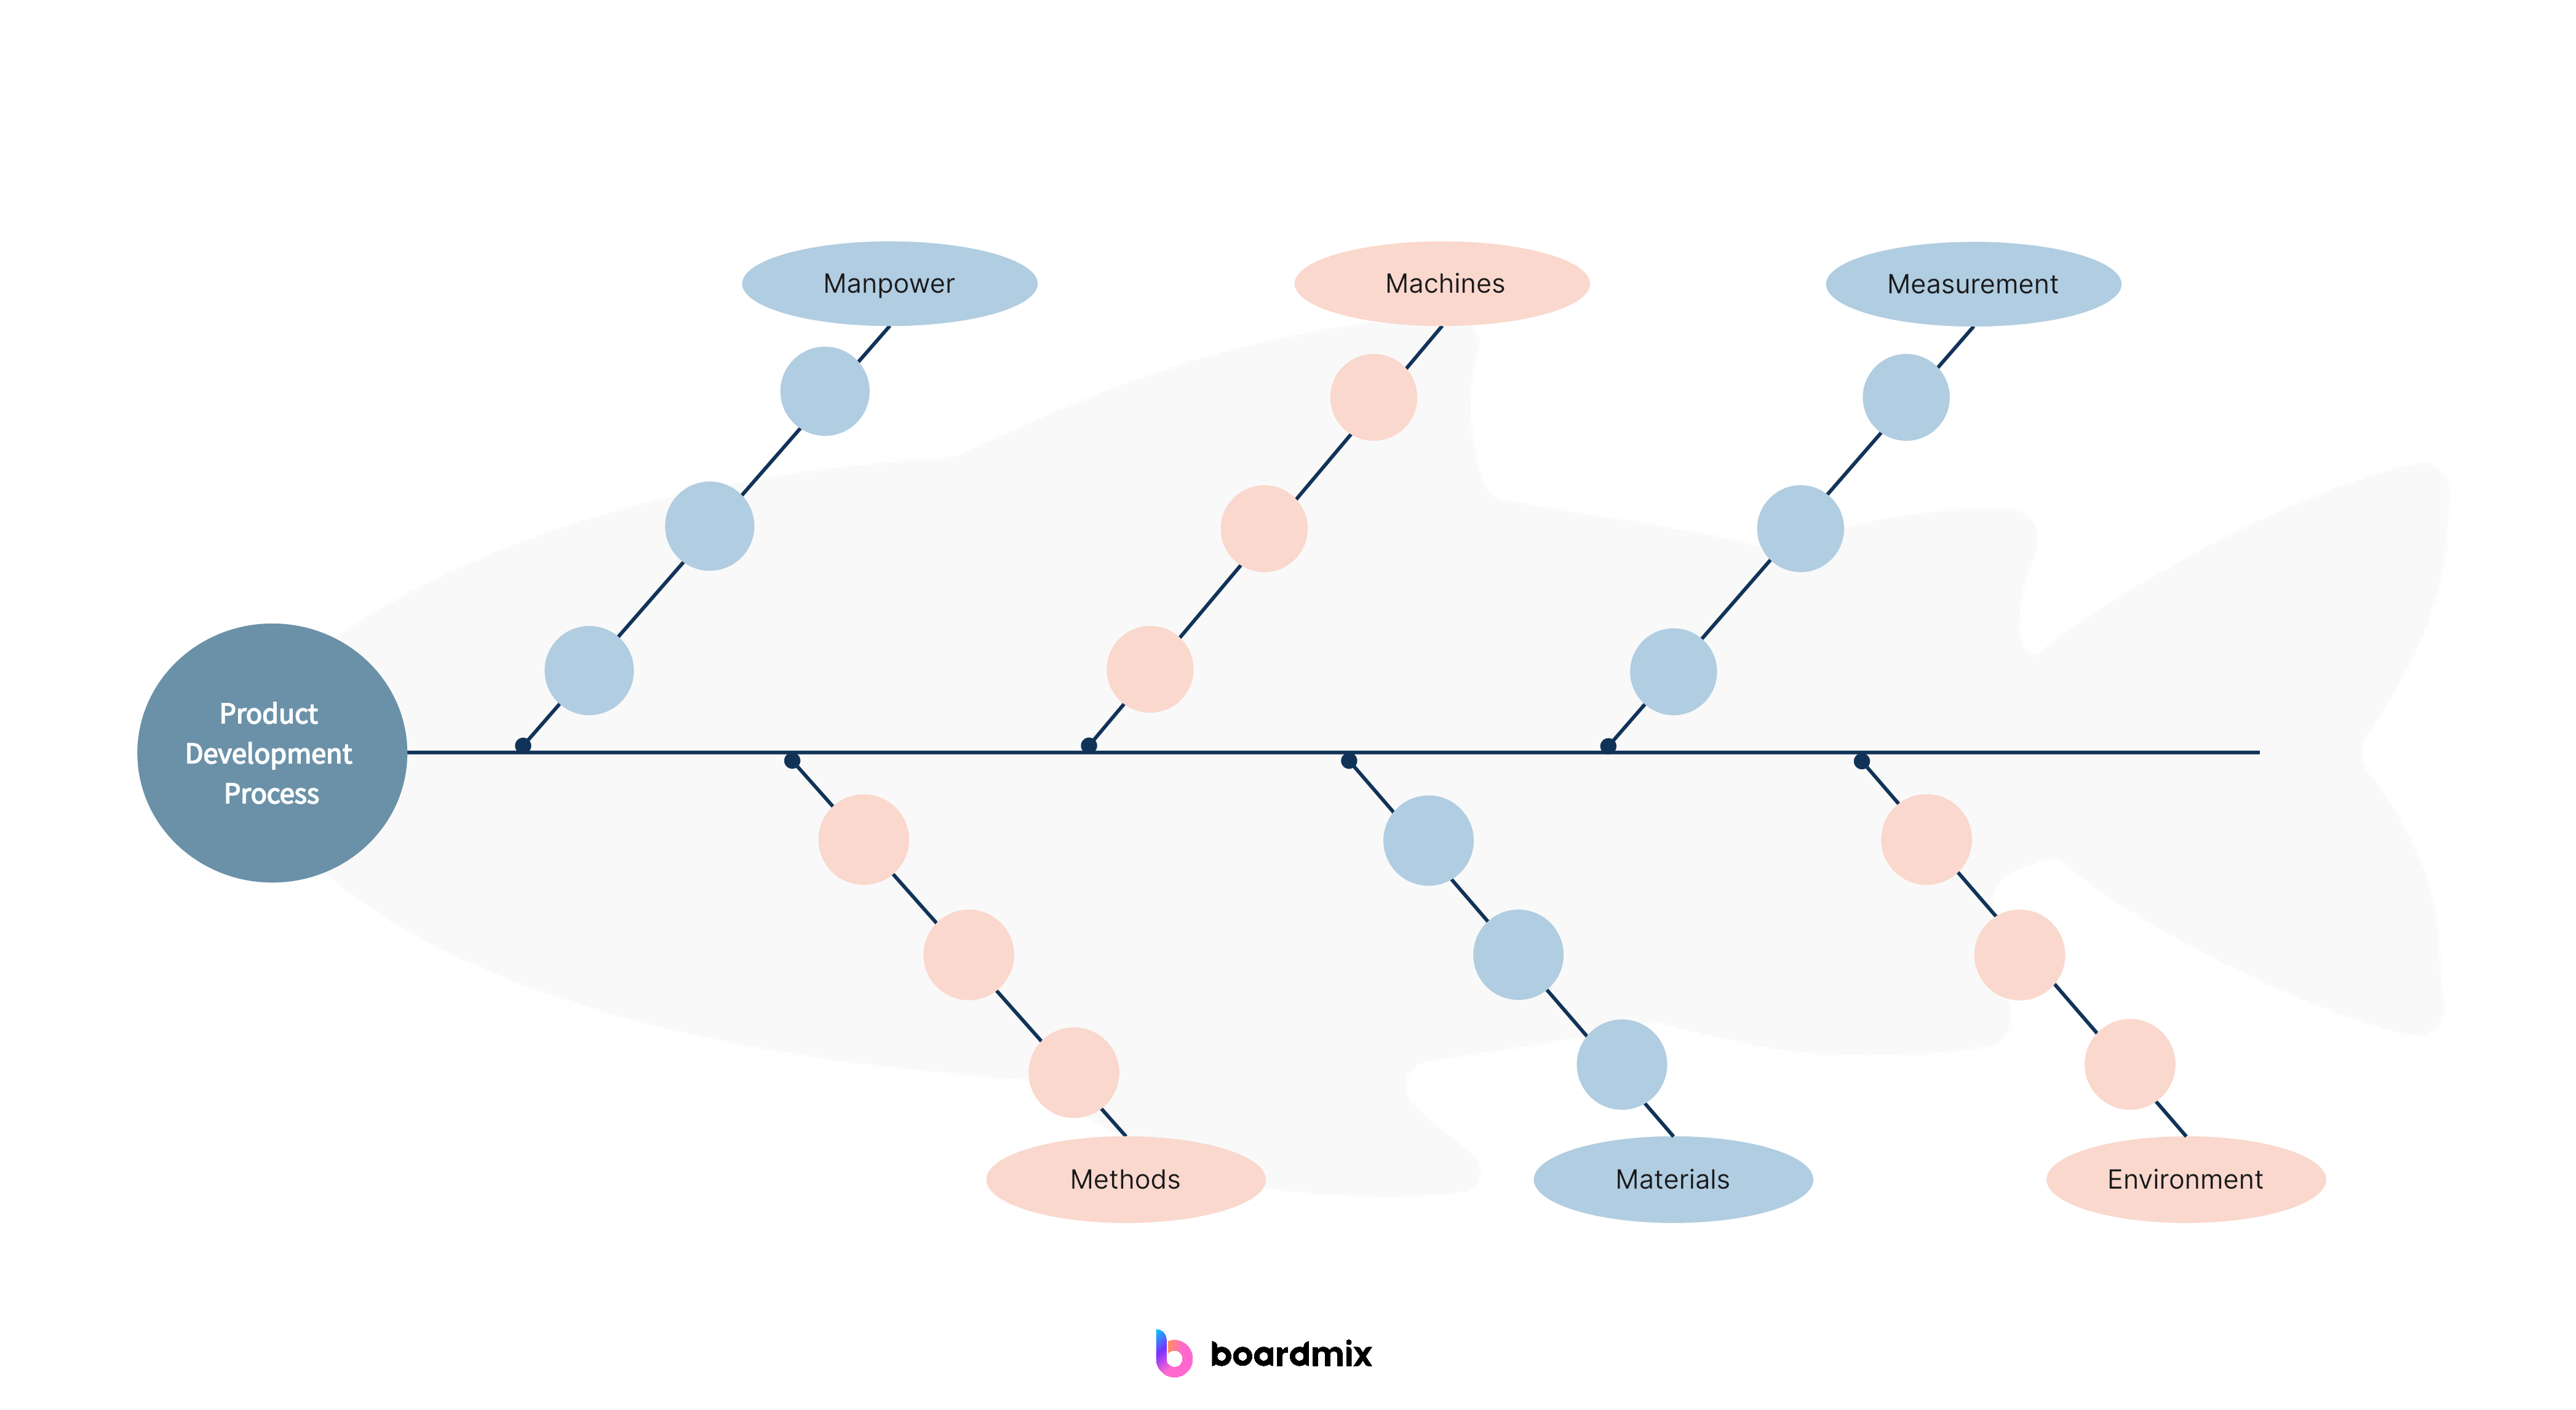
- 6M Diagram: Similar to the 4M diagram, the 6M diagram adds two additional categories: Measurement and Mother Nature (environment). This allows for a more comprehensive analysis of the potential causes.
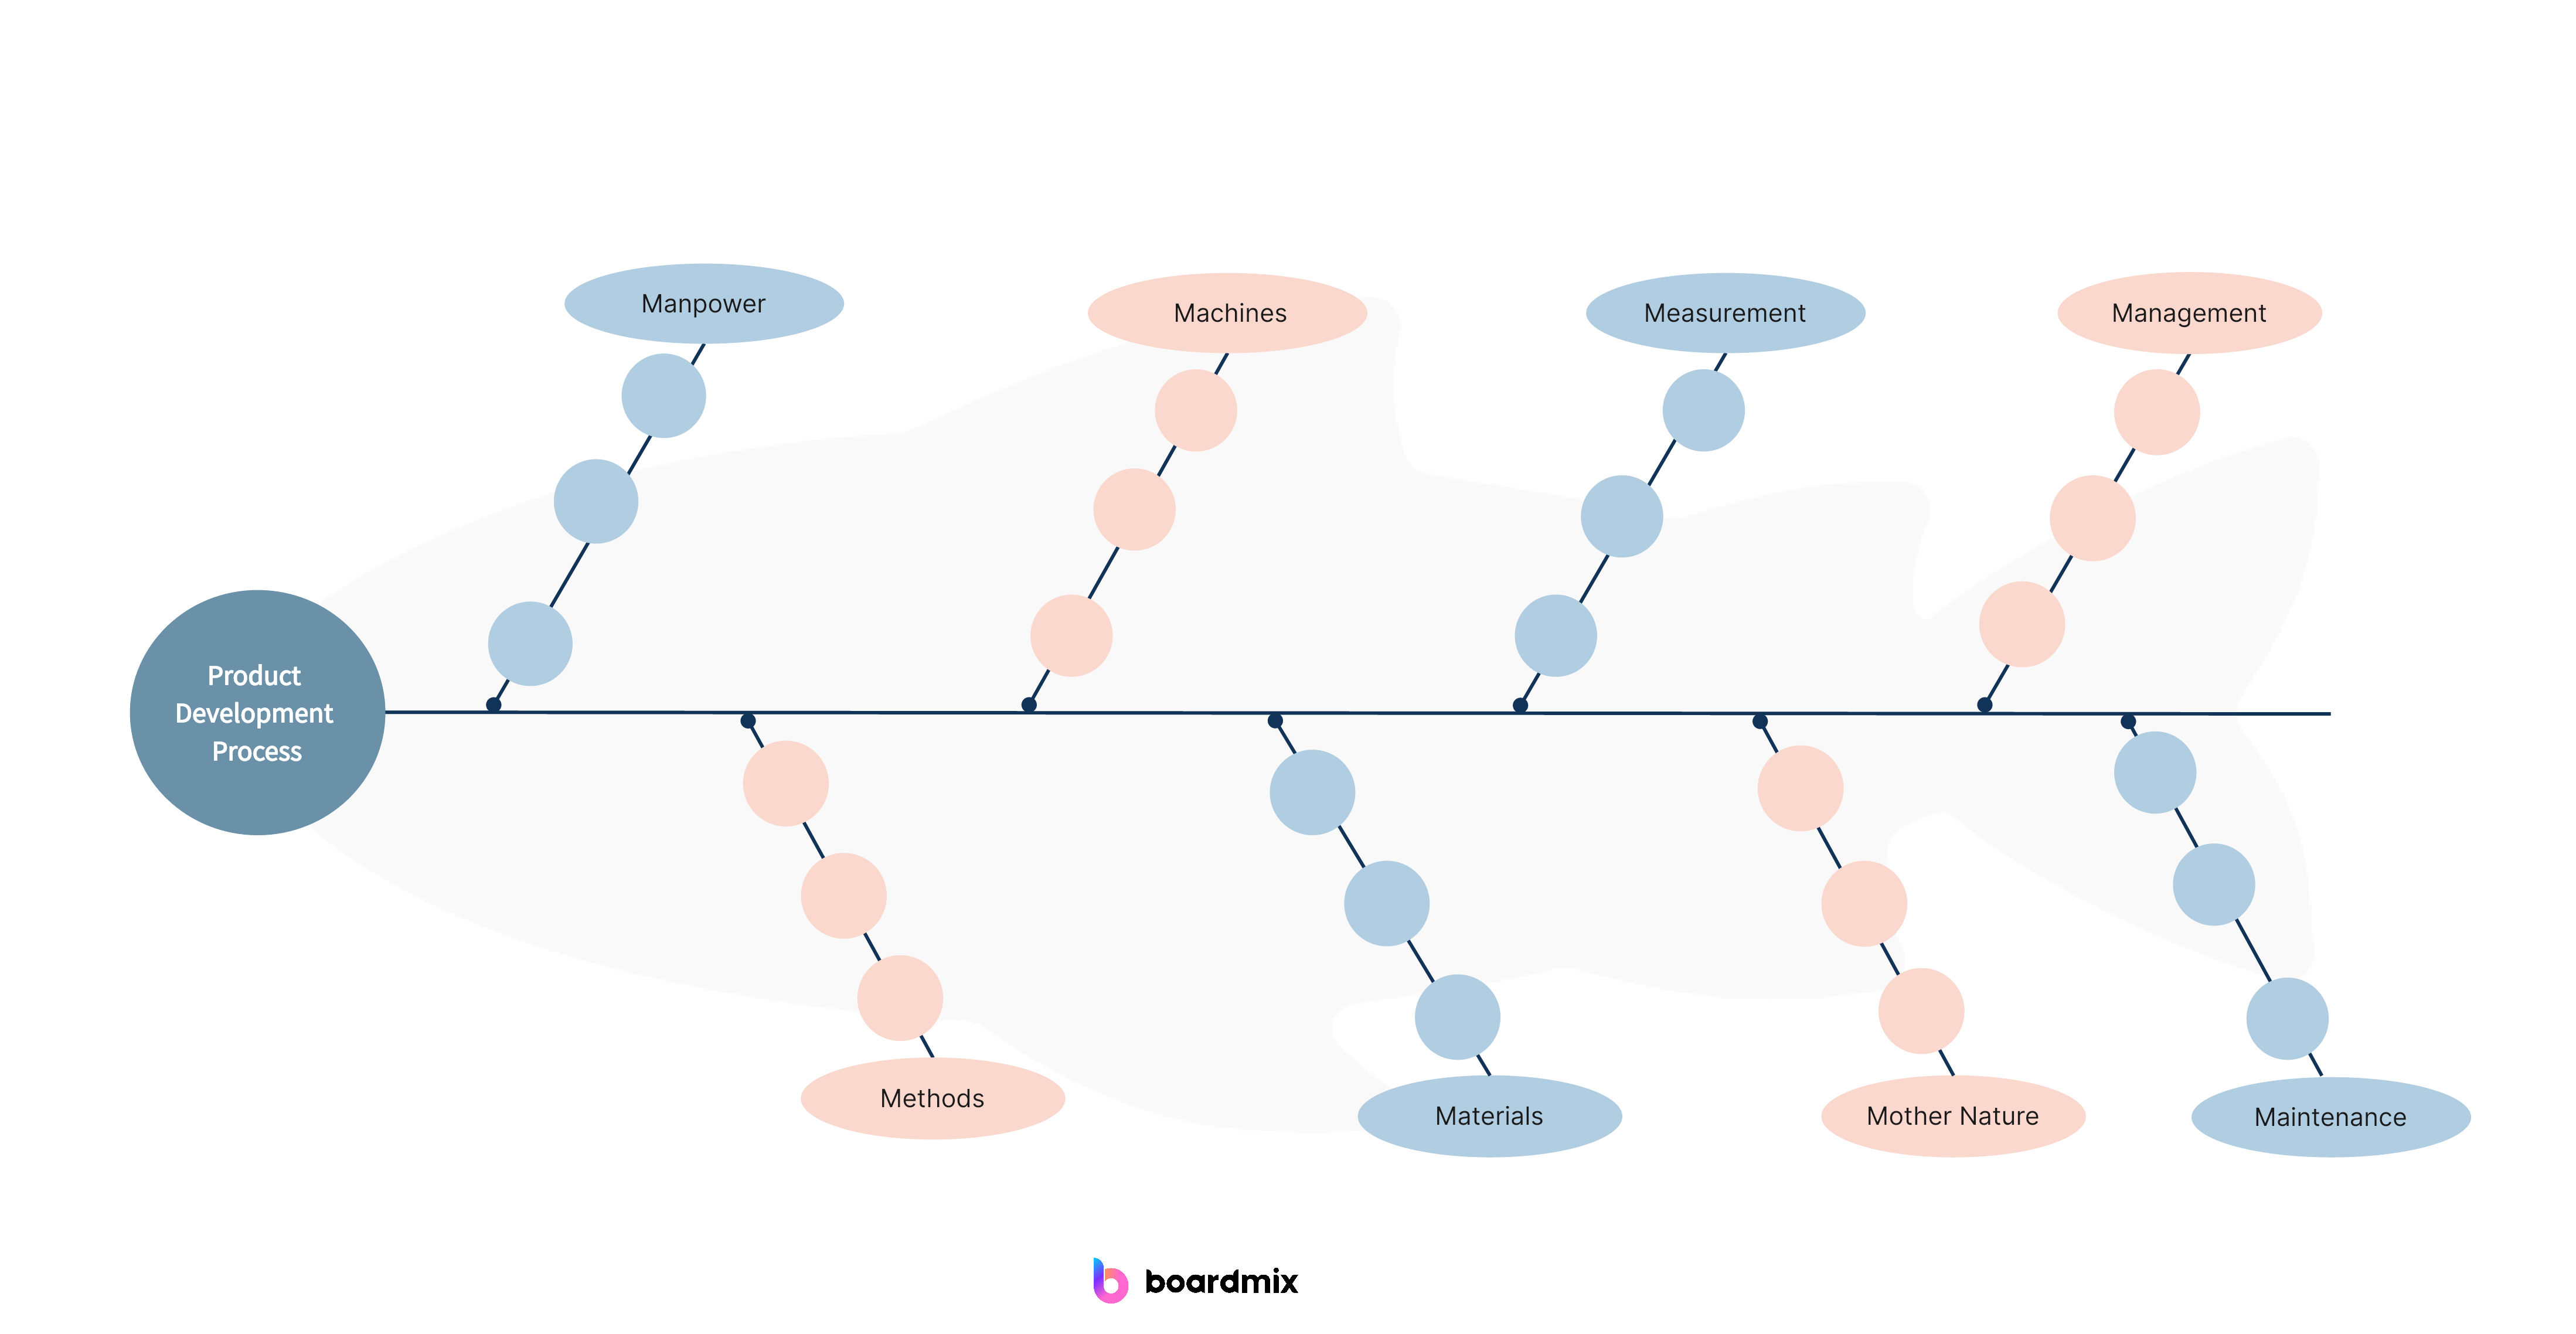
- 8M Diagram: The 8M diagram further expands on the 6M diagram by including two additional categories: Management and Maintenance. This type of fishbone diagram is often used in quality management or process improvement initiatives.
These are just a few examples of the types of Ishikawa fishbone diagrams that can be used. The specific categories and layout of the diagram can vary depending on the problem or context being analyzed.
What are the benefits of the Ishikawa fishbone diagram?
The Ishikawa fishbone diagram offers several benefits in problem-solving and root cause analysis:
- Visual representation: The diagram provides a visual representation of the potential causes of a problem or event, making it easier to understand and communicate the analysis.
- Systematic approach: By categorizing the potential causes into different categories, such as people, methods, machines, materials, measurements, and environment, the diagram allows for a systematic analysis of the problem. This helps ensure that all possible causes are considered and evaluated.
- Identification of root causes: The fishbone diagram helps identify the primary or root causes of a problem by breaking down the potential causes into more specific categories. This enables individuals or teams to focus their efforts on addressing the underlying issues rather than just the symptoms.
- Collaboration and teamwork: The diagram can be used as a collaborative tool, bringing together individuals or teams from different departments or disciplines to analyze and discuss the problem. This promotes a shared understanding and encourages teamwork in developing effective solutions.
- Data-driven analysis: The fishbone diagram encourages data-driven analysis by considering various factors or categories that may contribute to the problem. This helps ensure that decisions and solutions are based on evidence rather than assumptions or personal opinions.
- Continuous improvement: The use of the fishbone diagram supports a culture of continuous improvement by providing a structured approach to problem-solving and root-cause analysis. It helps organizations identify recurring issues and implement preventive measures to avoid similar problems in the future.
In short, the Ishikawa fishbone diagram is a valuable tool in problem-solving and quality management, allowing organizations to identify and address the root causes of problems effectively.
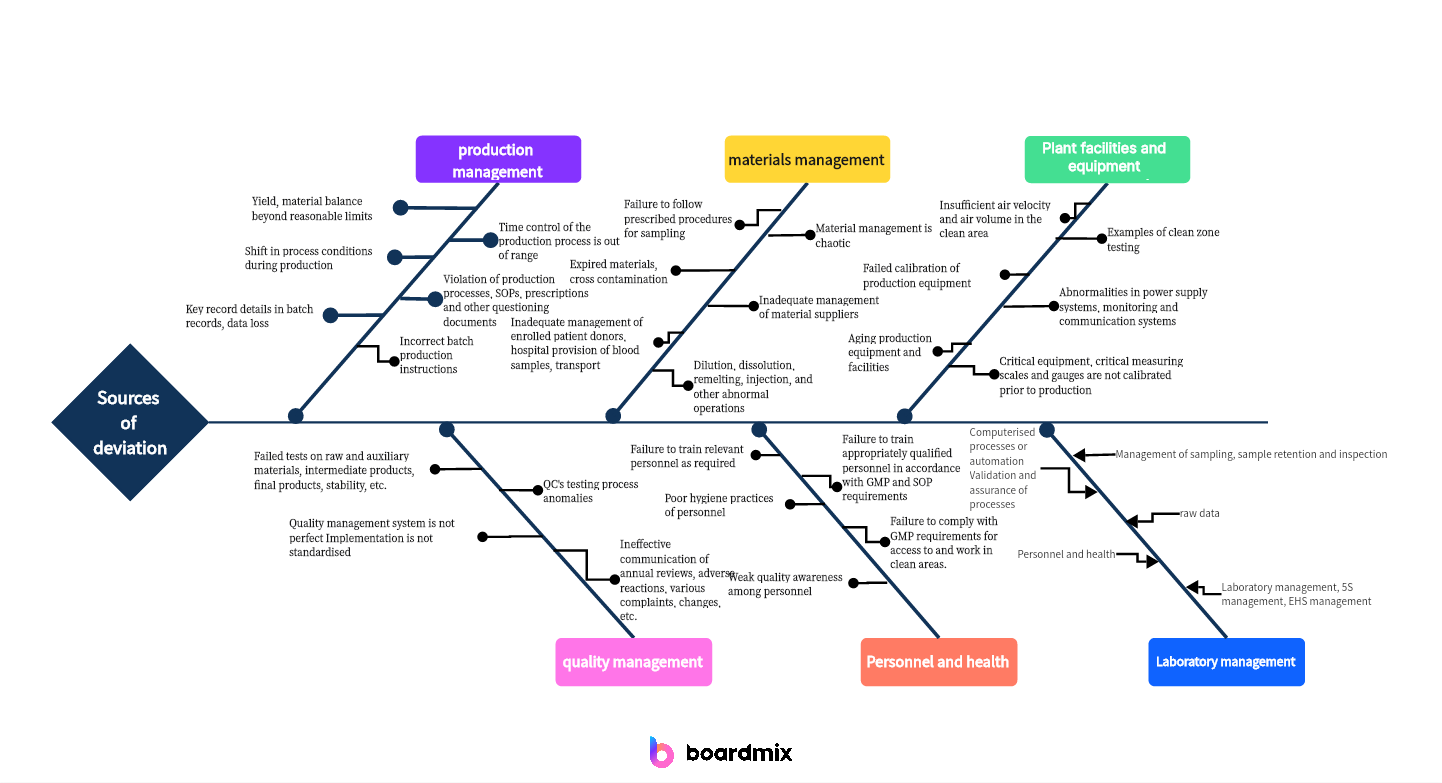
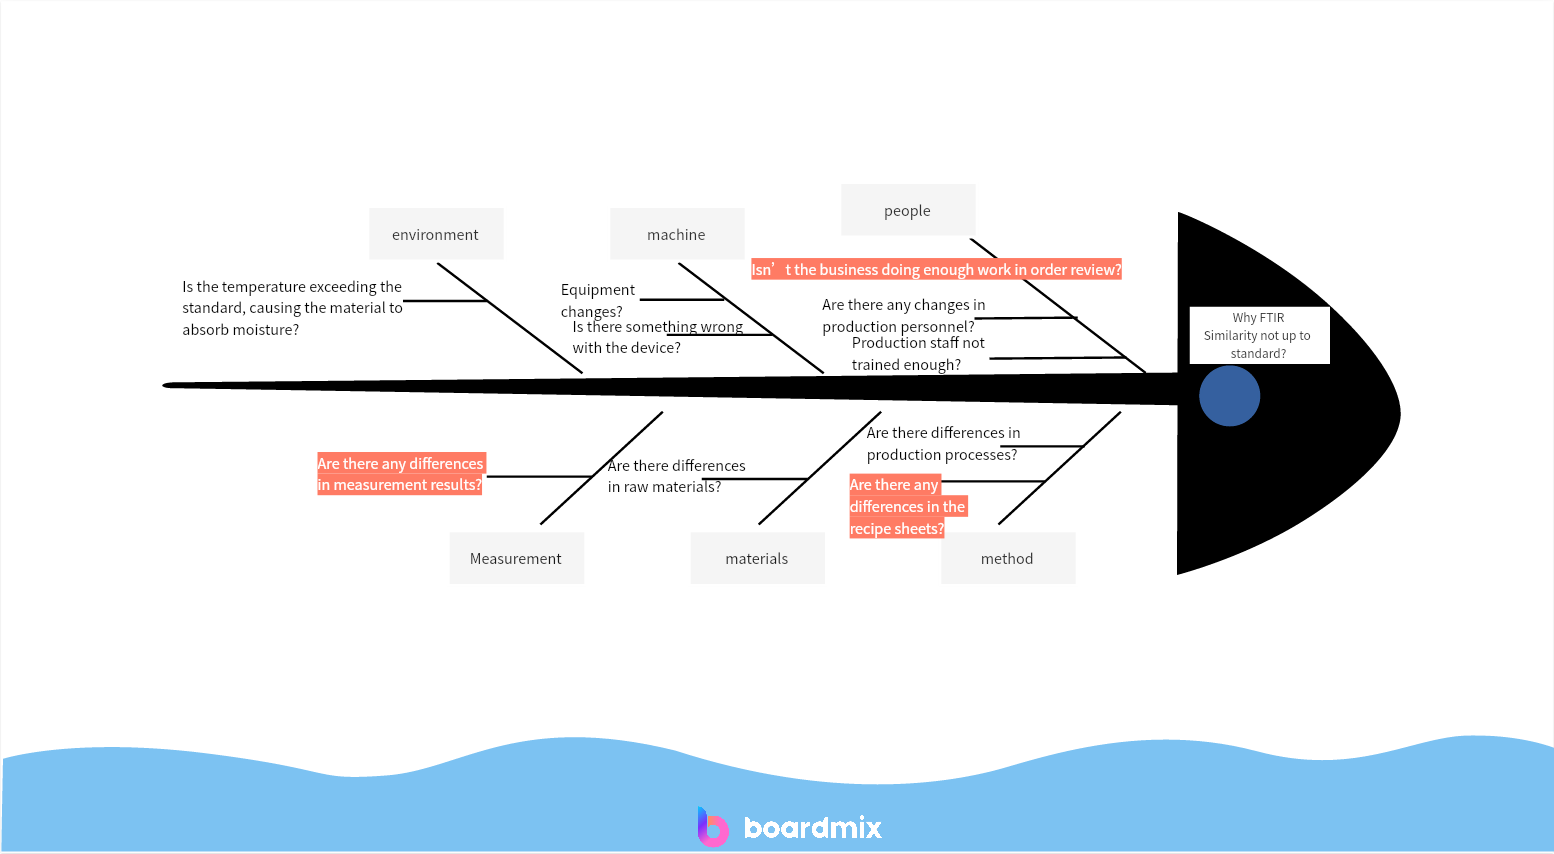
What are the 6 parts of the fishbone diagram?
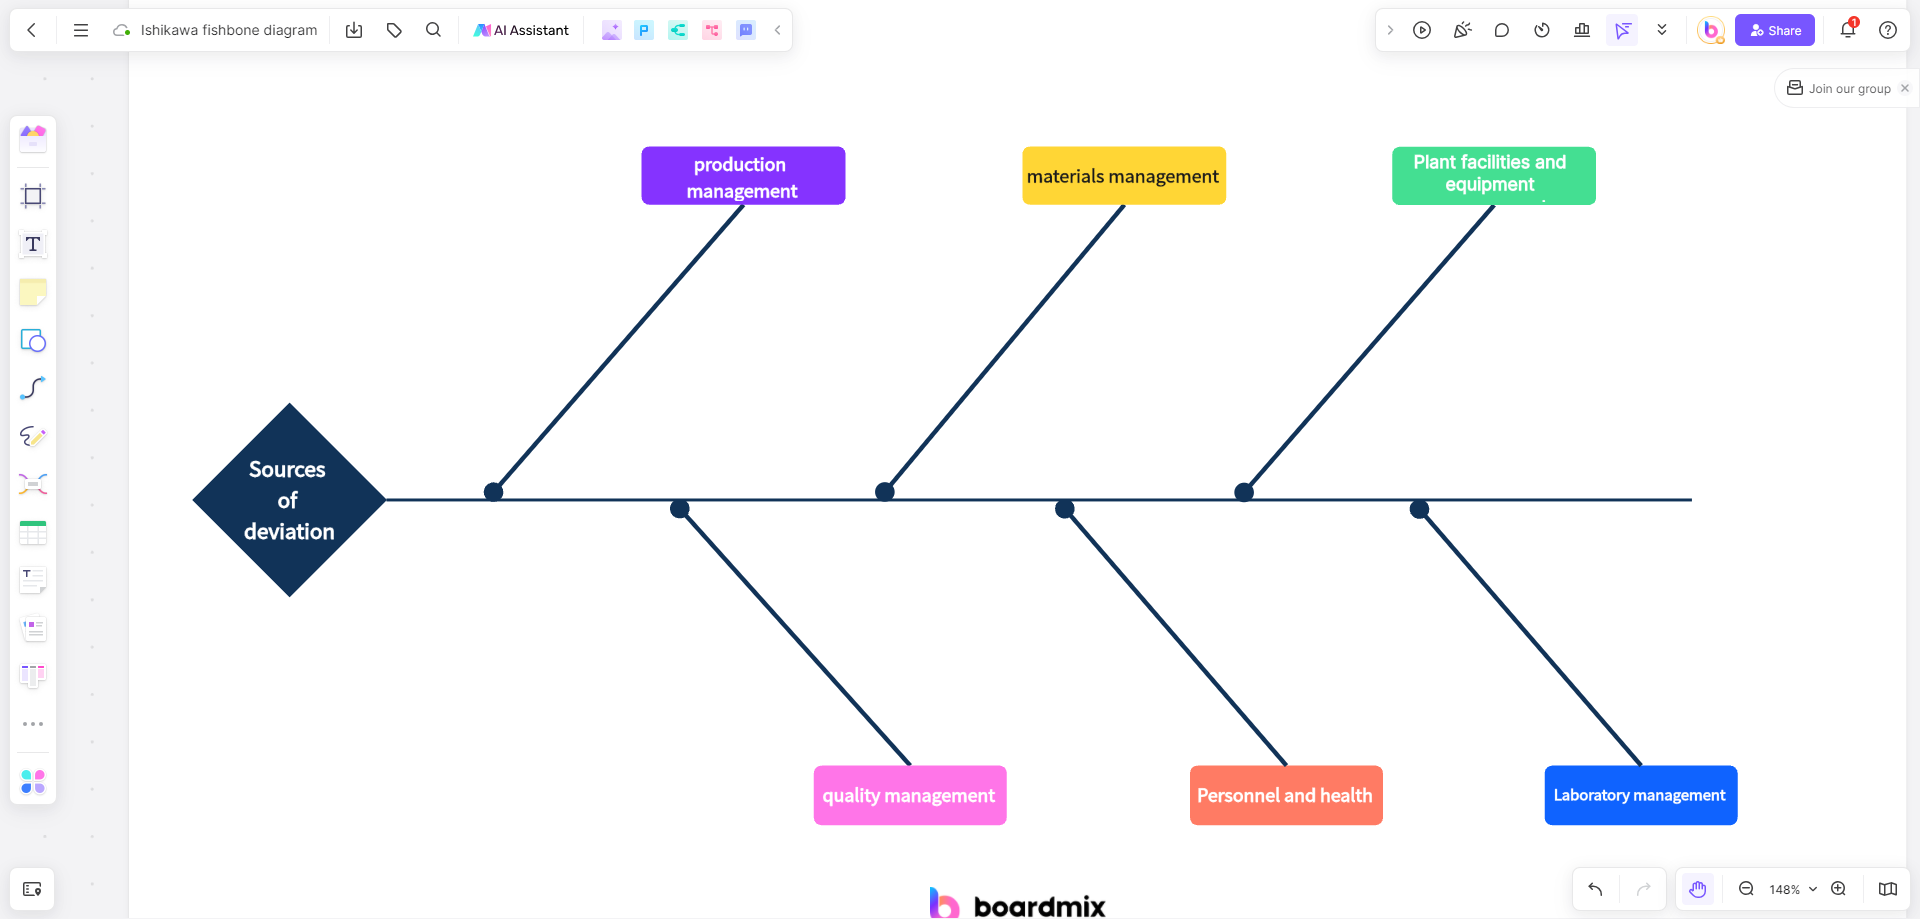
The fishbone diagram, also known as the Ishikawa diagram or cause and effect diagram, typically consists of six main parts:
- Problem or effect: This is the main issue or problem that you are trying to analyze or understand. It is typically written on the right-hand side of the diagram.
- Major categories: These are the main causes or categories that contribute to the problem. They are typically represented as branches extending from the main horizontal line (the backbone) of the diagram. Common categories include "Manpower," "Methods," "Machines," "Materials," "Measurement," and "Mother Nature" (environment).
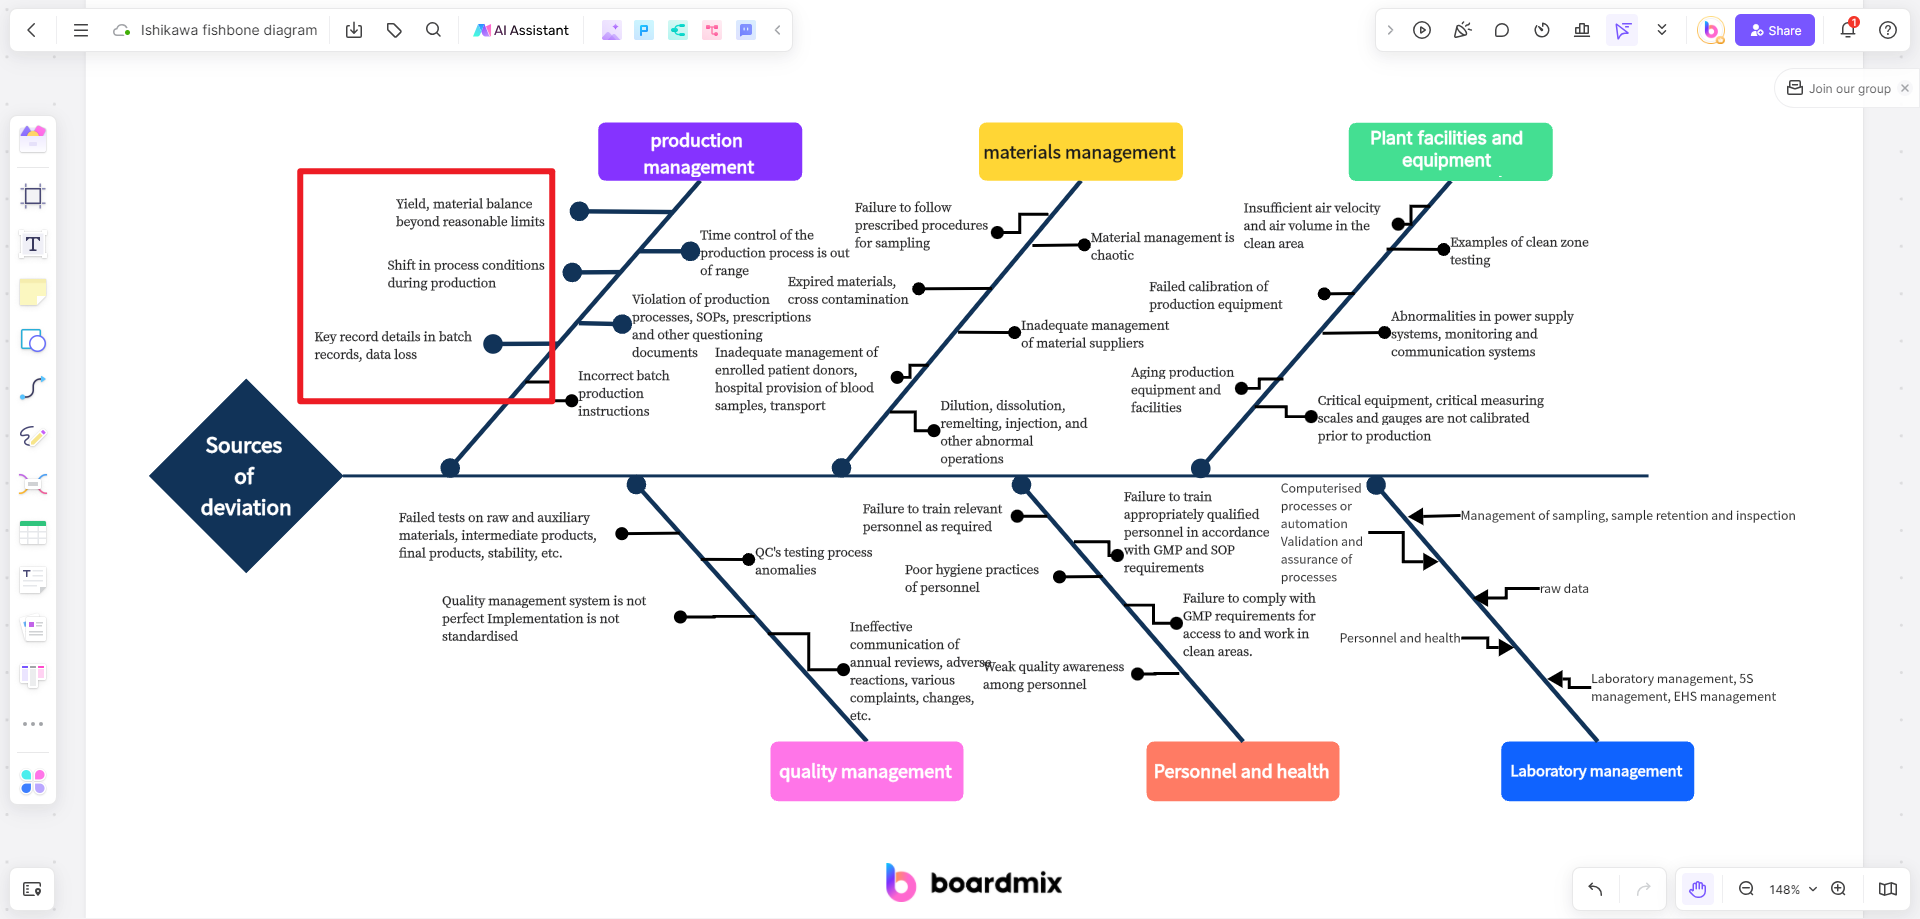
- Causes: These are the specific factors or causes within each major category that may contribute to the problem. They are typically represented as smaller branches extending from the corresponding major category branch.
- Sub-causes: In some cases, it may be necessary to further break down the causes into sub-causes or sub-factors. These can be represented as even smaller branches extending from the causes.
- Analysis: This is where you document your analysis and findings for each cause or sub-cause. It can include relevant data, observations, or any other information that helps explain or support the cause.
- Recommendations: This is where you propose potential solutions or actions to address each cause or sub-cause. It can include specific steps, strategies, or changes that can help eliminate or mitigate the causes.
By visually mapping out these six parts in a fishbone diagram, you can better understand the relationships between different causes and identify potential solutions to the problem at hand.
Ishikawa Fishbone Example: Catheter Shedding Analysis
To conduct a catheter shedding analysis applying the Ishikawa fishbone diagram, you can follow these steps:
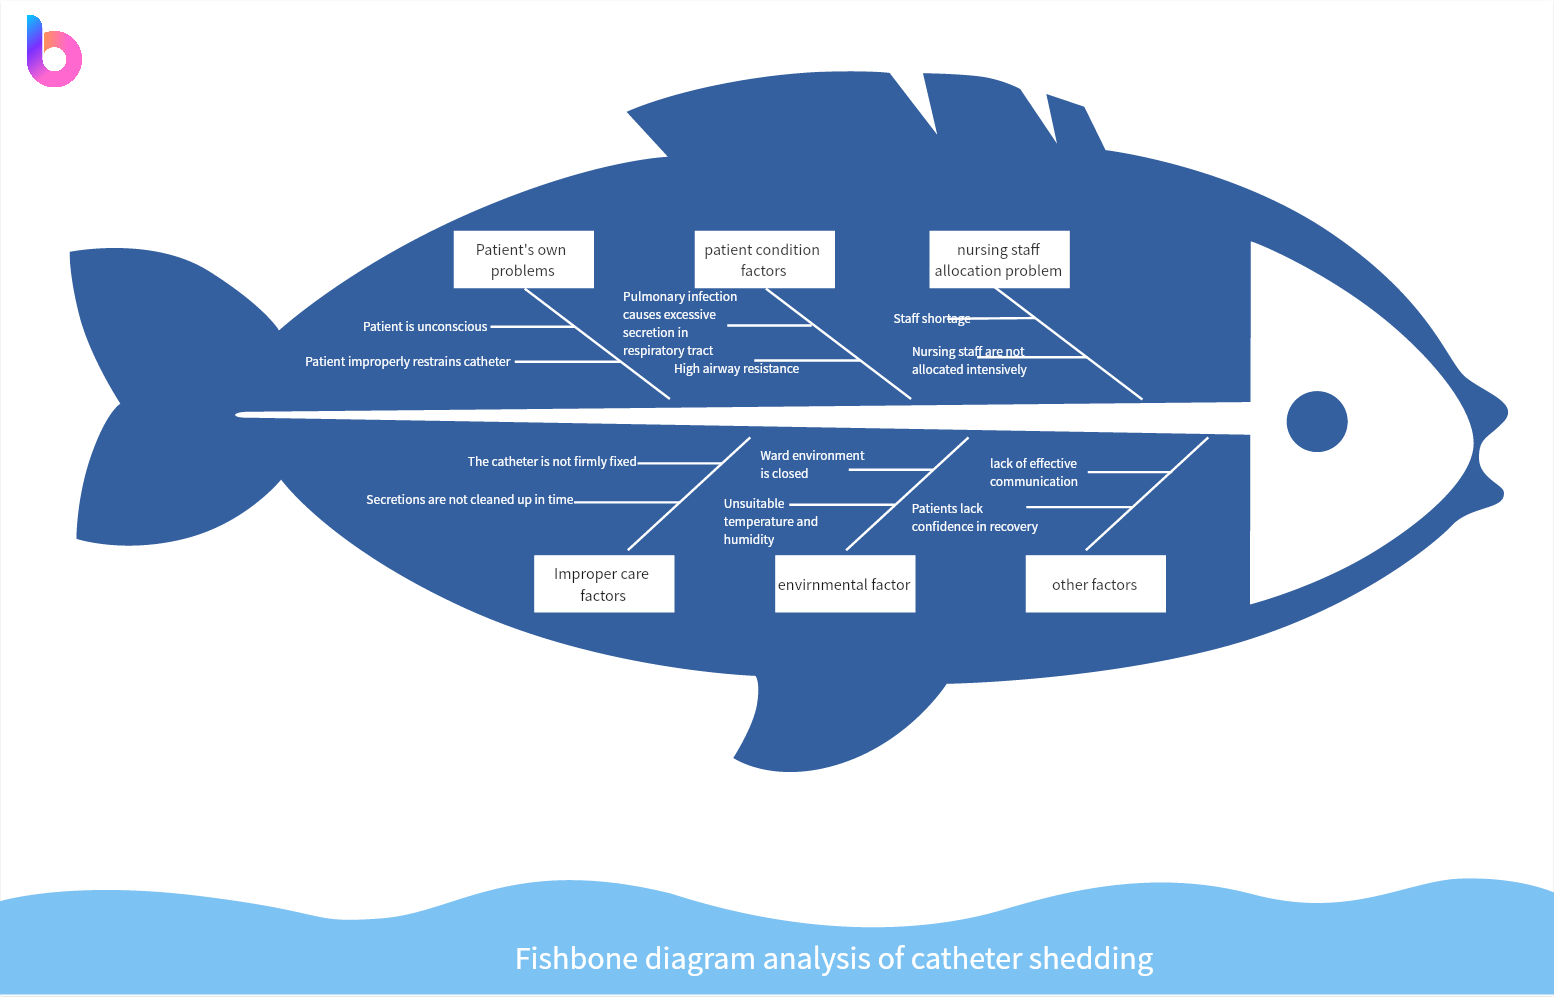
- Define the problem: Identify the issue of catheter shedding that you want to analyze using the fishbone diagram.
- Identify major categories: Determine the main categories or causes that could contribute to catheter shedding. These categories could include factors like Material, Process, Manpower, Equipment, Environment, and Measurement. Brainstorm and list all possible causes under each category.
- Draw the backbone: Draw a horizontal line in the middle of the diagram as the backbone. Write "Catheter Shedding" on this line.
- Add major category branches: Extend lines from the backbone to represent each major category. Label each branch with the corresponding category name.
- Identify causes: For each major category, brainstorm and list all possible causes that could contribute to catheter shedding. Add these causes as smaller branches extending from the corresponding major category branch.
- Analyze causes: Evaluate each cause and consider its potential impact on catheter shedding. Use tools like data analysis, process observation, or expert knowledge to assess the causes. Document your findings and observations under each cause branch.
- Identify sub-causes: If necessary, further break down the causes into sub-causes or sub-factors. Add these sub-causes as smaller branches extending from the corresponding cause branch.
- Analyze sub-causes: Evaluate each sub-cause and consider its potential impact on catheter shedding. Document your findings and observations under each sub-cause branch.
- Identify root causes: Based on your analysis of causes and sub-causes, identify the primary or root causes of catheter shedding. These are the underlying factors that directly contribute to the problem. Focus your attention on addressing these root causes rather than just treating the symptoms.
- Propose solutions: For each root cause, brainstorm and propose potential solutions or actions that can address the cause of catheter shedding. Document your recommendations under each root cause branch.
- Implement solutions: Select and implement the most feasible and effective solutions based on your analysis and recommendations. Monitor the results and evaluate their impact on solving the problem of catheter shedding.
By following these steps and using the Ishikawa fishbone diagram, you can systematically analyze and address the issue of catheter shedding, leading to improvements in quality and performance. Remember to adapt these steps to your specific situation and adjust the categories and causes accordingly.
Boardmix: Your Fishbone Diagram Online Maker
Boardmix is an online tool that allows you to create fishbone diagrams easily. With Boardmix, you can quickly and efficiently analyze the causes of a problem and identify potential solutions. Here's how you can use Boardmix:
- Visit the Boardmix website and sign up for an account.

- Once you're logged in, click on the "Create Diagram" button.
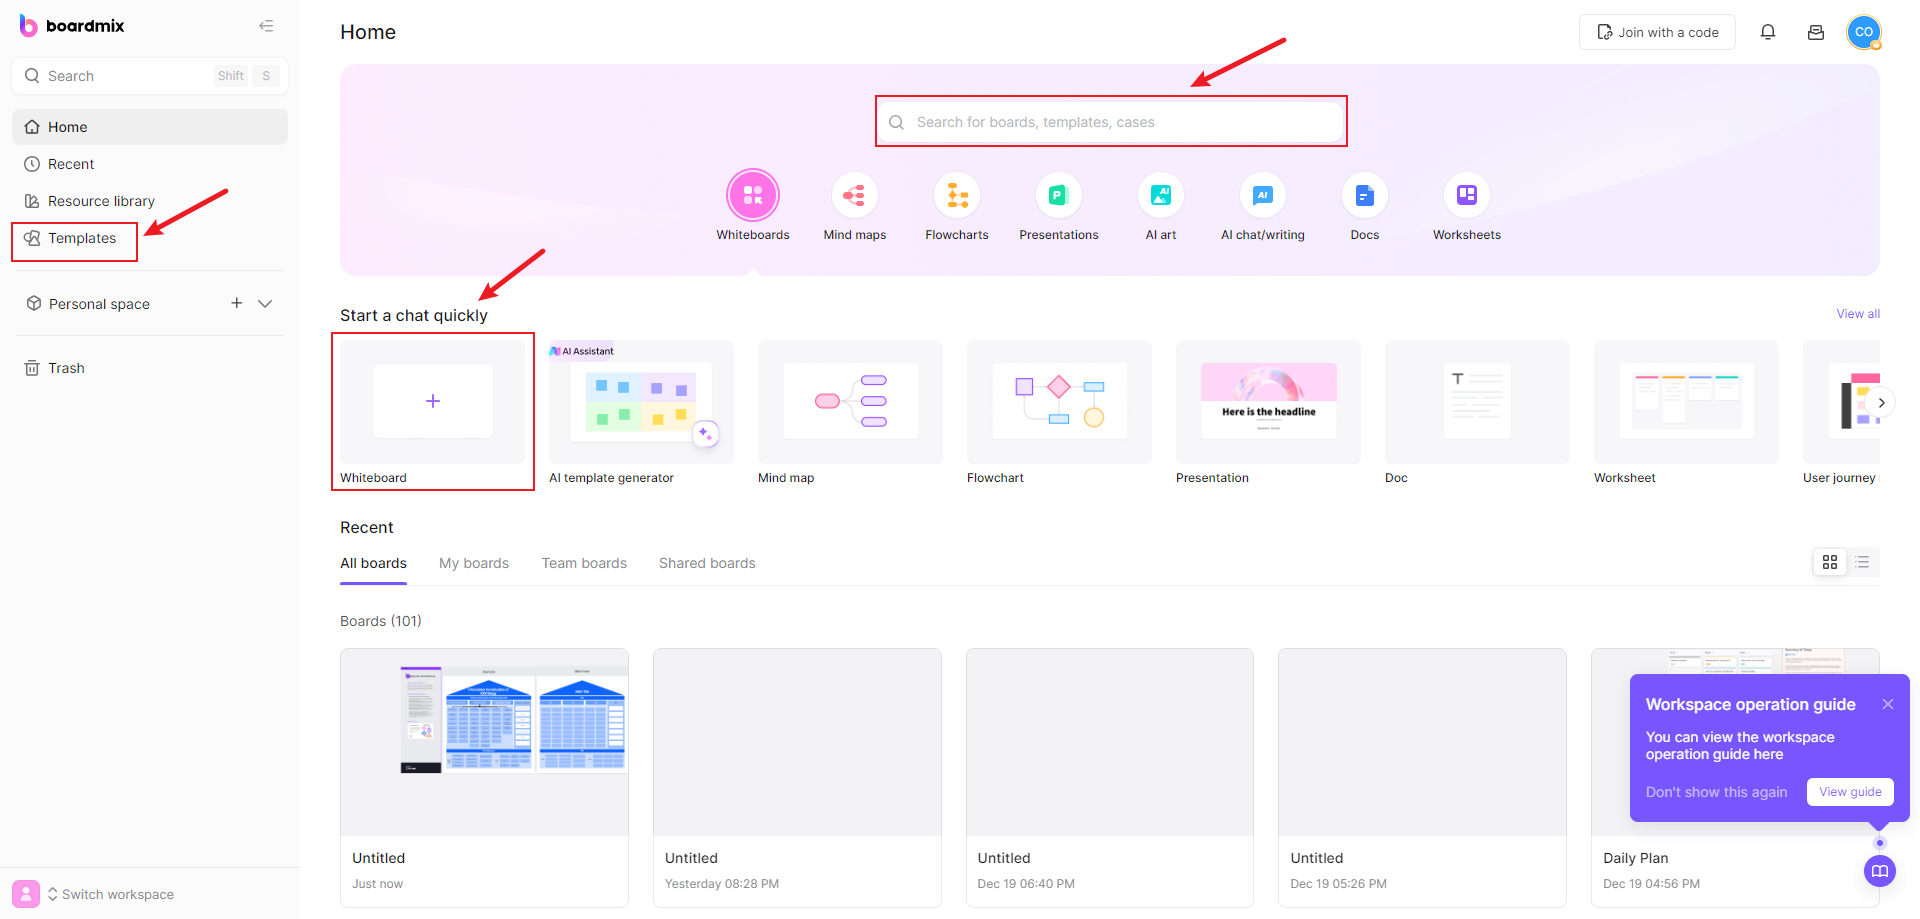
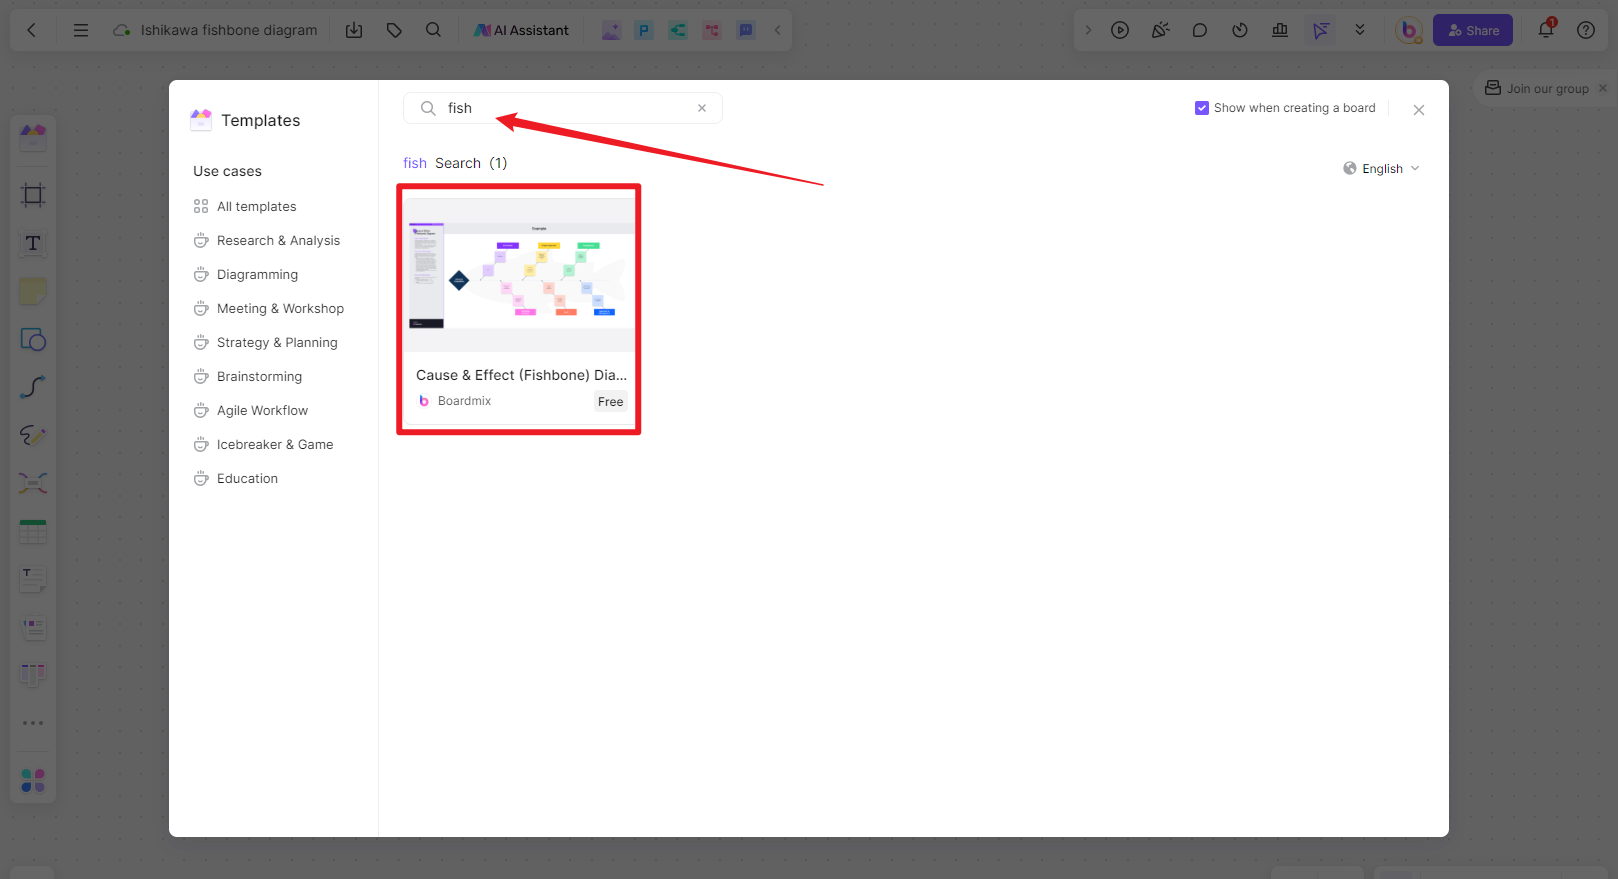
- Select the fishbone diagram template from the available options.
- Start by defining the problem or issue you want to analyze. Type it in the main title section of the diagram.
- Identify major categories that could contribute to the problem. These categories could include factors like Material, Process, Manpower, Equipment, Environment, and Measurement. Add these categories as branches extending from the main title.
- Add causes to each major category branch. Brainstorm and list all possible causes that could contribute to the problem. Add these causes as smaller branches extending from the corresponding major category branch.
- Analyze each cause and consider its impact on the problem. You can add additional information or details under each cause branch to further explain or support your analysis.
- If necessary, you can break down causes into sub-causes or sub-factors. Add these sub-causes as smaller branches extending from the corresponding cause branch.
- Analyze each sub-cause and consider its impact on the problem. Document your findings or observations under each sub-cause branch.
- Once you've identified the root causes of the problem, focus on proposing solutions or actions that can address these root causes. Add these solutions as branches extending from the corresponding root cause branch.
- Evaluate and select the most feasible and effective solutions based on your analysis. You can add additional notes or details under each solution branch to further explain or support your recommendations.
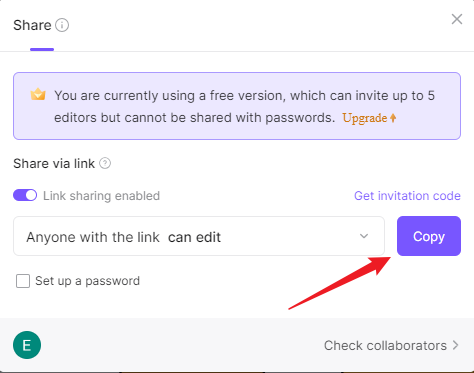
- Share and collaborate on your fishbone diagram with others if needed. Boardmix allows you to invite team members or stakeholders to view and edit the diagram together.
By using Boardmix, you can streamline the process of creating a fishbone diagram and collaborate effectively with your team or colleagues. Start using Boardmix today to improve problem-solving and decision-making in your organization!
Features of Boardmix Fishbone Diagram Online Maker
Boardmix offers several key features that make it a powerful tool for creating fishbone diagrams.
- Easy-to-use interface: Boardmix provides a user-friendly interface that allows users to create fishbone diagrams quickly and effortlessly. The intuitive design makes it easy for both beginners and experienced users to navigate and utilize the tool effectively.
- Customizable templates: Boardmix offers a wide range of customizable templates for fishbone diagrams. Users can choose from different styles and layouts to create diagrams that best suit their needs. This flexibility allows for personalized and visually appealing diagrams.
- Collaboration and sharing: With Boardmix, users can collaborate with team members or stakeholders in real-time. The tool allows for easy sharing and editing of diagrams, making it convenient for teams to work together remotely or in the same location.
- Detailed analysis: Boardmix provides the capability to conduct an in-depth analysis of problem causes. Users can add detailed information and supporting data to each branch of the diagram, helping to identify the root causes of a problem and develop effective solutions.
- Export and presentation options: Boardmix allows users to export their fishbone diagrams in various formats, including PDF, image files, or shareable links. This feature enables users to present their findings or share their diagrams with others outside of the Boardmix platform.
- Integration with other tools: Boardmix integrates seamlessly with other productivity tools, such as project management software or document collaboration platforms. This integration streamlines workflows and allows for easy access to fishbone diagrams within existing work processes.
By leveraging these features, users can leverage Boardmix to enhance problem-solving and decision-making processes within their organization. Whether it's analyzing manufacturing issues, identifying customer pain points, or improving business processes, Boardmix is a versatile tool that can support various industries and sectors.
To Recap
In conclusion, the Ishikawa Fishbone diagram stands as a powerful tool in the arsenal of problem-solving methodologies, offering a structured approach to identify and address root causes. Boardmix emerges as an ideal platform for crafting Ishikawa Fishbone diagrams online, providing a collaborative space where teams can seamlessly create, modify, and discuss these visual representations. As we delve into the practical example of a Catheter Shedding Analysis, it becomes evident how Ishikawa Fishbone diagrams on Boardmix can be applied to real-world scenarios, fostering a deeper understanding of complex problems and facilitating targeted solutions.
Boardmix invites individuals and teams to leverage its collaborative features and user-friendly interface to create Ishikawa Fishbone diagrams effortlessly. Take action today, harness the problem-solving potential of Ishikawa diagrams, and elevate your approach to root cause analysis.


