


What is cause and effect graphic organizer?
A Cause and Effect Graphic Organizer is a visual tool that helps students, writers, or researchers to identify and understand the underlying causes and their resulting effects of a situation, event, or concept. It works by allowing the user to write down or map out the various causes of an event and the subsequent effects of each of these causes.
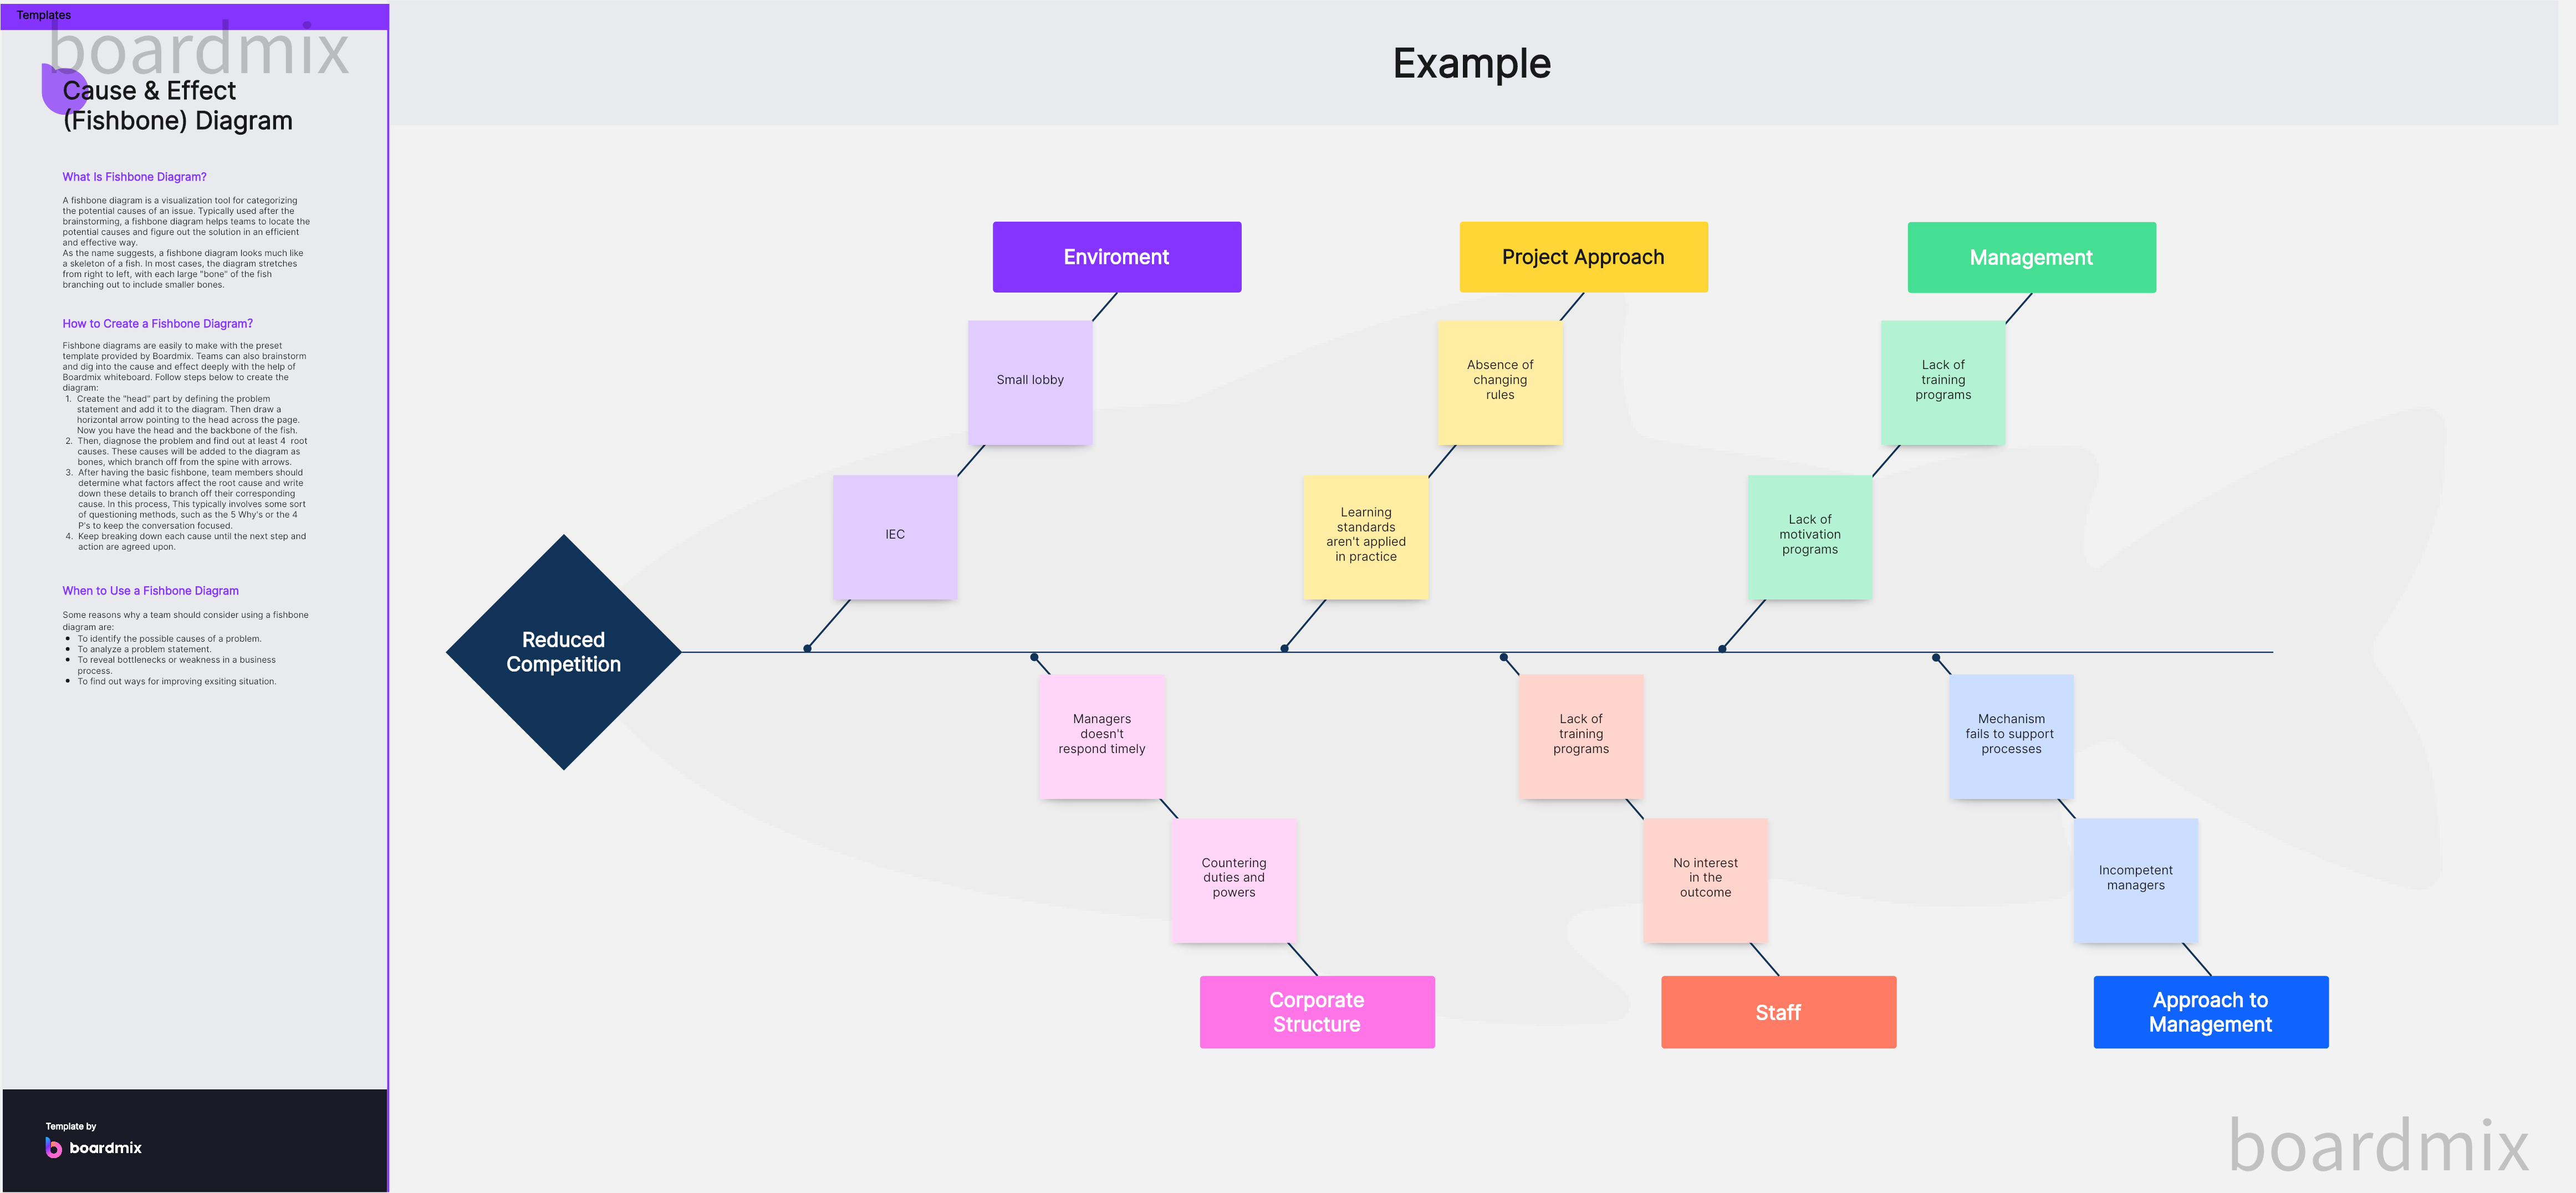
Here's a basic example of how it could look:
Event: The central event or situation that is being analyzed.
Cause: The reasons or actions that led to the event.
Effect: The outcome or result of each cause.
By utilizing a Cause and Effect Graphic Organizer, users can break down complex situations into simpler elements, facilitating a better understanding of the relationships between different variables. This tool is commonly used in fields such as education, business strategy, project management, and more.
When to use cause and effect graphic organizer?
A Cause and Effect Graphic Organizer is versatile and can be used in various situations where understanding the cause and effect relationships is crucial. Here are some instances when it could be beneficial:
Academic Study: This tool is used extensively in classrooms to facilitate understanding of various concepts across different subjects, such as identifying the causes and effects of a historical event, analyzing a scientific process, or studying the plot of a novel.
Writing Assignments: It's an effective prewriting tool to plan and organize thoughts for essays or reports that need a cause and effect analysis. It helps ensure that all key points are addressed systematically.
Project Management: In professional settings, it can be used to anticipate the potential impact of project decisions, identifying what may be causing delays or issues, or plan risk management strategies.
Business Strategy: Companies often use it to analyze their strengths and weaknesses, understand the impact of market trends, or plan marketing strategies.
Problem-Solving: It's useful in breaking down complex problems into manageable parts, identifying underlying causes, and understanding their effects to arrive at an effective solution.
By aiding in the clear visualization of relationships between causes and their effects, this graphic organizer serves as a powerful tool in various learning, planning, and decision-making contexts.
Benefits of Using Cause and Effect Graphic Organizers
1. Encourages Analytical Thinking
Cause and effect graphic organizers promote analytical thinking by challenging users to identify the causes and effects of a given event or situation. It teaches individuals to think beyond the surface and understand the underlying reasons and results.
2. Simplifies Complex Information
These organizers can take complex scenarios and simplify them into manageable parts. By breaking down information into individual causes and effects, they can make complex processes or events easier to understand.
3. Improves Organization and Planning
In planning stages, such as writing an essay or mapping out a project timeline, a cause and effect graphic organizer helps structure thoughts and ideas. It assists in visualizing the flow of events, aiding in better planning and organization.
4. Facilitates Problem Solving
When dealing with problems, identifying the cause is the first step toward finding a solution. A cause and effect graphic organizer can be instrumental in pinpointing the root causes of an issue, thus facilitating effective problem-solving.
5. Enhances Memory Retention
The process of physically mapping out causes and effects aids in memory retention. It encourages active engagement with the material, which has been shown to enhance recall.
6. Assists In Decision Making
By analyzing the potential effects of different courses of action, it can assist in making informed decisions in various settings, be it academic, business, or personal.
In conclusion, a cause and effect graphic organizer is a versatile tool that can provide significant benefits by promoting critical thinking, simplifying complex ideas, improving organization, aiding in problem-solving and decision-making, and enhancing memory retention.
Creating Cause and Effect Graphic Organizer on Boardmix
Boardmix is an intuitive digital tool that can be used to create effective cause and effect graphic organizers. Below is a step-by-step guide on how to do this.
1. Log In to Boardmix
The first step is to go to the Boardmix website and log in to your account. If you don’t have an account yet, you can easily sign up for free.

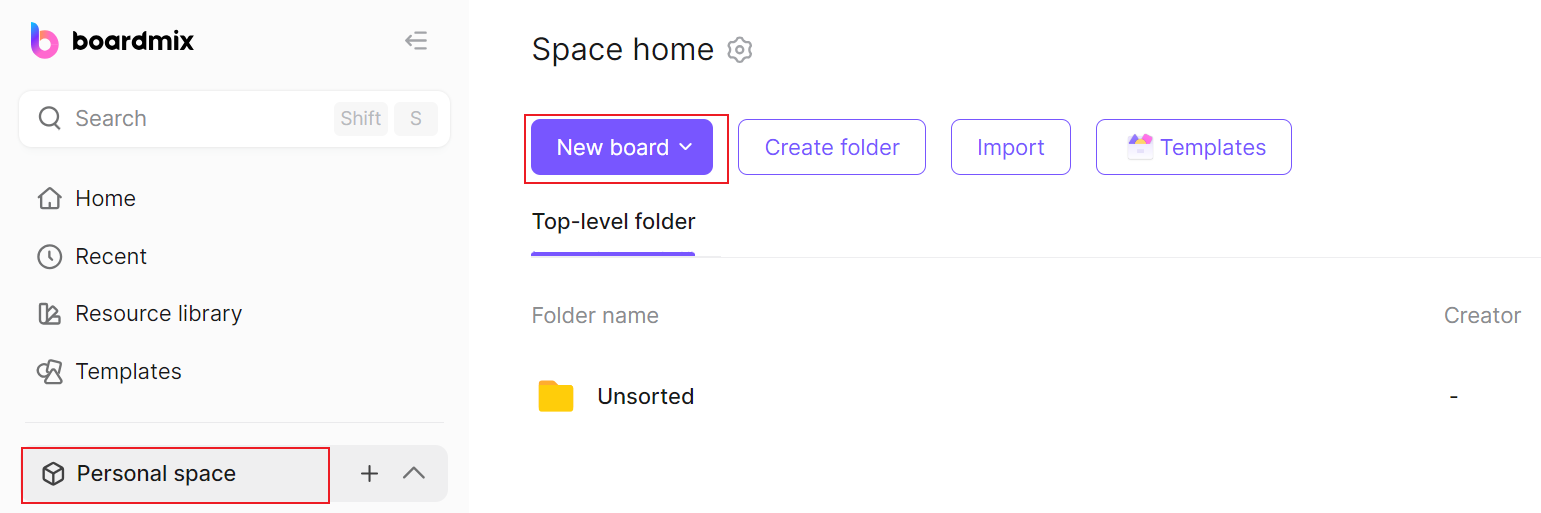
2. Start a New Project
Once you're logged in, you'll find a dashboard from where you can begin a new project. Click on the "New Board", and a blank workspace will open for you to create your graphic organizer.
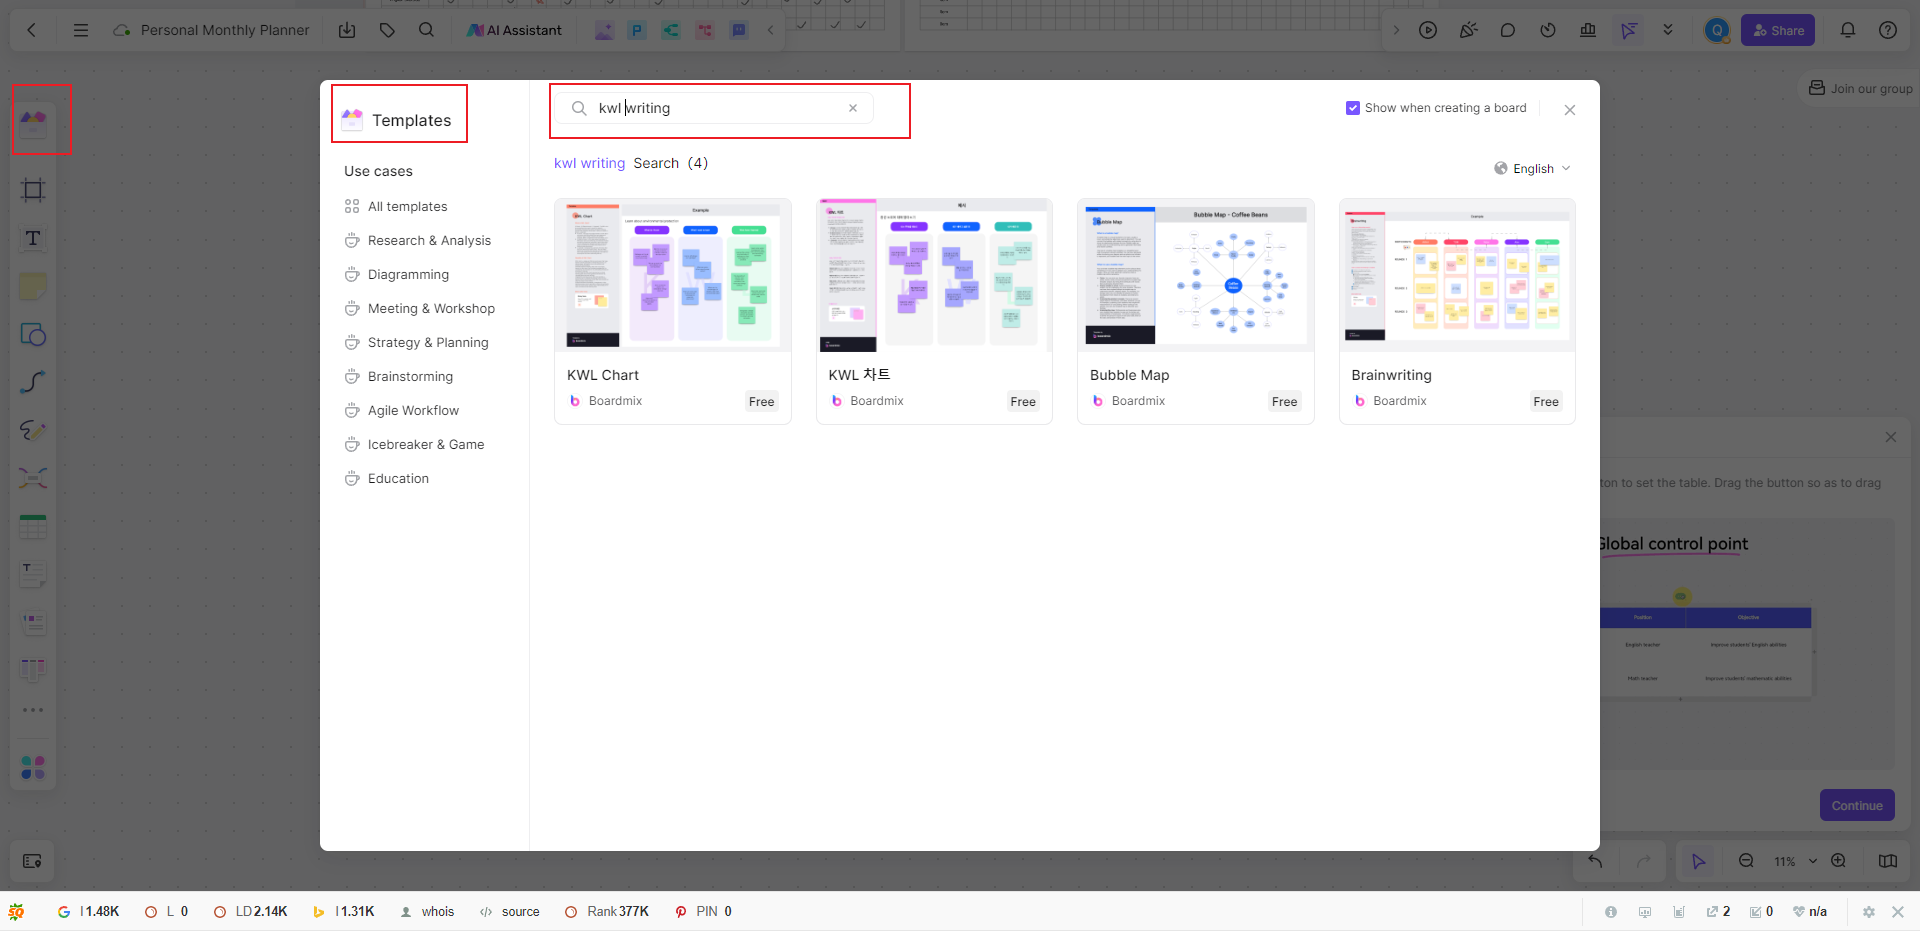
3. Choose a Template
Boardmix offers several templates for different kinds of graphic organizers. Look for the one that suits your needs for a cause and effect graphic organizer and select it.
4. Identify Your Event or Situation
In the center or top of your organizer, identify the event or situation you are analyzing. This is what your causes and effects will stem from.
5. Add Your Causes and Effects
Start adding the causes that lead to the event in the respective section of the graphic organizer. Once you've done this, proceed to write down the effects or outcomes that resulted from these causes in the corresponding area.
6. Customize Your Graphic Organizer
To make your organizer more visually appealing or easy to understand, you can customize it in various ways. Boardmix allows you to change font styles and sizes, adjust colors, or even add images if necessary.
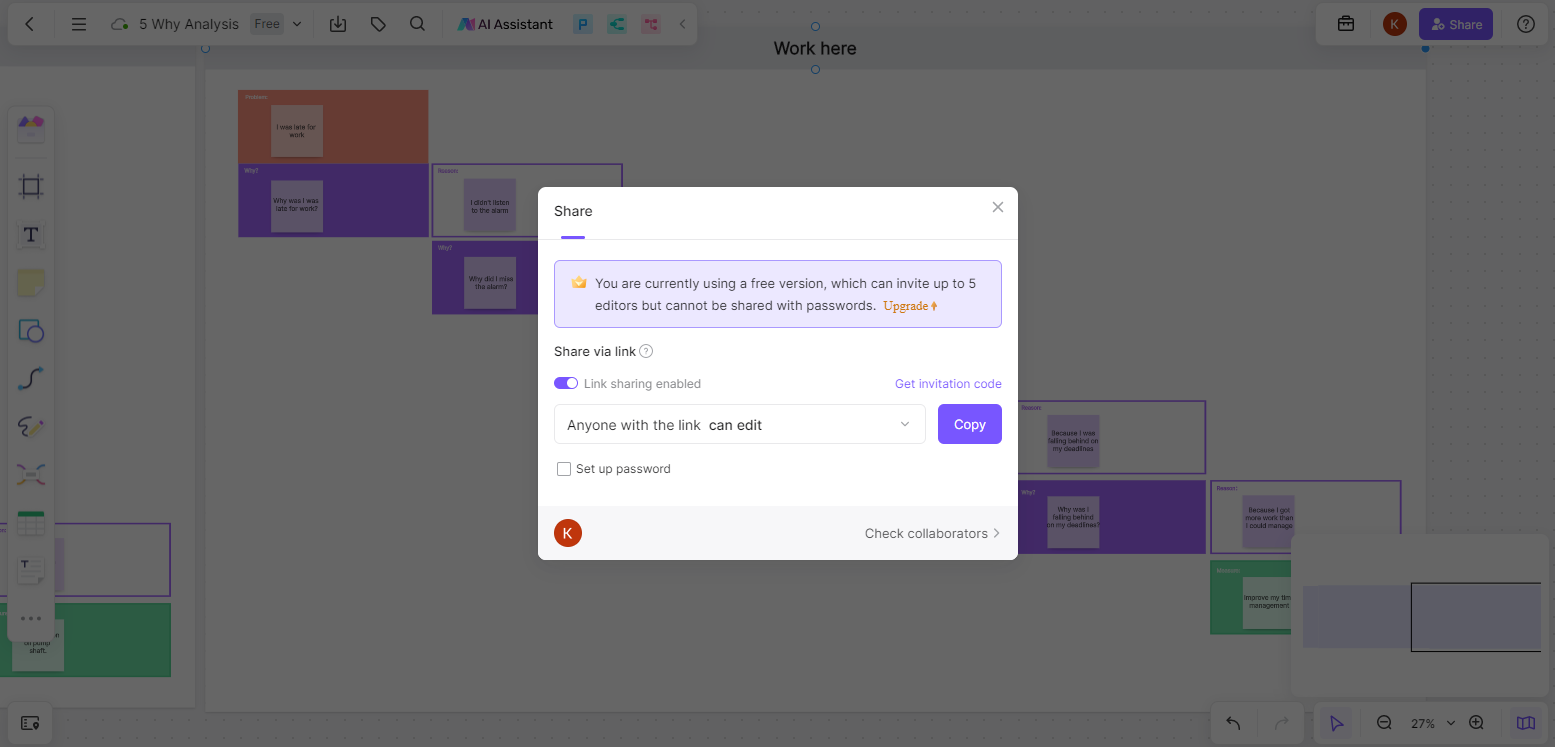
7. Save and Share Your Work
Remember to periodically save your work to avoid losing any information. After you’ve finished creating your cause and effect graphic organizer, you can share it directly with others through email or by generating a shareable link.
Conclusion
A Cause and Effect Graphic Organizer helps to map out and visualize the relationship between various causes and effects related to a specific event or situation. Using Boardmix to create this organizer ensures a neat and efficient way of presenting this information, making it easier to analyze and understand the connections and relationships involved.


