

What is a Venn Diagram?
Definition
A Venn Diagram (also called a set diagram or logic diagram) is an illustration that shows logical relationships between different sets or groups. Venn diagram uses circles (or other shapes) that overlap or don’t overlap to show how given items are similar and different. Overlapping portions of the circles (known as intersections) represent commonalities, while non-overlapping portions represent differences.
History and Origin
The Venn diagram was introduced and popularized in the 1880s by John Venn, a British logician and philosopher. John Venn studied mathematics and logic at Cambridge University and later became a lecturer and fellow at the university. During his time at Cambridge, he developed his groundbreaking ideas on the diagrammatic representation of sets.
In 1880, John Venn published a paper entitled “On the Diagrammatic and Mechanical Representation of Propositions and Reasonings,” which presented his diagrammatic method for representing sets and logical relationships. This article introduced what we now know as Venn diagrams. Since then, Venn Diagram has gained significant recognition and acceptance, and has quickly been applied to various fields.
Formula
Here’s a basic formula for Venn Diagram of two sets:
n ( A ∪ B) = n(A ) + n ( B ) – n ( A∩ B)
Where:
X = number of elements that belong to set A
Y = number of elements that belong to set B
Z = number of elements that belong to set A and B both (A ∩ B)
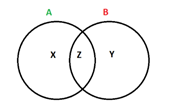
Figure 1
From Figure1, it is clear that
n(A) = x + z ;
n (B) = y + z ;
n(A ∩ B) = z;
n ( A ∪ B) = x +y+ z.
Symbols
Set
A collection of distinct objects or elements that share a common characteristic or property. Each set is represented by a circle or an ellipse in the Venn diagram.
Union (A∪B)
The total collection of elements from all the sets being considered.
Intersection (A∩B)
The overlapping section, representing all elements shared or common within the selected sets.
Symmetric difference
The parts of the sets that do not intersect.
Relative complement
The parts in one set but not in the other.
Absolute complement (Ac)
Whatever is not represented in a particular set, including the area around the circles.
Why use a Venn Diagram?
Visual organization: Venn diagrams allow information to be presented in a structured and organized manner. Hence, they help to visually organize information to see the logic behind the relationships of particular elements.
Logical Analysis: Venn diagrams help to reason complex issues through logic. They make it easier to identify logical implications, inconsistencies, or contradictions. In this way, complex mathematical problems can be reduced to a clear and understandable format.
Data Visualization: Venn diagrams can effectively represent data and information. By comparing data sets in this way, it is easier to find correlations and predict probabilities of certain occurrences, which may not be evident without a Venn diagram.
Decision-making: By leveraging the visual power of Venn diagrams, decision-makers can gain a clearer understanding of the options, criteria, trade-offs, and commonalities involved in their decision-making processes. This can lead to more informed and effective decision-making outcomes.
Overall, Venn diagrams are beneficial and effective in terms of enhanced visual understanding, logical analysis, data visualization, and decision-making. Venn diagrams serve as valuable tools for organizing and interpreting information, making them widely used and appreciated across various domains.
Venn Diagrams in Real Use
Venn diagrams have brought great convenience to people in diverse fields. The streamlined purpose of the Venn diagram to illustrate concepts and groups has led to their popularized use in many fields, including statistics, linguistics, logic, education, computer science, business, etc.
In Education
The Venn diagram was initially regarded as a pedagogical tool and is still widely used in the classroom. Originally used to show the differences and similarities between scientific or logical concepts, it has expanded to other subjects. It can be used for comparing and contrasting, understanding set theory, visualizing data, and is also helpful in categorization and classification, literature analysis, vocabulary development, and so on.
For example, Venn diagrams are commonly employed to teach set theory concepts. Students can use the diagrams to represent sets, elements, intersections, and unions. This helps them grasp the fundamental principles of set theory, such as subsets, complements, and set operations. As for vocabulary development, Venn diagrams help expand students’ vocabulary. They can be used to illustrate word relationships, such as synonyms, antonyms, or word families. Students can better understand word meanings and usage by comparing and contrasting related words.
In Academia
Nowadays, Venn diagrams are also commonly seen in academic fields. They are proven effective in data analysis, concept mapping, comparative studies, statistical analysis, etc.
In the research field, understanding the relationships between different datasets is vitally important for data analysis, and the use of suitable visualization methods is especially important for clarifying established relationships. Hence, generating a Venn diagram is one of the simplest and most effective ways to illustrate these relationships.
Venn diagrams are widely used in biological research, especially in genetic studies. For example, a Venn diagram is one of the most effective ways of examining the overlap of resulting gene lists. Accordingly, various Venn diagram application tools are freely available for particular research needs, such as Venny, VennPlex, and VENNTURE.
Overall, their versatility and visual representation make Venn diagrams valuable tools for organizing information, analyzing data, and fostering conceptual understanding across disciplines and research domains.
In Business
Business is a field where Venn diagrams can be extremely useful because there are always things to compare and consider when making decisions in different corporate settings. For example, these diagrams are often applied for market analysis, competitor analysis, product comparison, project management, risk management, etc.
As for market segmentation, Venn diagrams can be used to segment and analyze target markets. Businesses can tailor their marketing strategies and products/services to specific customer groups by identifying different market segments and their overlapping characteristics. Besides, Venn diagrams can assist in project management by illustrating the interdependencies and overlaps between different project tasks or workstreams. Such visualization helps coordinate efforts, identify critical paths, and manage project timelines effectively.
As we can see, Venn diagrams can help businesses compare different elements and increase their ability to communicate effectively about their ideas and come to a reasonable middle ground.
Here’s a Venn diagram example applied in the business field concerning customer satisfaction and enterprise longevity.
The development of the market economy has urged enterprises to not only achieve satisfactory profit but also keep the enterprise’s longevity and sustainable development. This Venn diagram clearly shows the substantial relationship between customer satisfaction and enterprise longevity.
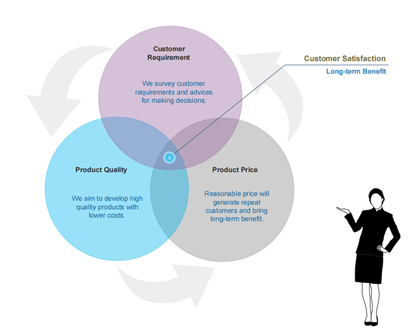
Figure 2
As shown in Figure 2, customer satisfaction comes from the intersection of customer requirements, high-quality products, and reasonable prices. And the realization of customer satisfaction further promotes long-term benefits for the company.
How to make a Venn diagram in Boardmix?
Boardmix is a powerful online collaborative whiteboard that integrates various tools to boost team efficiency and free team imagination. It offers a user-friendly interface that allows users to create, edit, and collaborate on a variety of digital boards. On this virtual whiteboard, you can easily brainstorm ideas, visualize concepts, and share your thoughts.
Versatility is one of the standout features of Boardmix. You can easily add text, images, drawings, sticky notes, and multimedia elements to your boards. It integrates various shapes, text boxes, and a range of expressive drawing tools, allowing you to easily create and edit Venn diagrams.
Use Boardmix to make a Venn diagram
1) Access Boardmix & Create a new board: Visit the Boardmix website (or open the Boardmix application) and sign in to your account. (If you don’t have an account, you can create one for free.) Once logged in, create a new board by selecting the option to start a new project or board.
2) Choose the Venn diagram template or make one yourself: Look for a Venn diagram template among the options Boardmix provides in the template gallery. You can also create one using different shapes.
3) Customize your Venn diagram: If you select the Venn diagram template, you’ll be taken to the canvas, where you can customize and edit the diagram. You can modify the size and layout of the circles or ellipses.
4) Add labels & populate the sets: Use the text tool or text boxes to add labels or titles to each set and the overlapping regions if needed. Depending on the purpose of your Venn diagram, populate each set by adding elements or items. You can use shapes, text boxes, sticky notes, or images to represent the elements within each set.
5) Customize further: Boardmix offers various customization options, including colors, fonts, line styles, and shapes. You can modify these elements to make your Venn diagram visually appealing and easy to understand.
6) Collaborate and share: If you’re working with a team or want to gather feedback, you can invite collaborators to join your board. Boardmix allows real-time collaboration, where multiple users can edit the Venn diagram simultaneously. You can also share the board with others by generating a shareable link or exporting the diagram in a compatible format.


