


In today's world where information overload is common, presenting data visually can make a difference. That's where flowcharts come in handy. This article offers a step-by-step guide on how to create a flowchart in PowerPoint, outlines its drawbacks, and provides an efficient alternative for making flowcharts.
What is a Flowchart?
A flowchart is a diagrammatic representation that illustrates a solution model to a given problem. Used extensively in business organizations, flowcharts have proven invaluable in conveying complex process steps, decision points, and system interfaces. The power of flowcharts lies in their simplicity. They communicate processes with clear, universal symbols and flow lines that can be understood by virtually anyone within the organization or sector.
How to Create a Flowchart in PowerPoint?
Creating a flowchart in PowerPoint can be achieved through various methods. This section details the two most popular ways to create flowcharts: using the Shapes Library and using SmartArt. These tools are built into the software, making the process more streamlined.
Using the Shapes Library
Excel provides a wide array of shapes that can be used to create your flowchart. Here's how:
- Start PowerPoint: Launch the application on your computer.
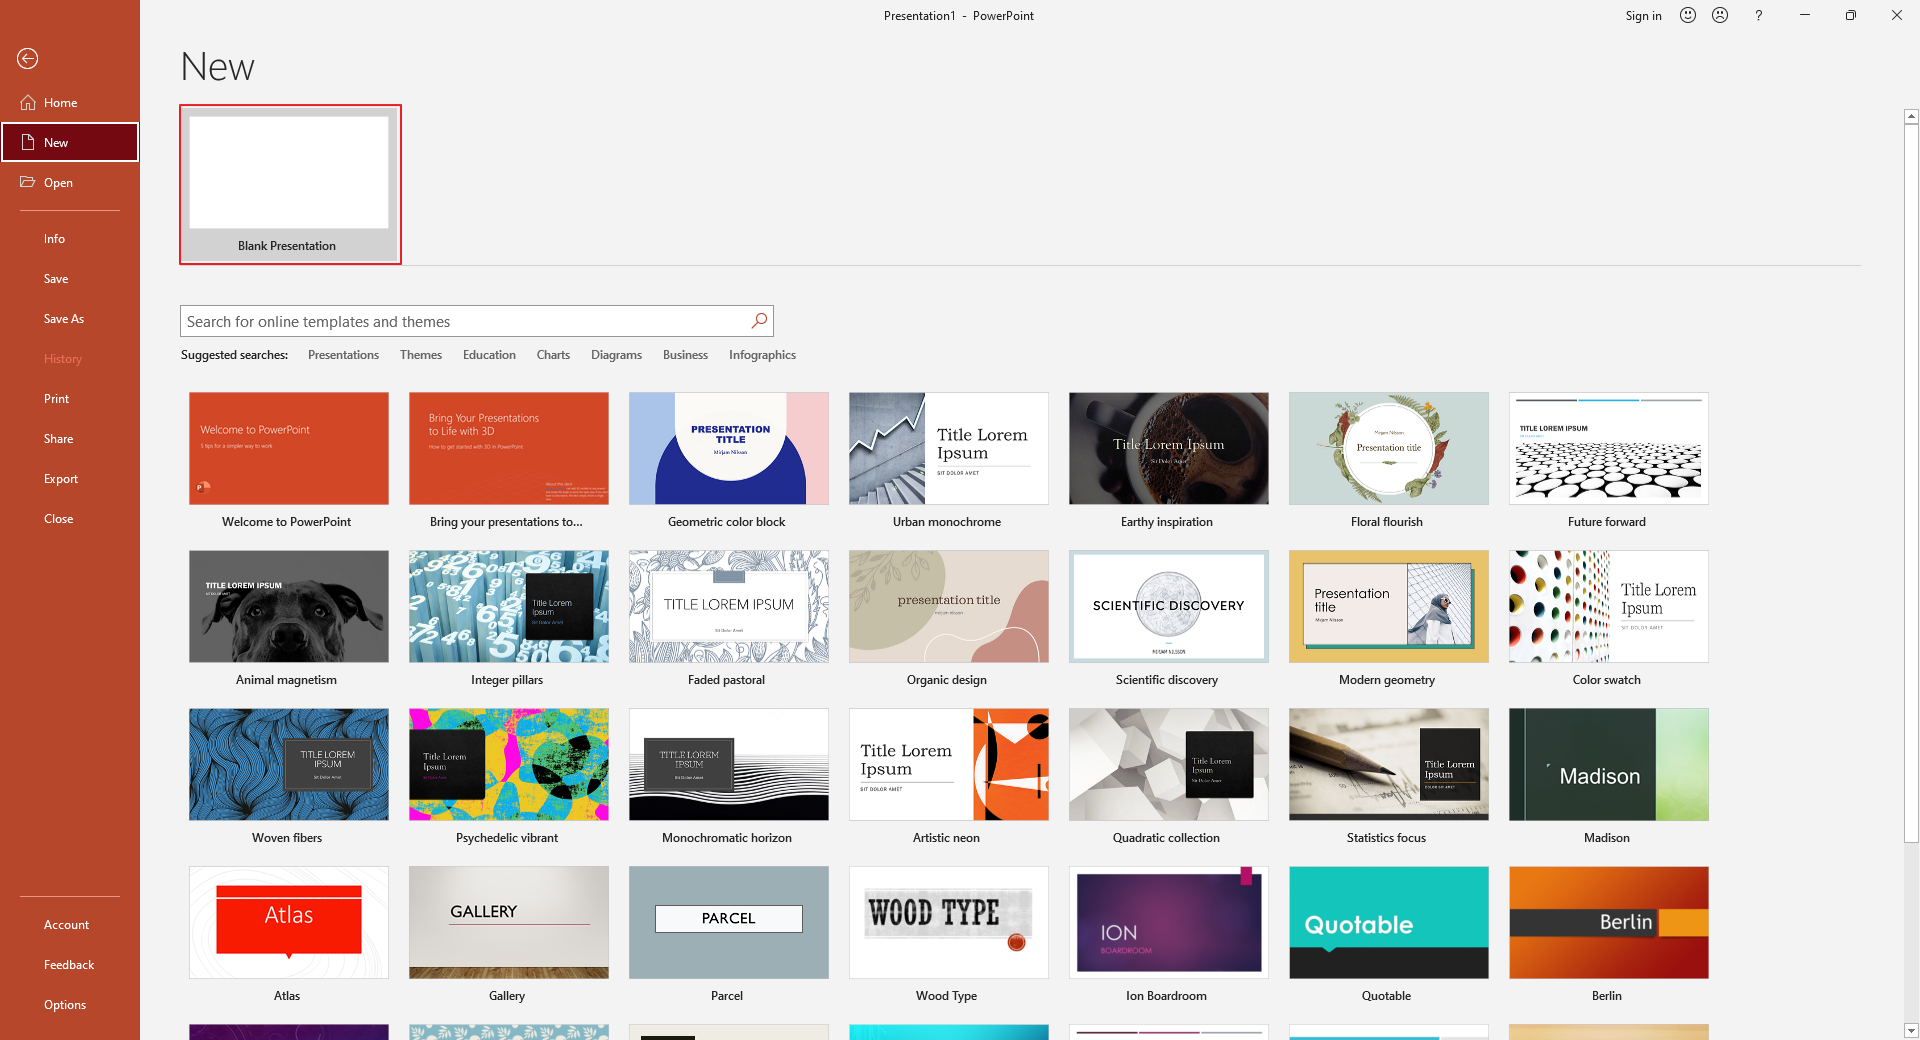
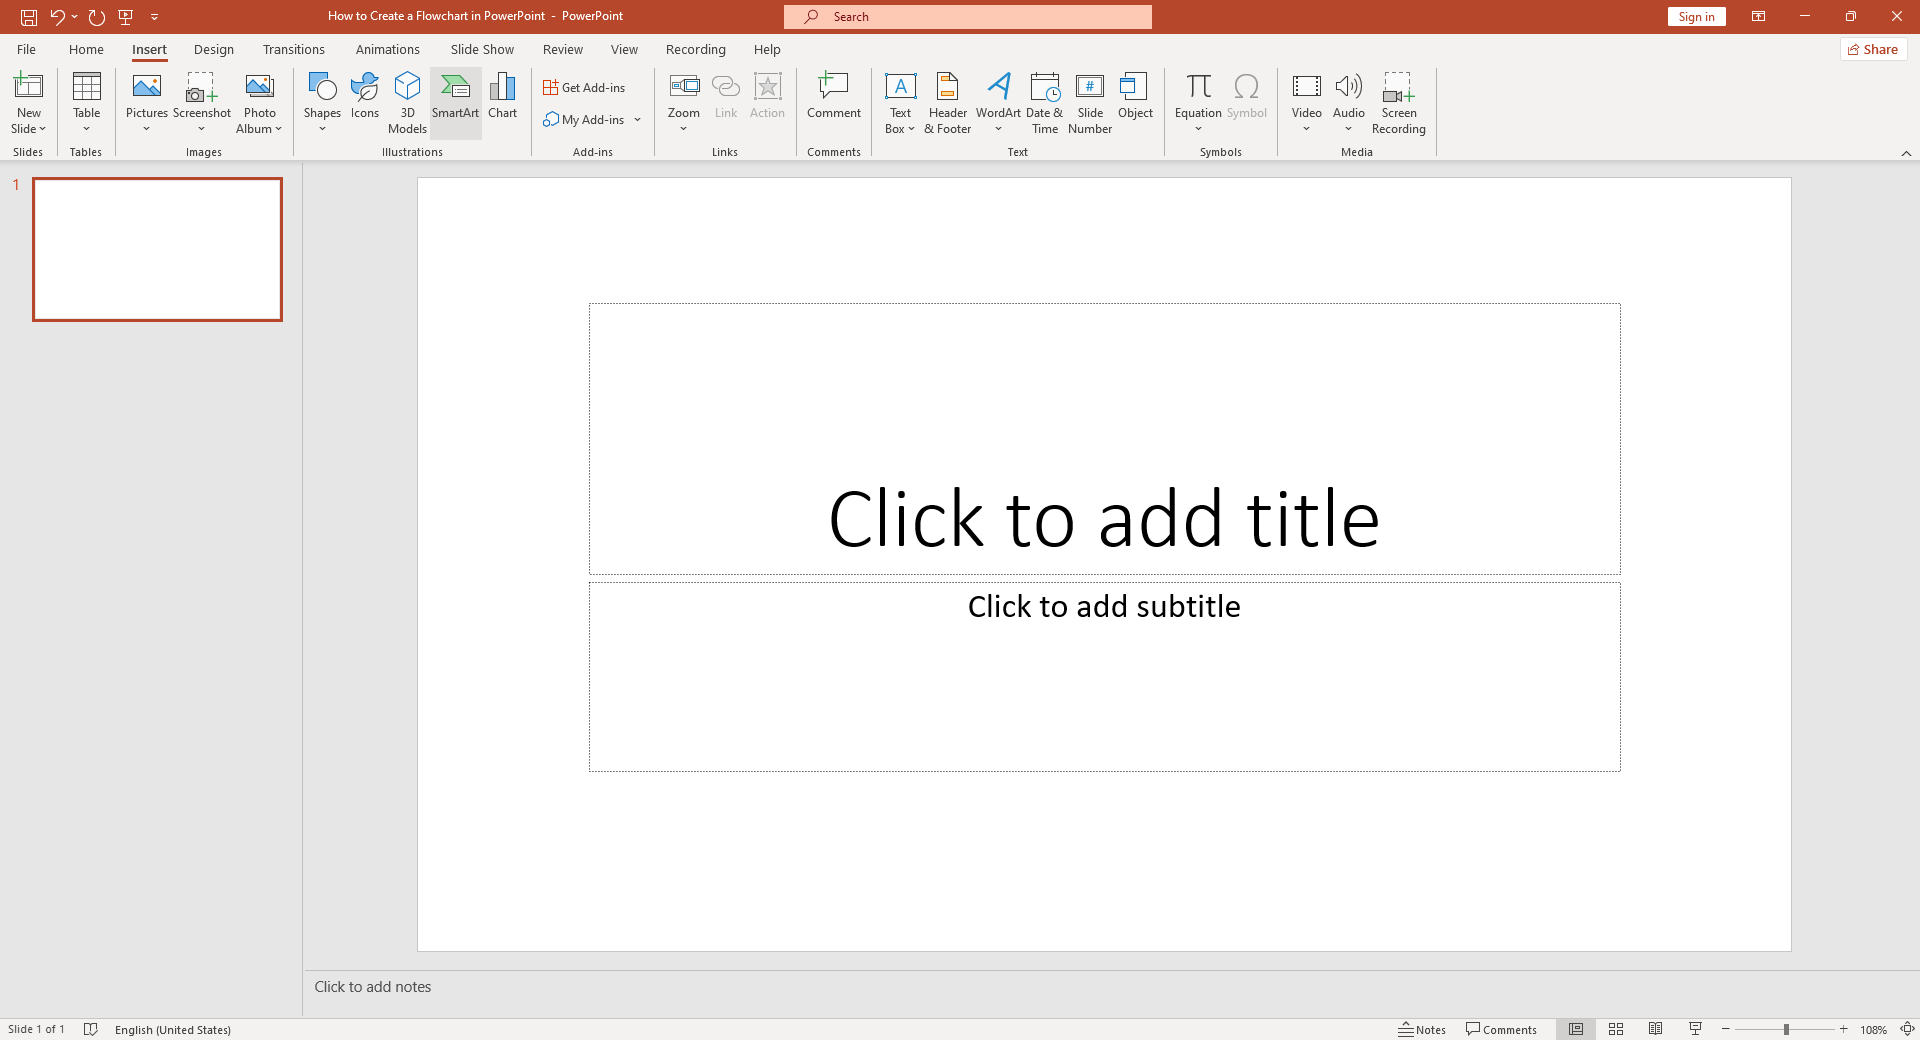
- Open a blank presentation: Navigate to the File menu, select New, and click on Blank Presentation.
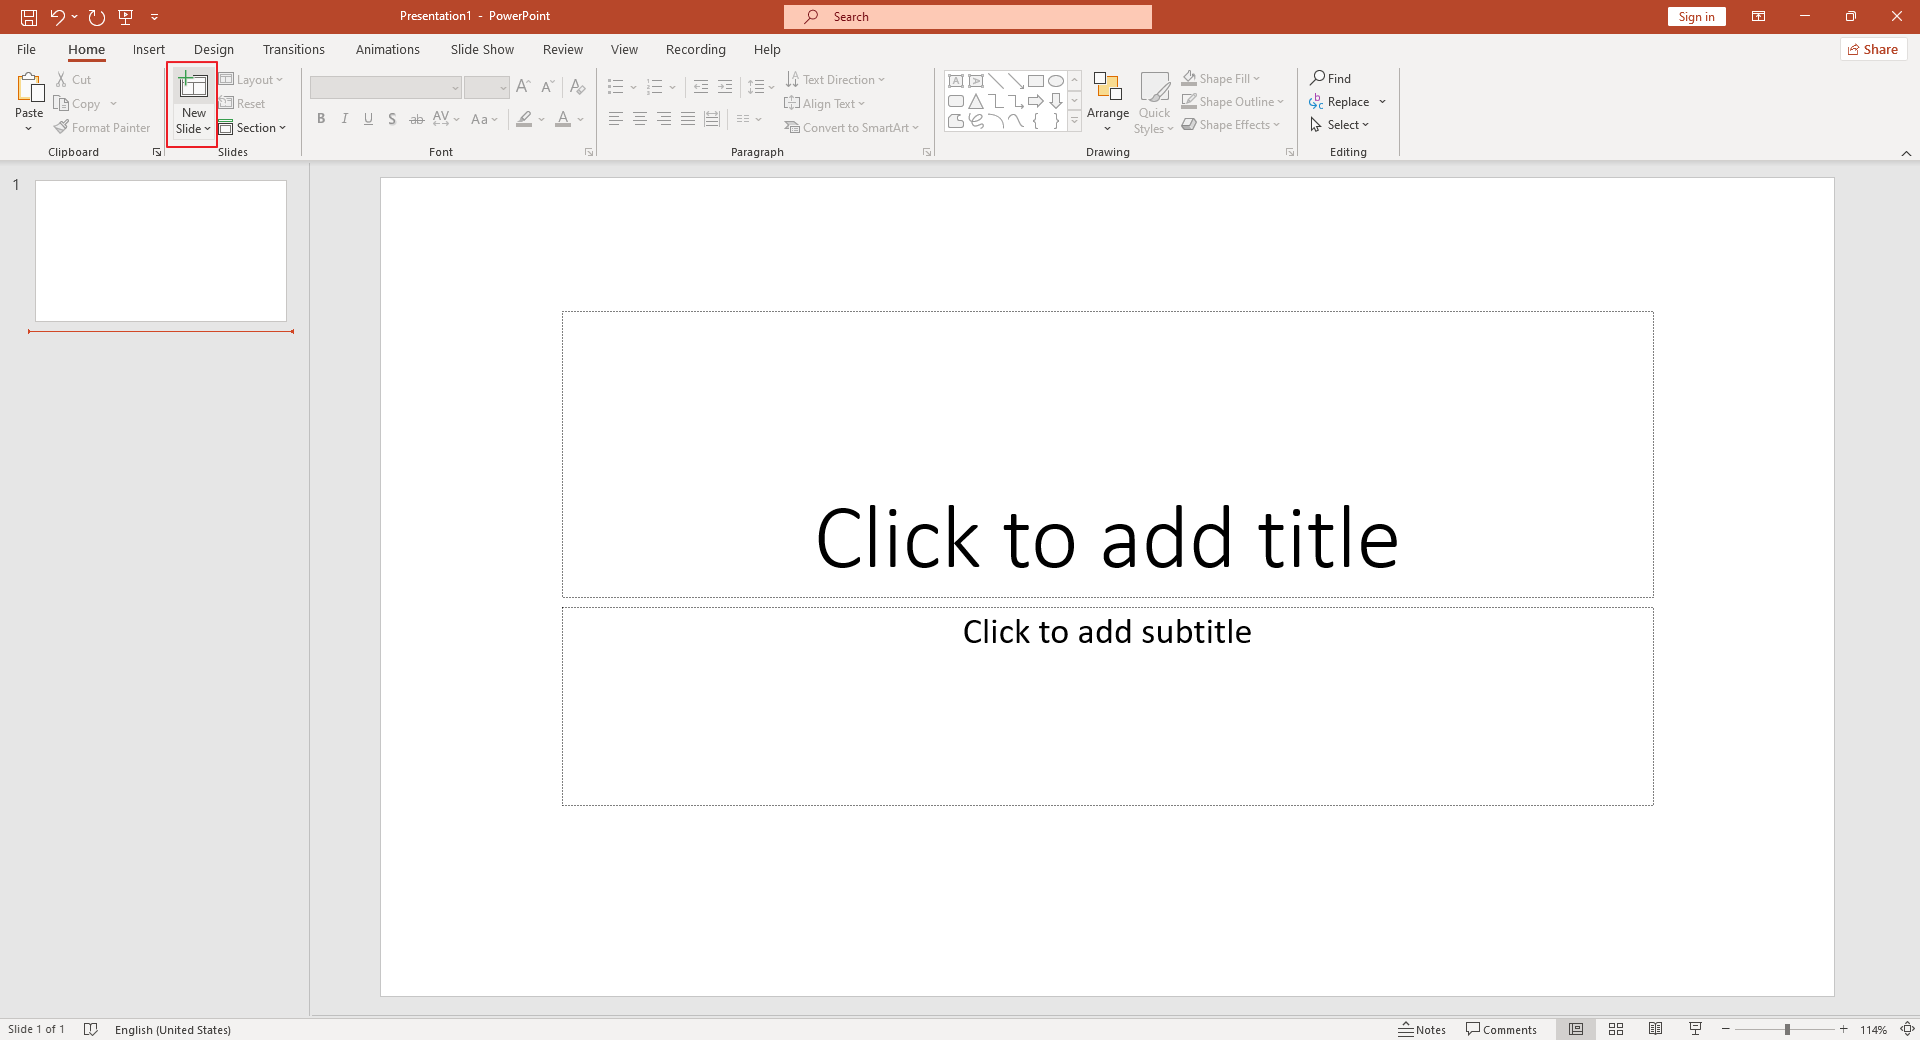
- Create a new slide: Click on the Home tab, followed by New Slide, and select the layout that best suits your needs.
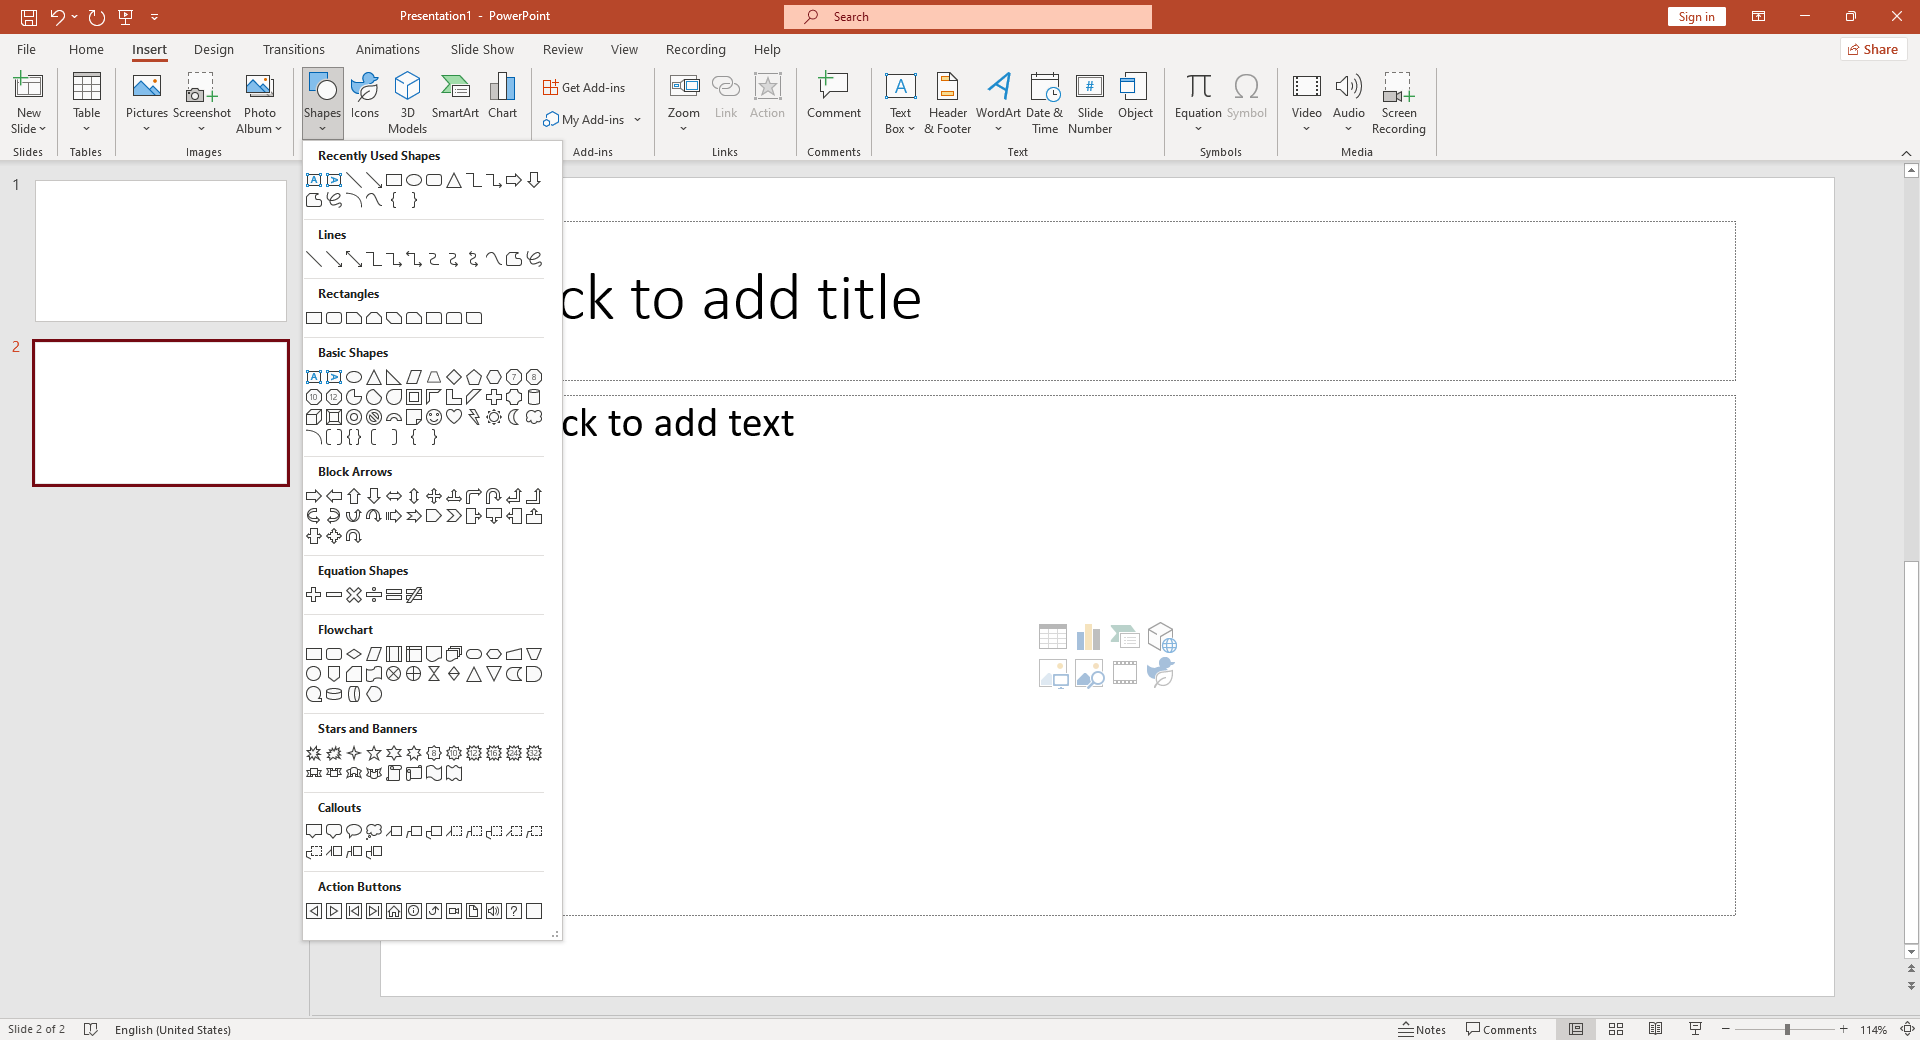
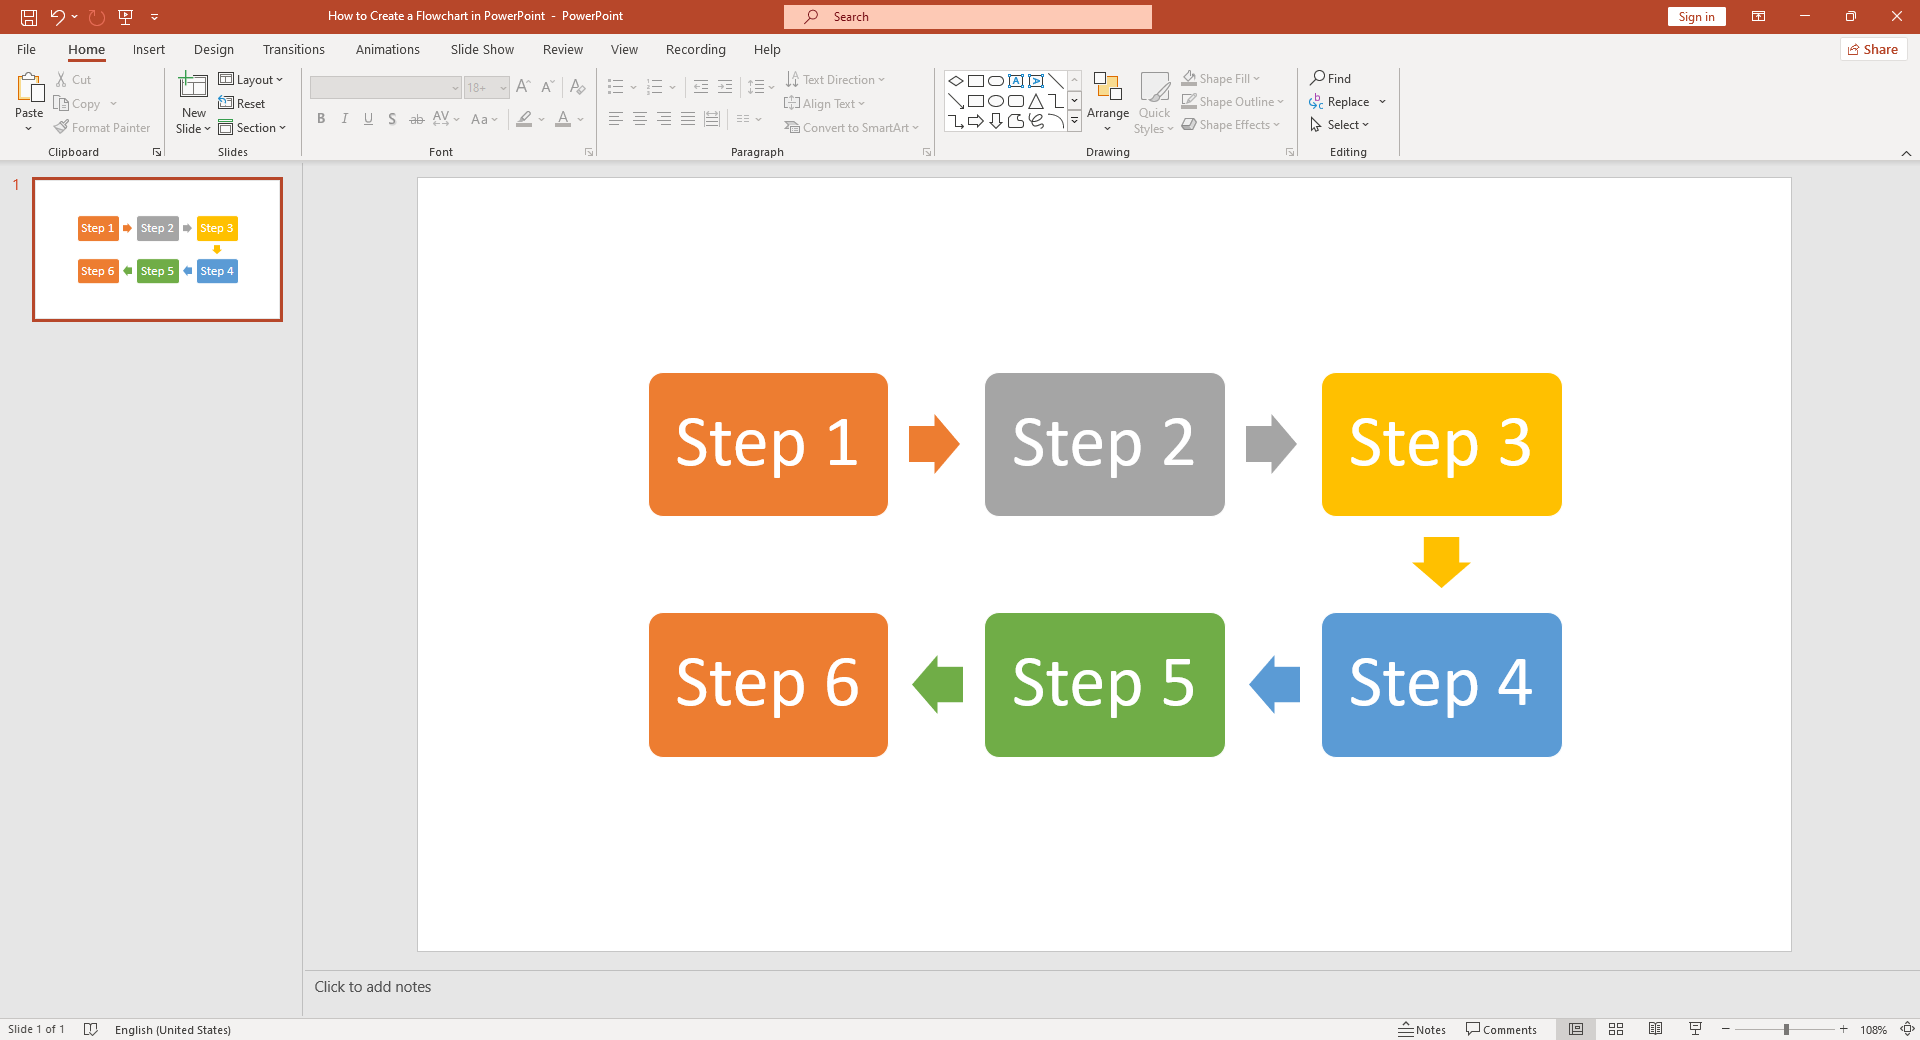
- Select shapes from the Shapes Library: Go to the Insert tab and click on Shapes. A drop-down menu will appear with a variety of shapes. Select the one that best fits your needs and drag it onto your slide.
- Add text to shapes: Right-click on your shape and select Edit Text. You can now type inside your shape.
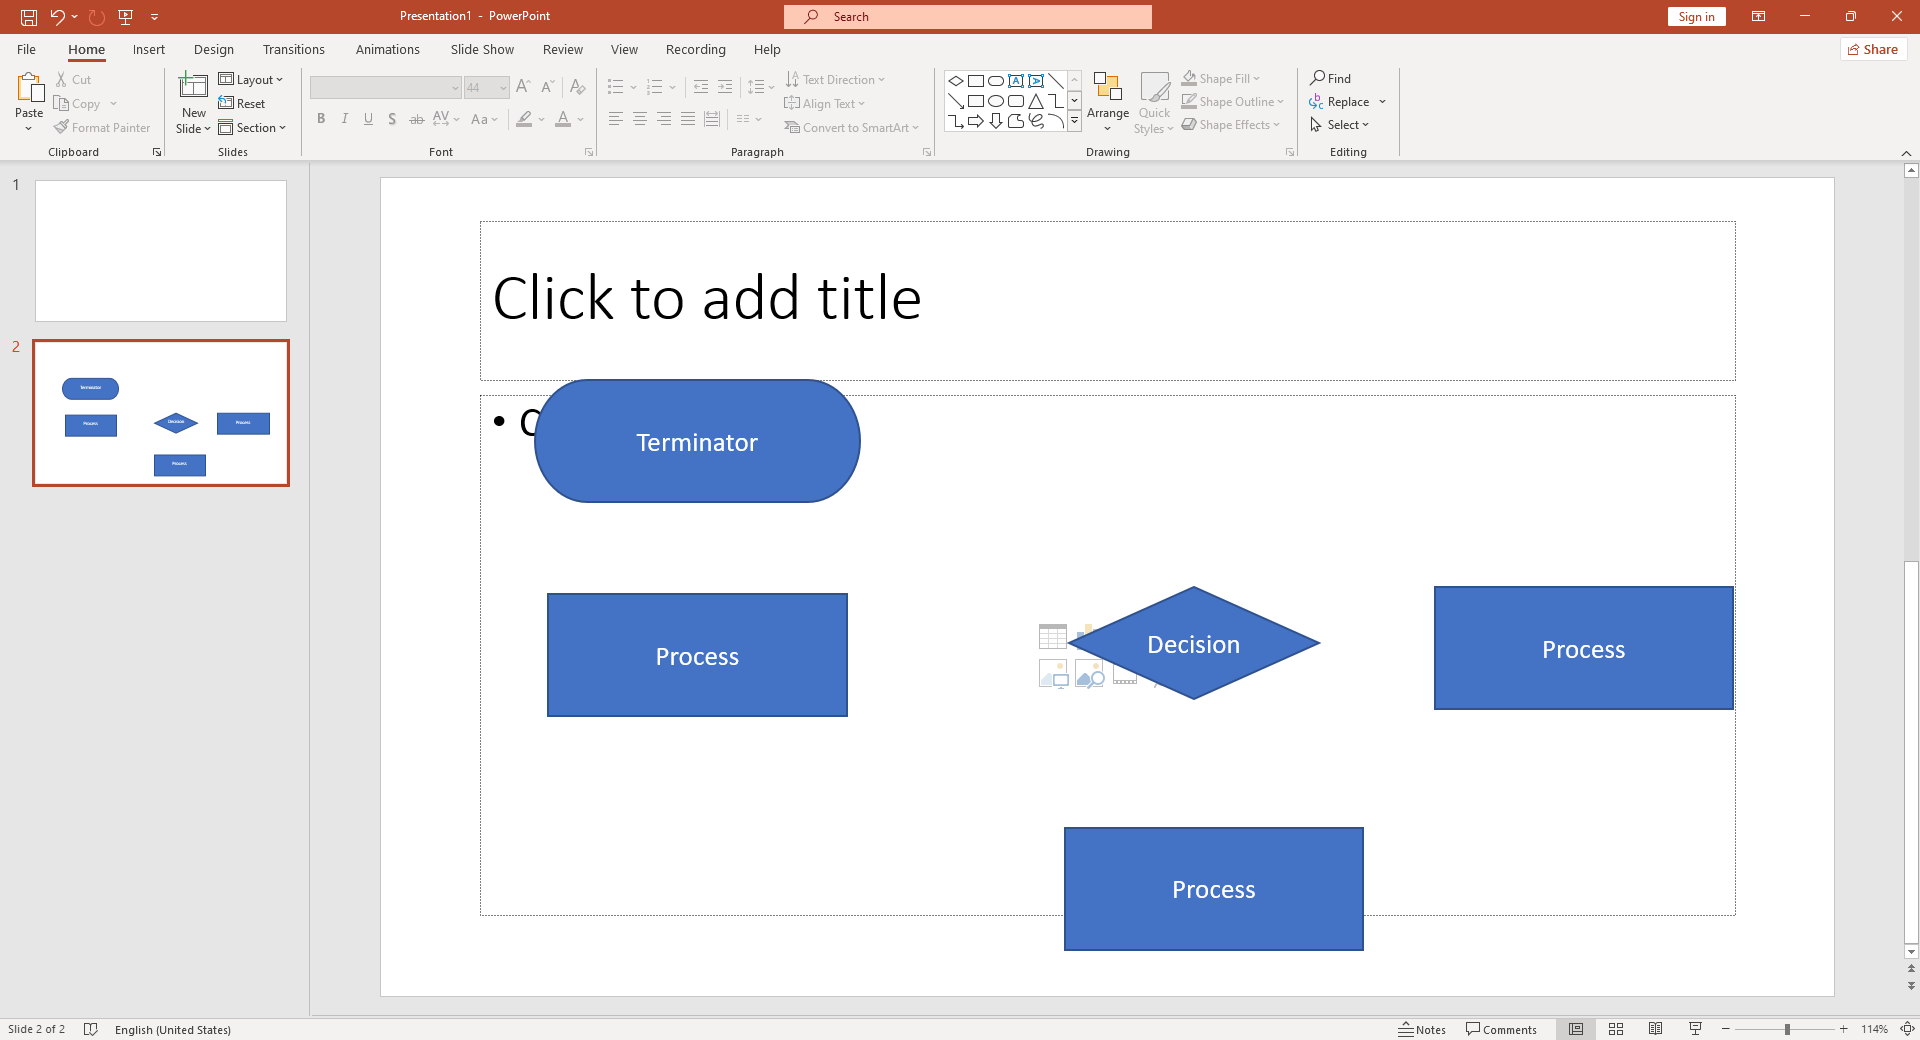
- Repeat steps 4 and 5: Keep adding shapes and connecting them until your flowchart is complete.
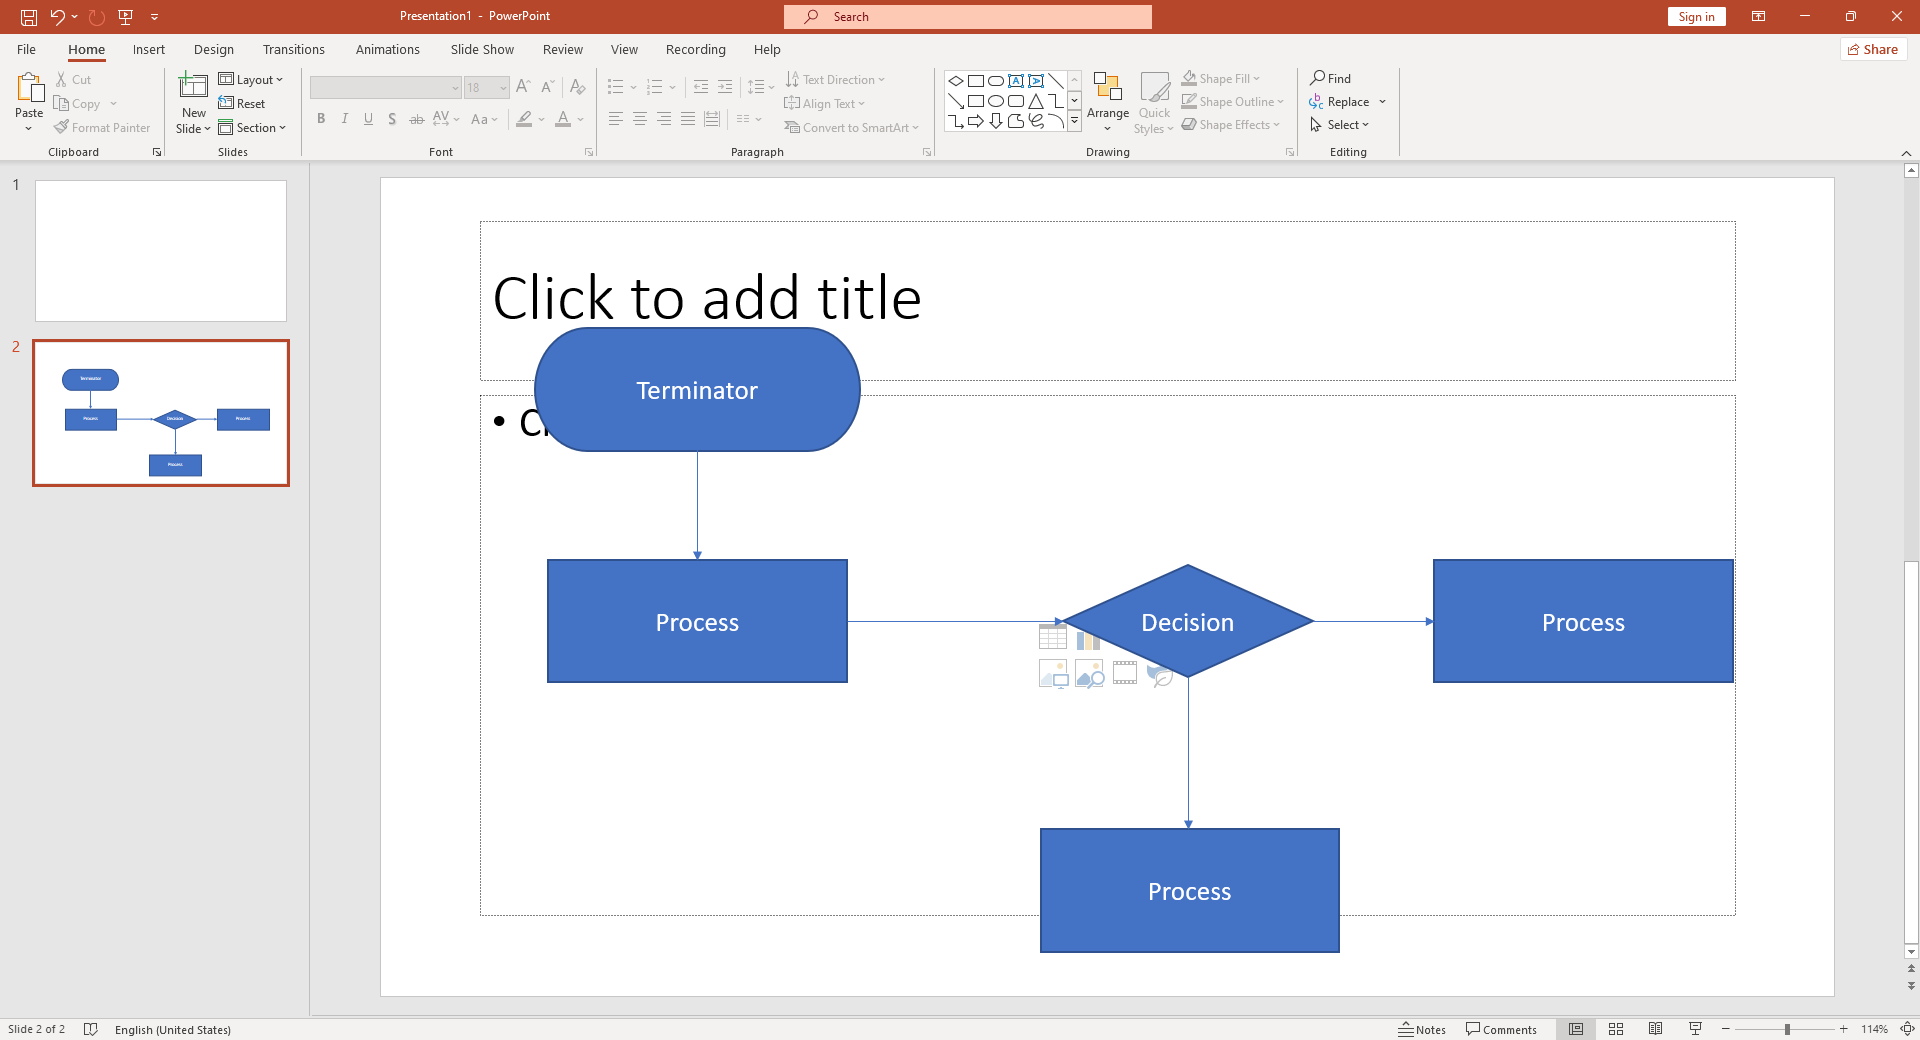
- Connect the shapes: Under the Insert tab, click on Shapes again and select one of the connector lines or arrows to link your shapes together.
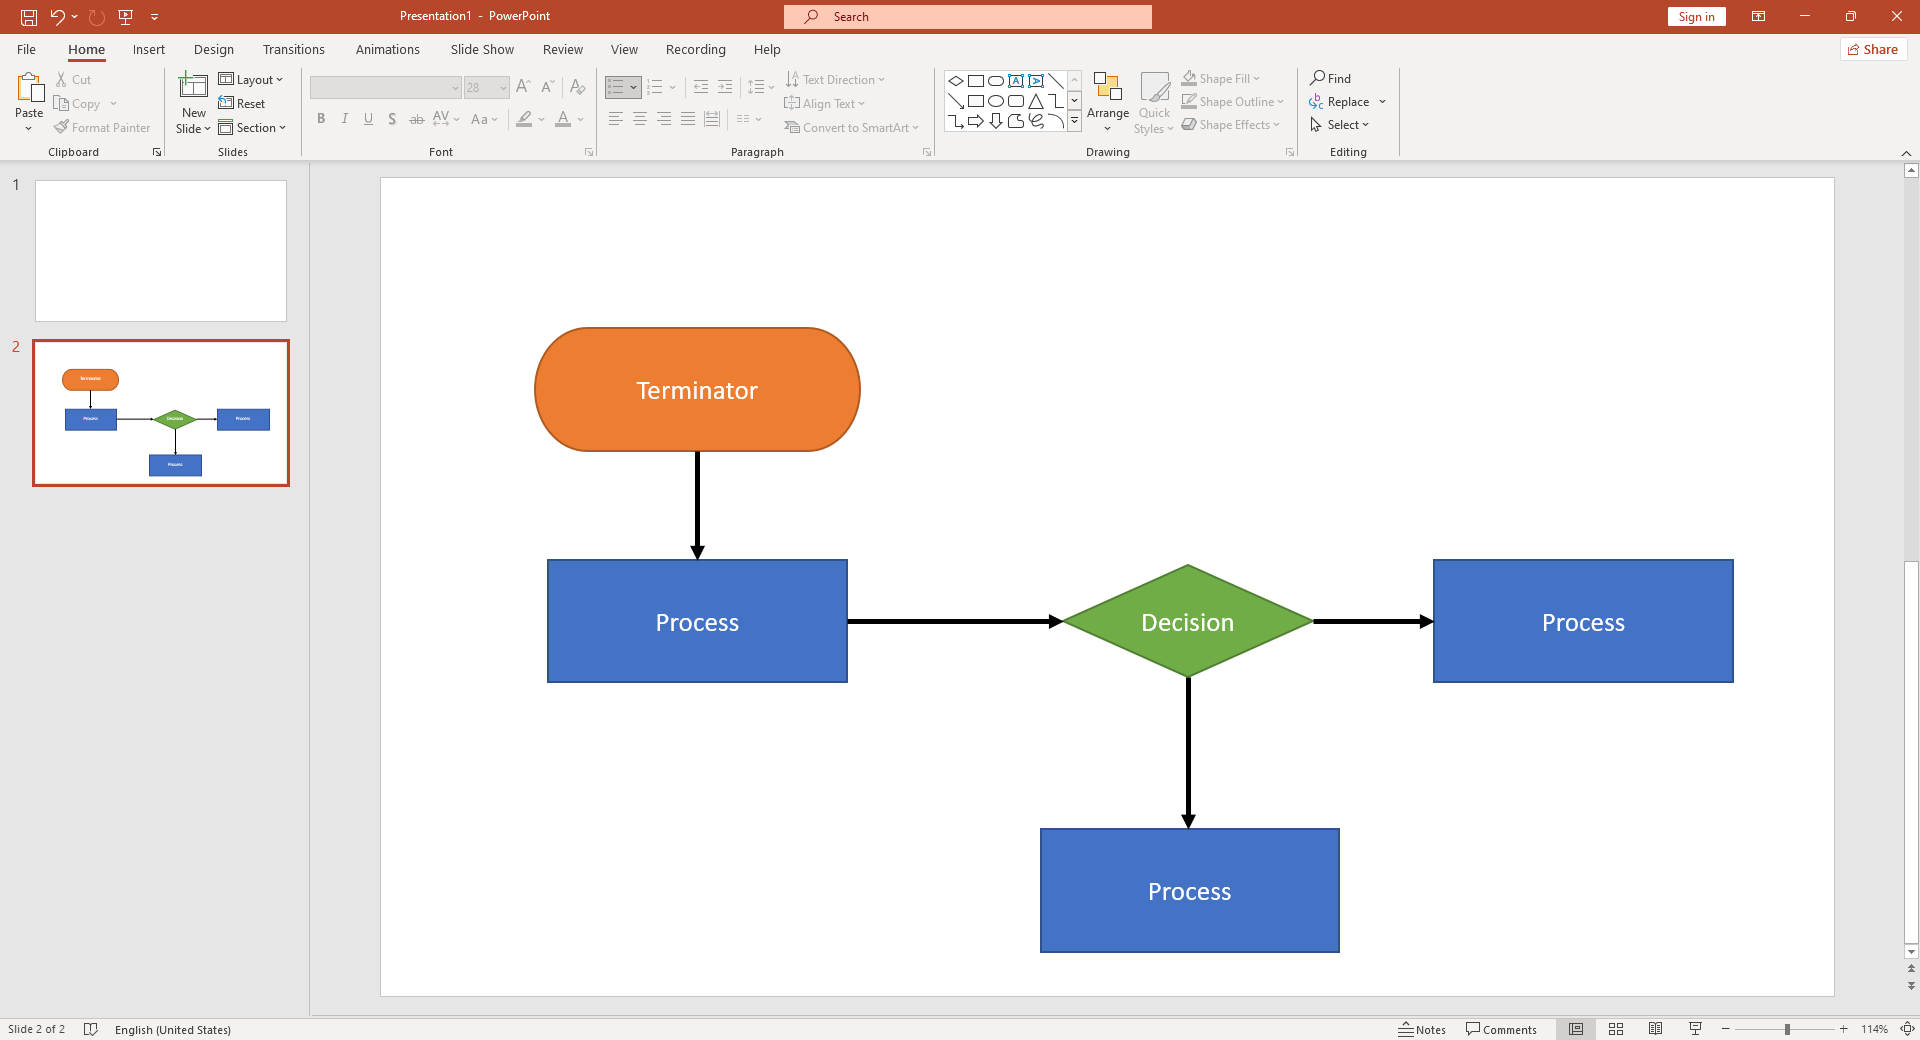
- Finalize your chart: Customize your flowchart by adding color, adjusting line thickness, aligning shapes, and ensuring everything is to your satisfaction.
Using SmartArt
PowerPoint's SmartArt feature is another effective way to create a flowchart, especially for those who prefer a more automated approach. Here's how:
- Open SmartArt: Navigate to the Insert tab on the PowerPoint ribbon and click on SmartArt.
- Choose a flowchart template: In the SmartArt dialog box, scroll down to the Process This category has several flowchart templates.
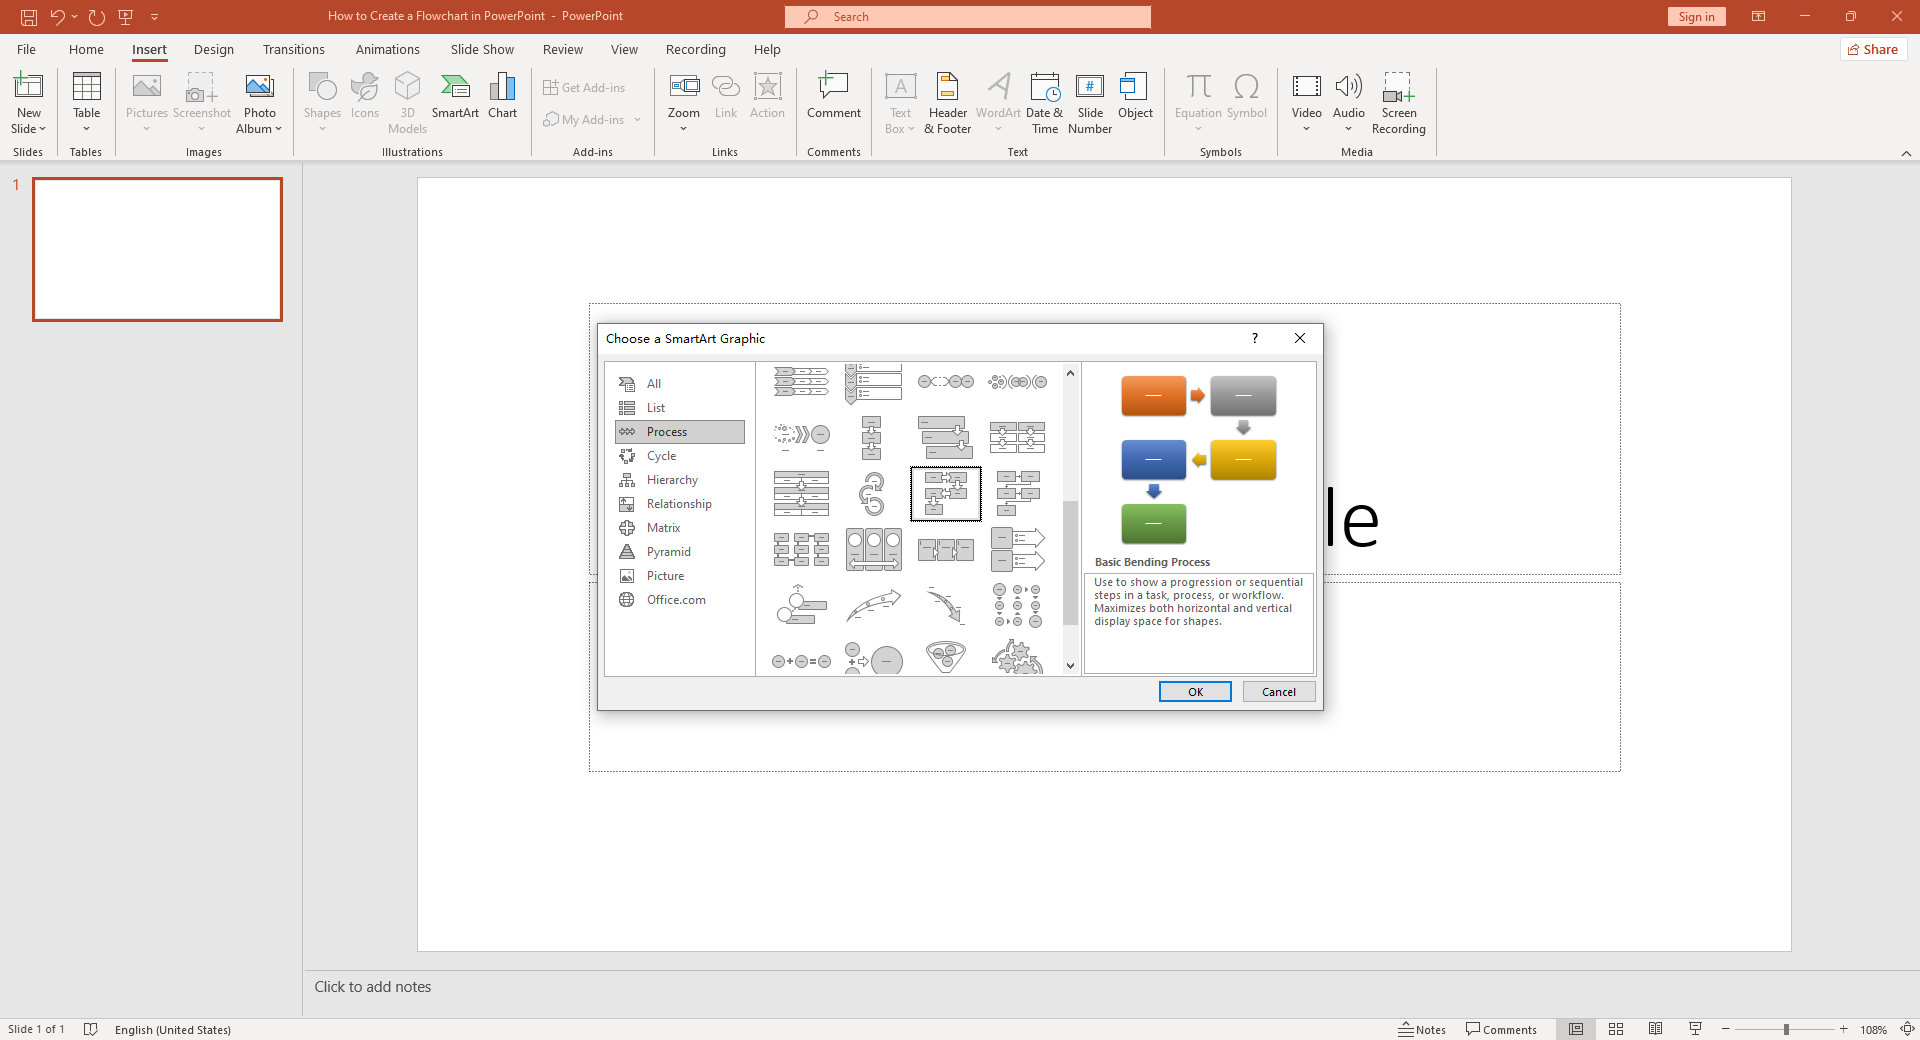
- Select a template: Click on a template that suits your needs, then click OK. The template will now appear on your slide.
- Add text: Click on the [Text] placeholders in the SmartArt shape to add your text.
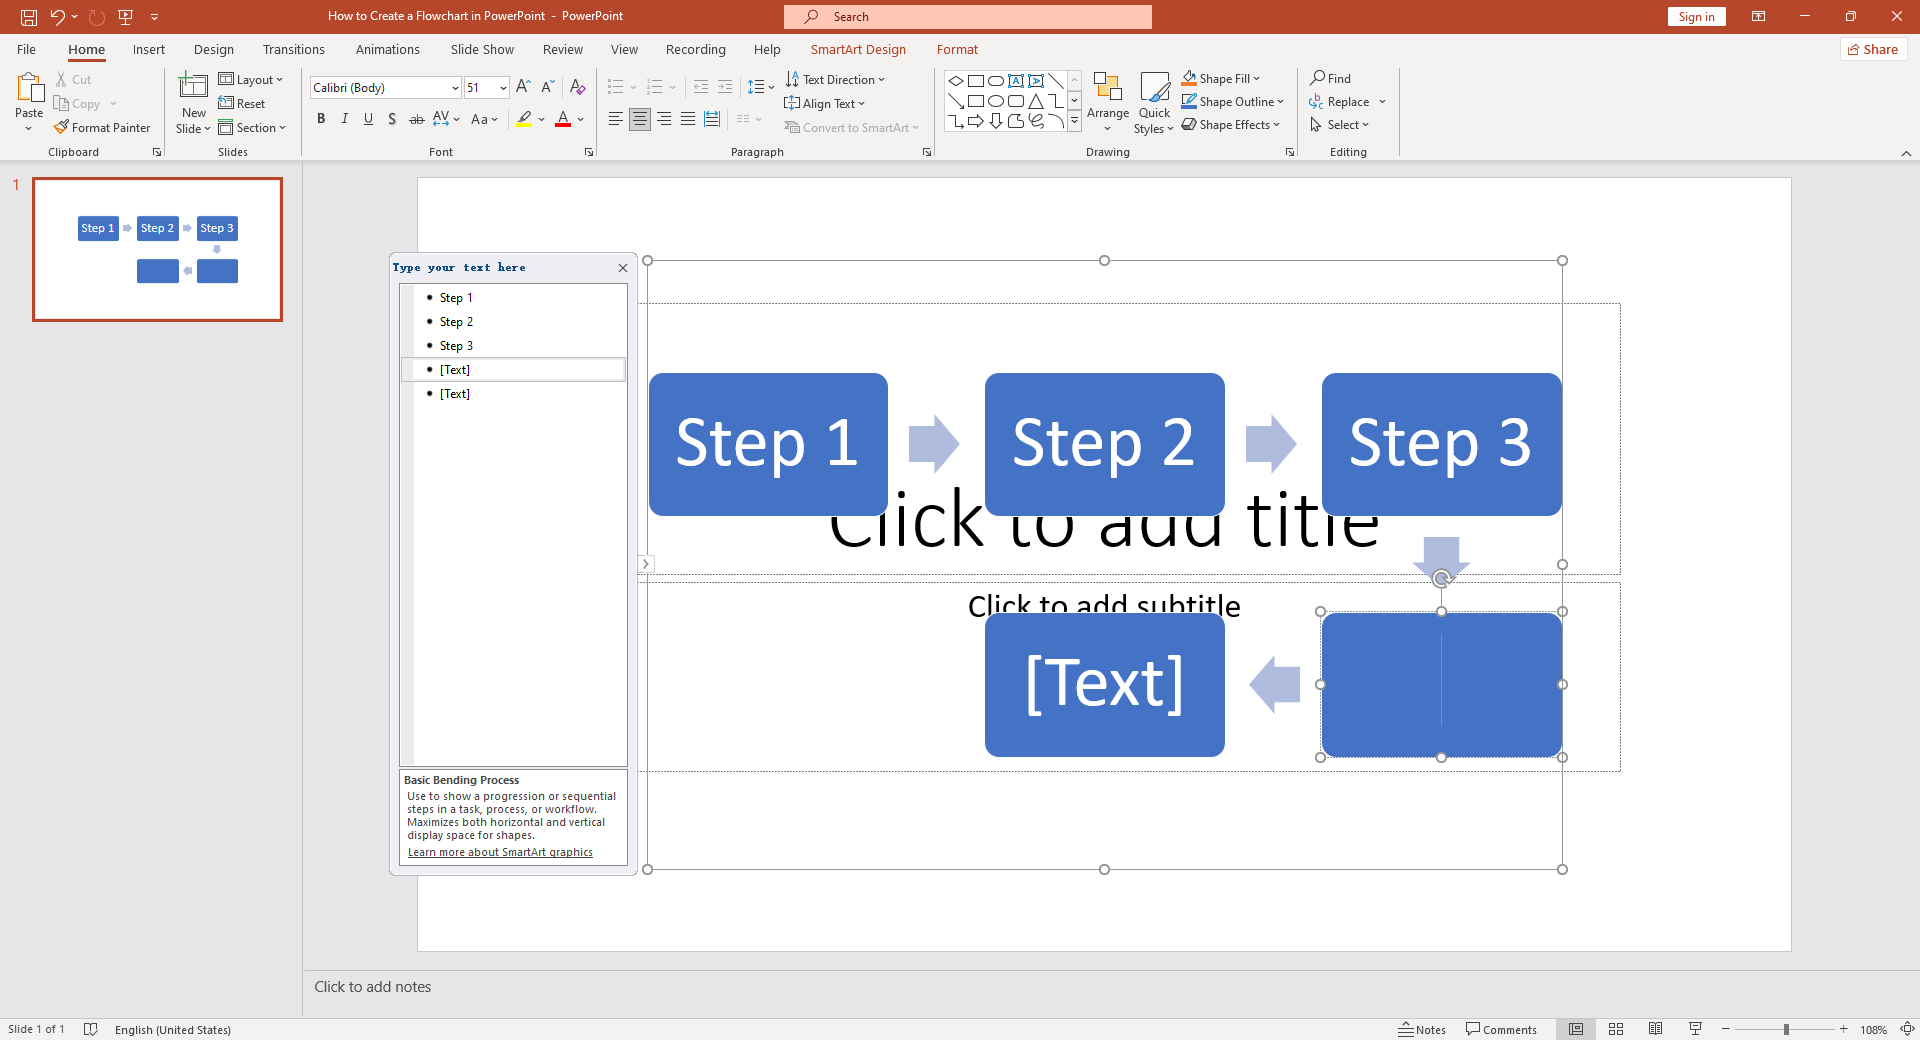
- Customize your chart: Change colors, adjust the size of shapes, add or delete shapes, and fine-tune the chart as needed.
- Finalize: Once you are satisfied with your flowchart, you can save your presentation.
By employing these methods, even those new to PowerPoint can efficiently create comprehensive flowcharts for various purposes.
Major Drawbacks of Creating a Flowchart in PowerPoint
While creating flowcharts in PowerPoint is possible, it may not be the most efficient or effective way to do so. Here are some drawbacks:
- Limited shape variety: PowerPoint offers limited options for process symbols, which may not adequately represent all types of process steps.
- Lack of precision: Aligning shapes and connectors can be challenging in PowerPoint. Without precise alignment tools, the diagram can end up looking messy and unprofessional.
- No automatic updates: If changes are needed, you have to manually edit every shape or connector affected by those changes, which can be time-consuming and error-prone.
Create Effortless Flowcharts with Boardmix
If you find PowerPoint too challenging or time-consuming for creating flowcharts, there's a highly efficient alternative: Boardmix. This online tool is specially designed for creating diagrams, offering an intuitive interface, advanced features, and a multitude of pre-designed templates. Here are two simple ways to create impressive flowcharts with Boardmix.
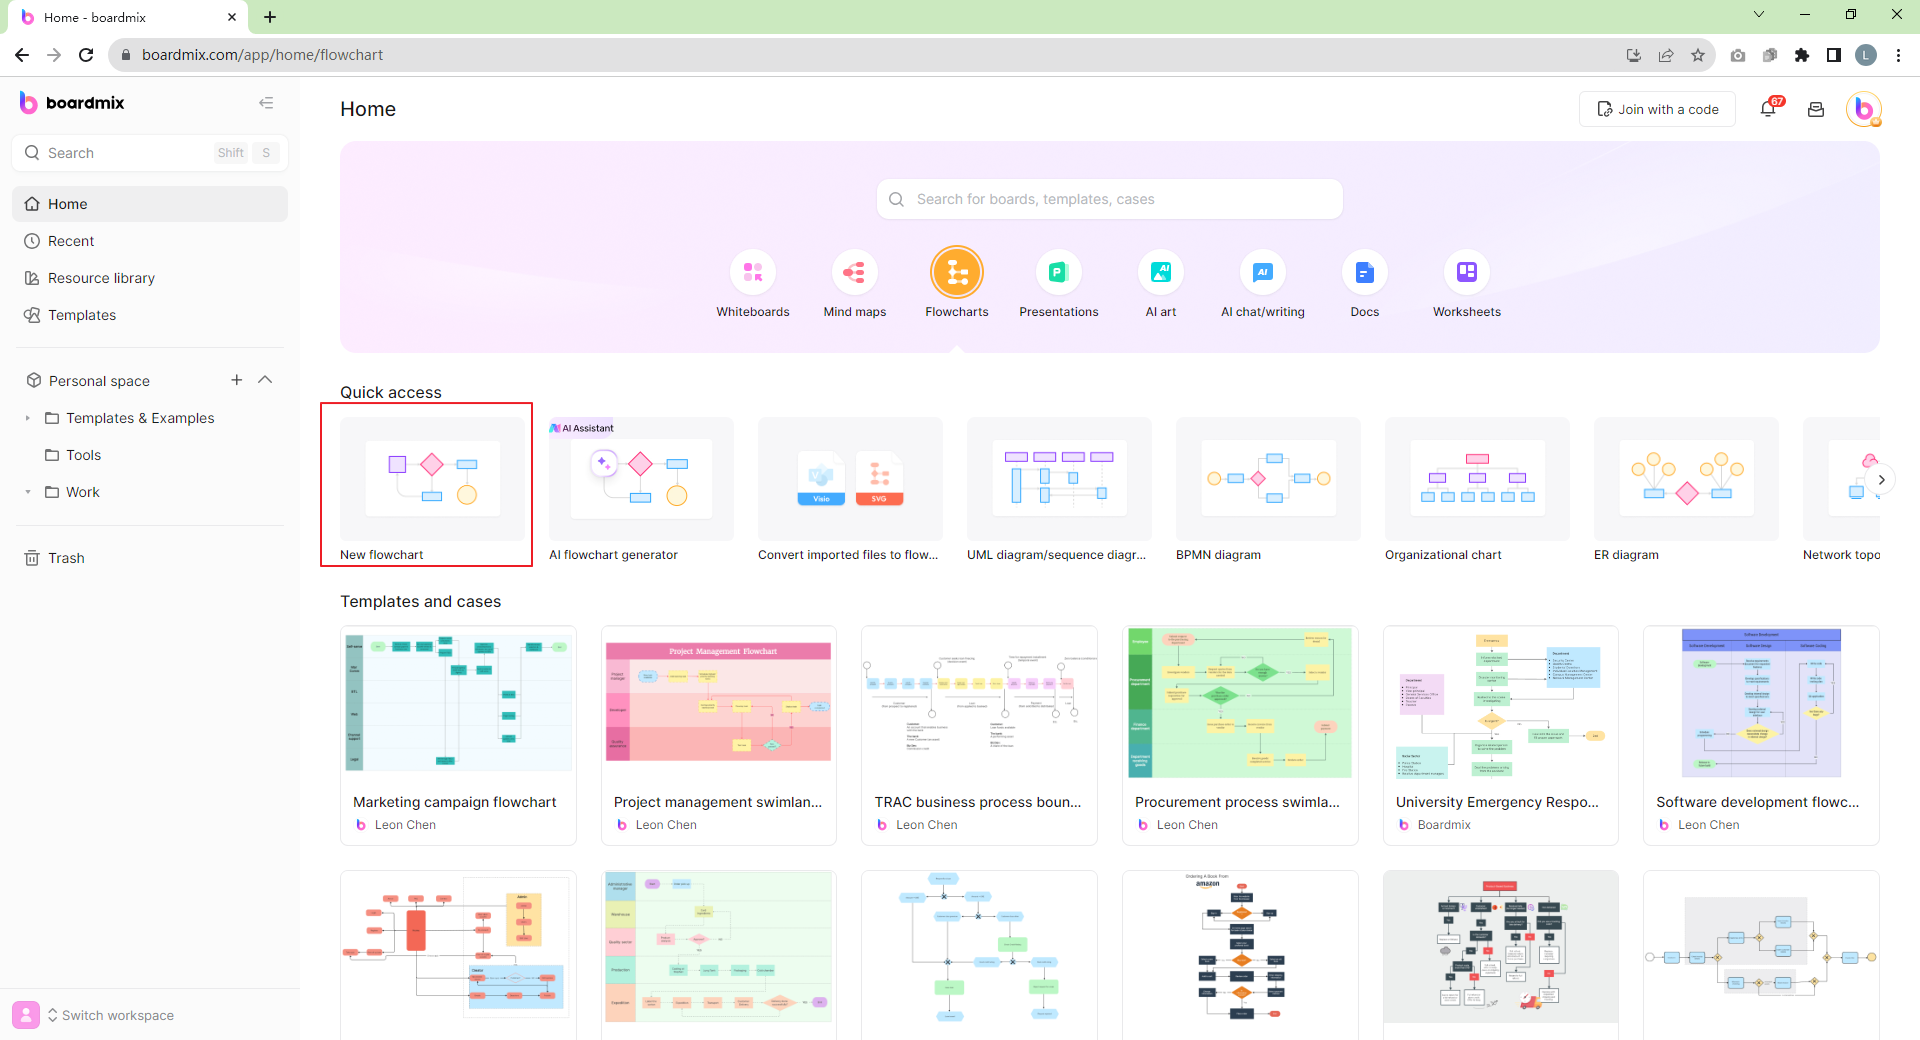
Using Pre-Built Templates
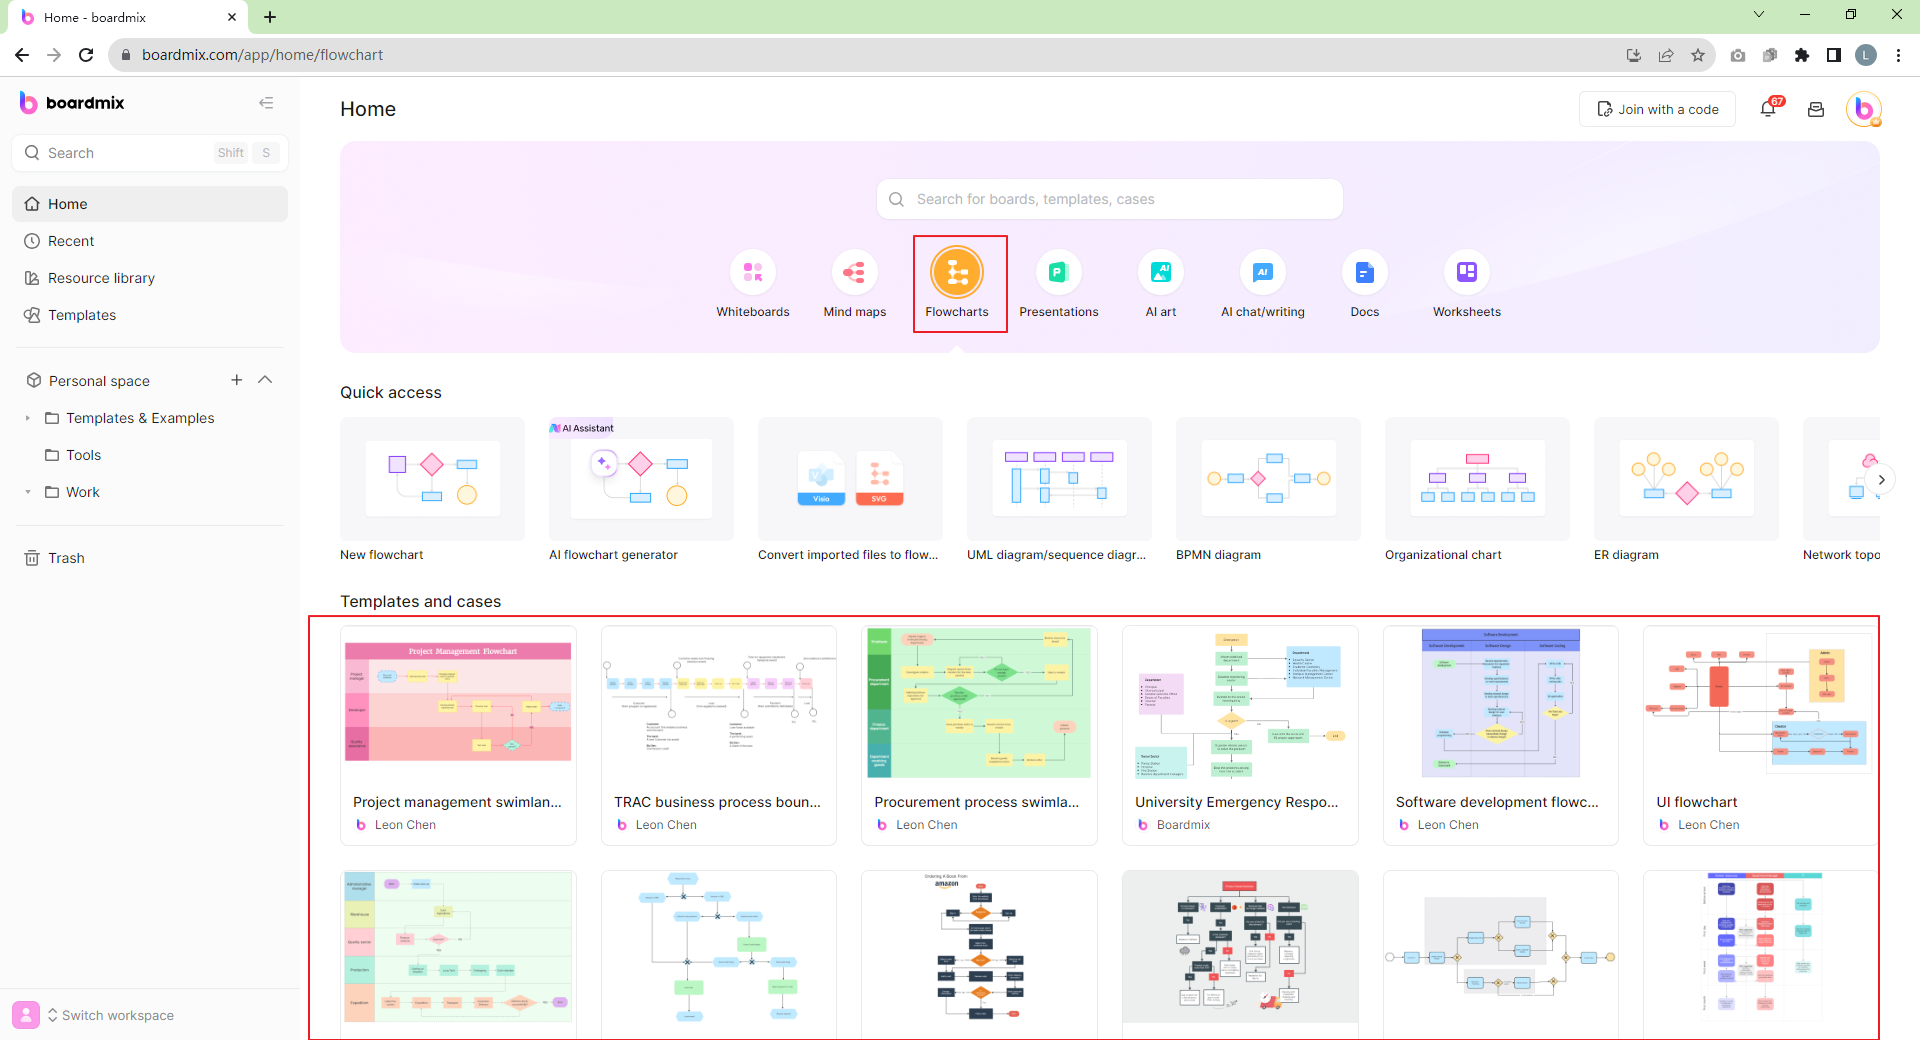
Boardmix features an extensive selection of pre-built templates that cater to various industries and use-cases. Whether you need a sales process chart, a project management flowchart, or an organizational structure diagram, there's likely a template that's perfect for your needs.
Here are the steps:
- Select a template: Go to Home>Flowcharts menu, browse through the template gallery and select one that closely matches what you need.
- Customize: Each element in the template can be modified. Click on any shape to change its color, size, or text. Rearrange shapes or add new ones as needed.
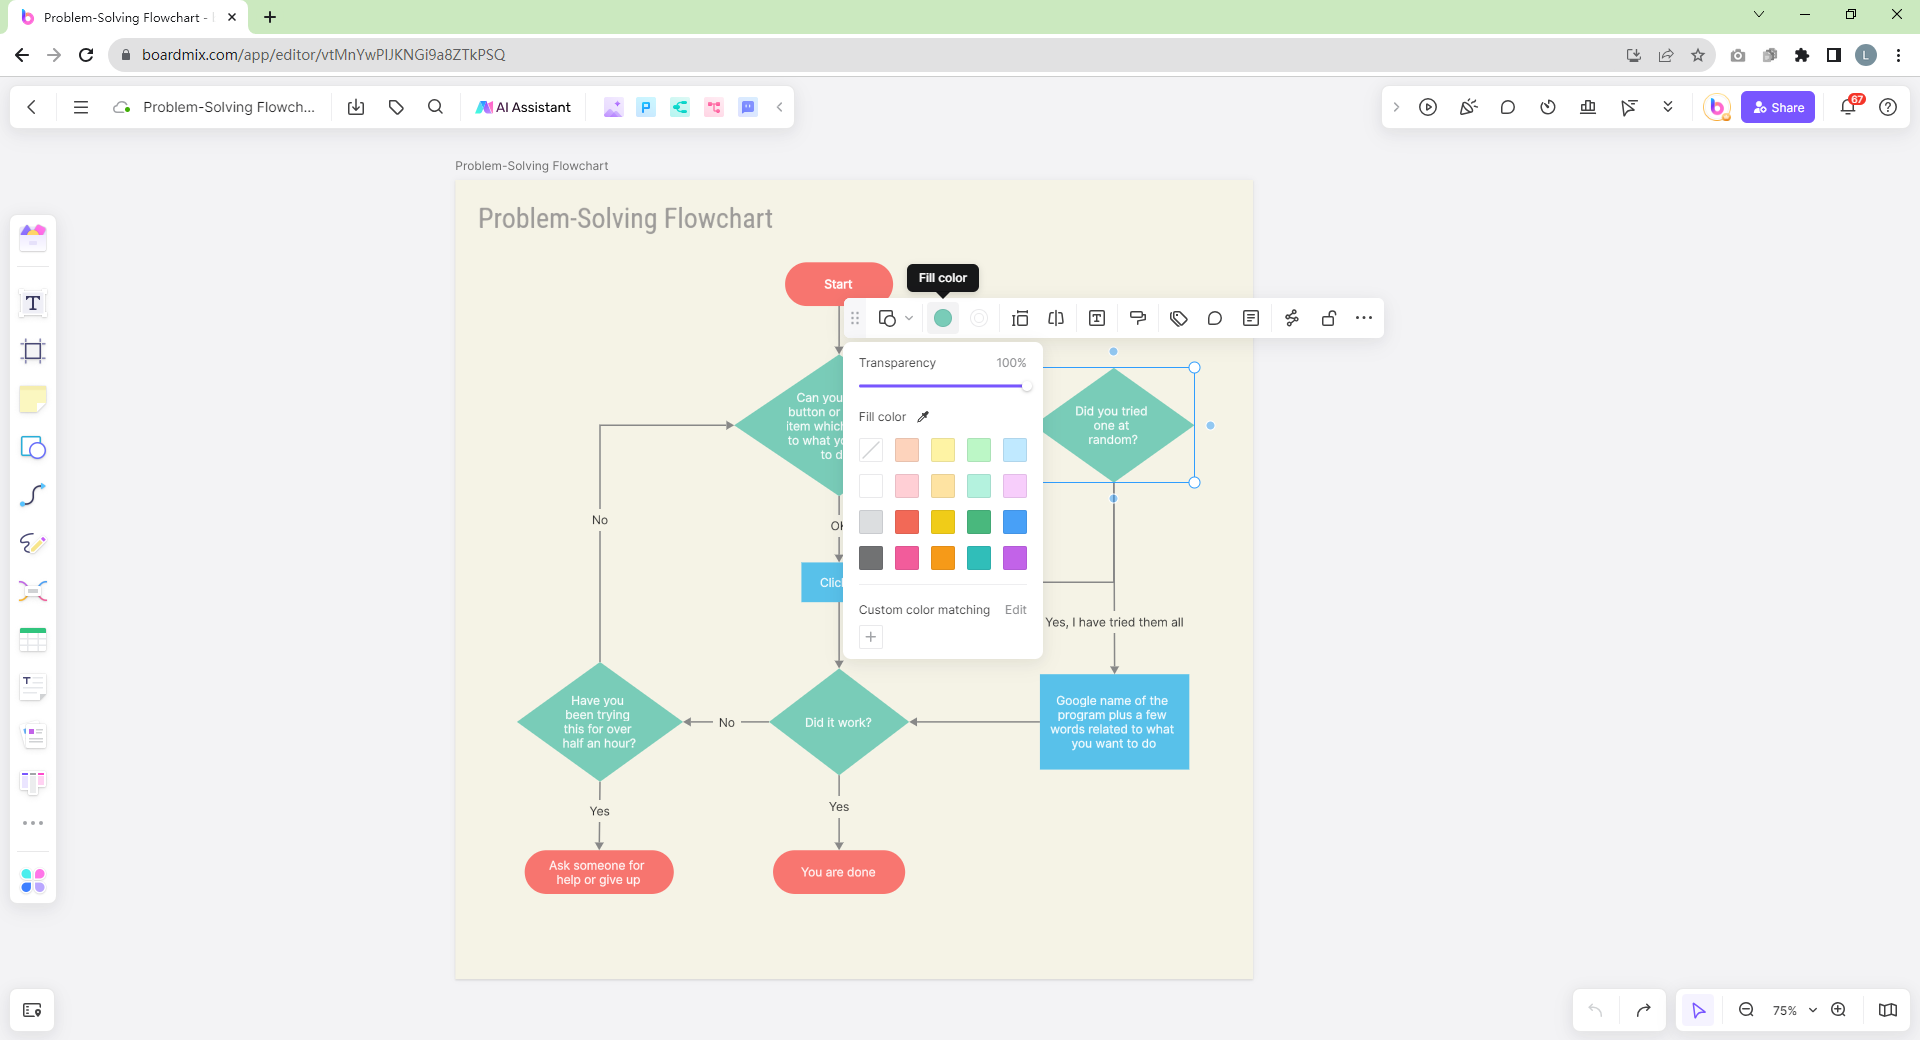
- Add connectors: Some templates come with pre-set connectors. If necessary, you can add more by choosing from the menu and simply dragging them between the shapes.
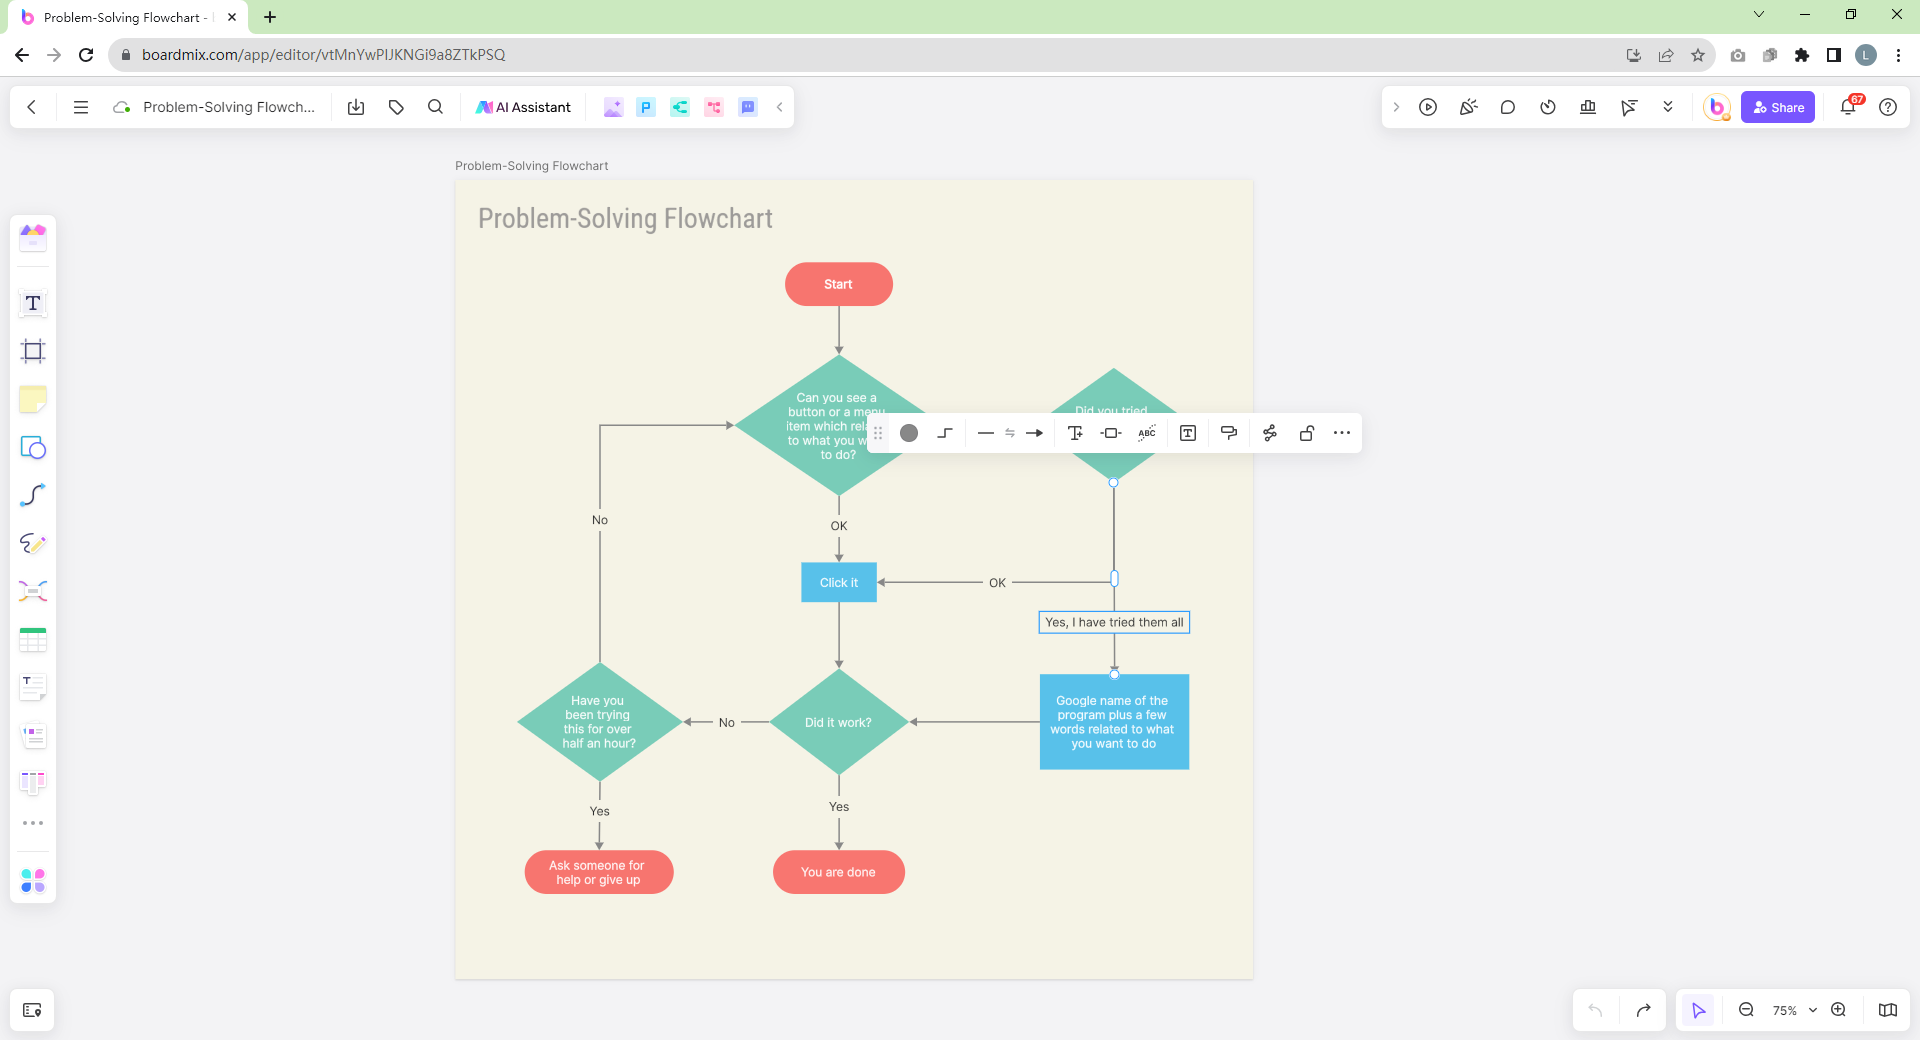
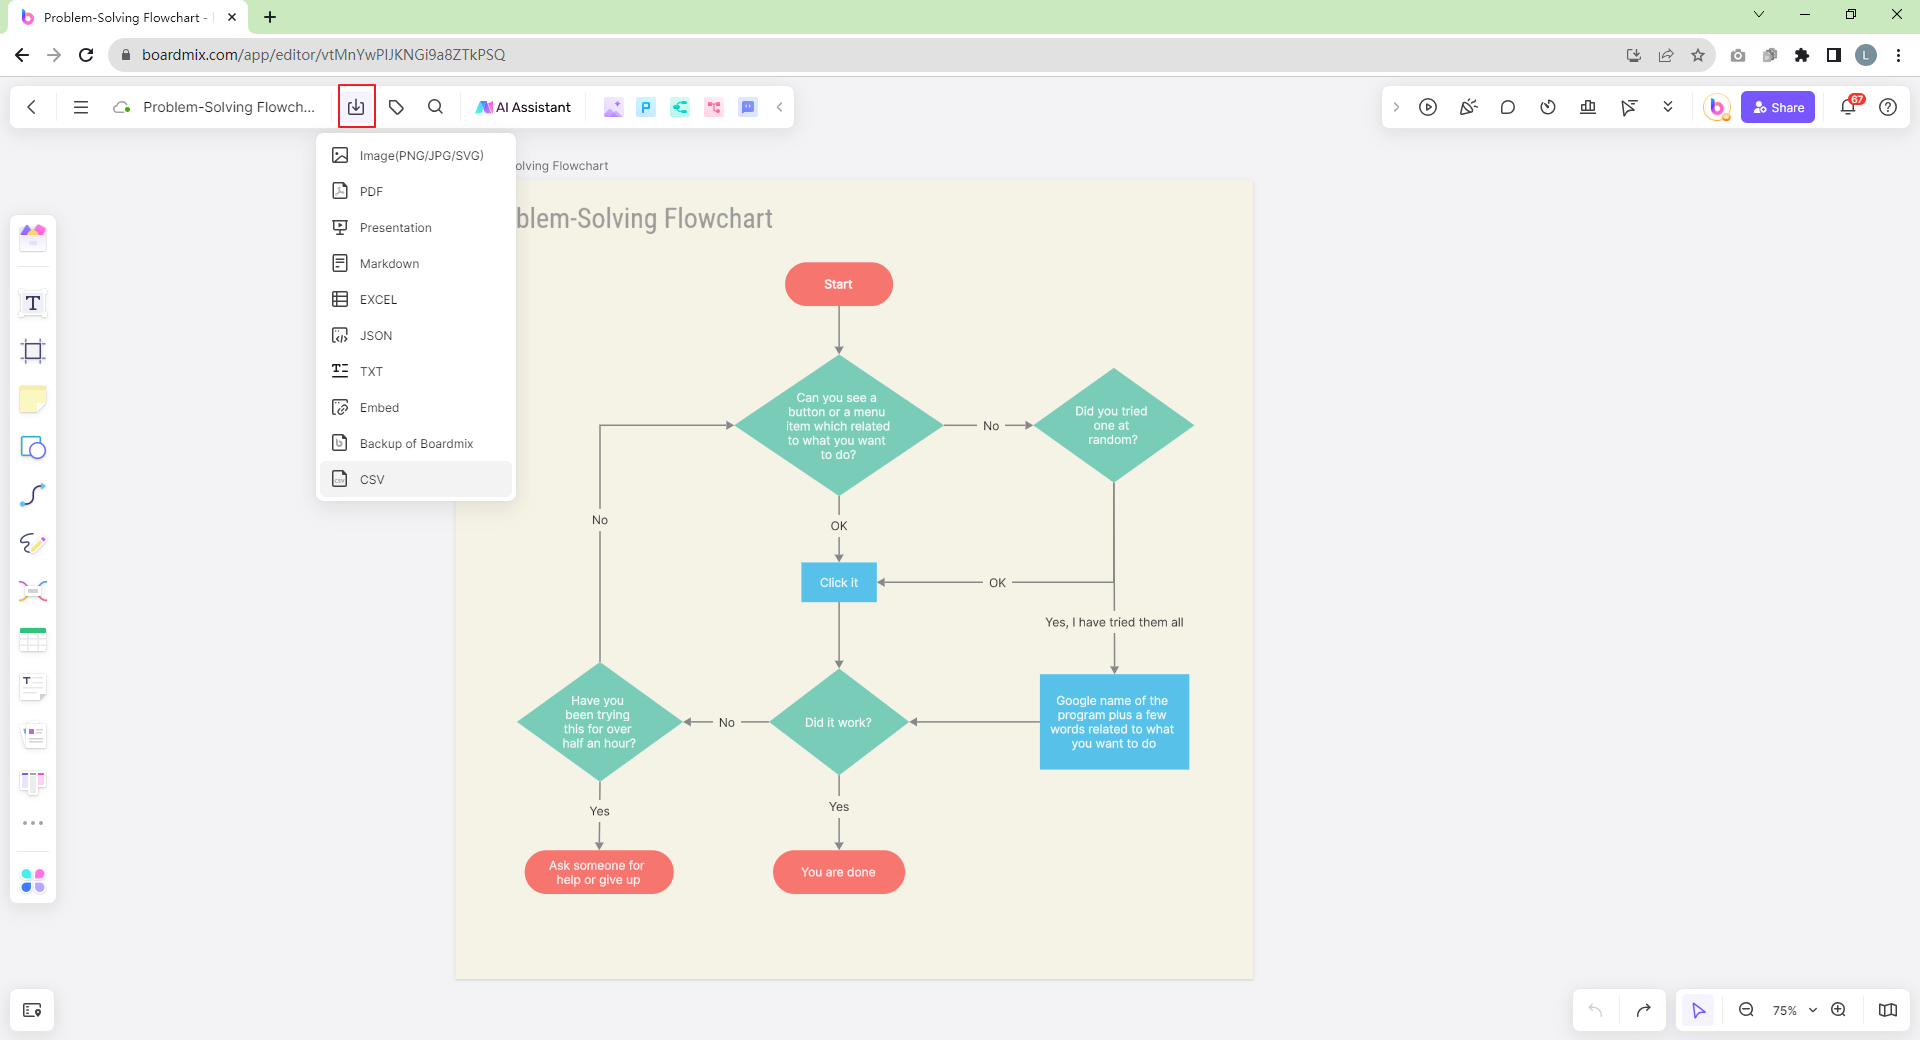
- Finalize: Once your flowchart looks as desired, save and export it in your preferred format.
Creating from Scratch or a Blank Template
For those who prefer to start with a clean slate, Boardmix offers an easy-to-use platform for creating flowcharts from scratch.
- Create a new whiteboard: Click on New flowchart or Whiteboard on the Boardmix dashboard.
- Choose your shapes: Select from a wide range of shapes and drag them onto the canvas. Boardmix offers more shapes compared to PowerPoint, allowing for a more detailed and accurate representation of your process.
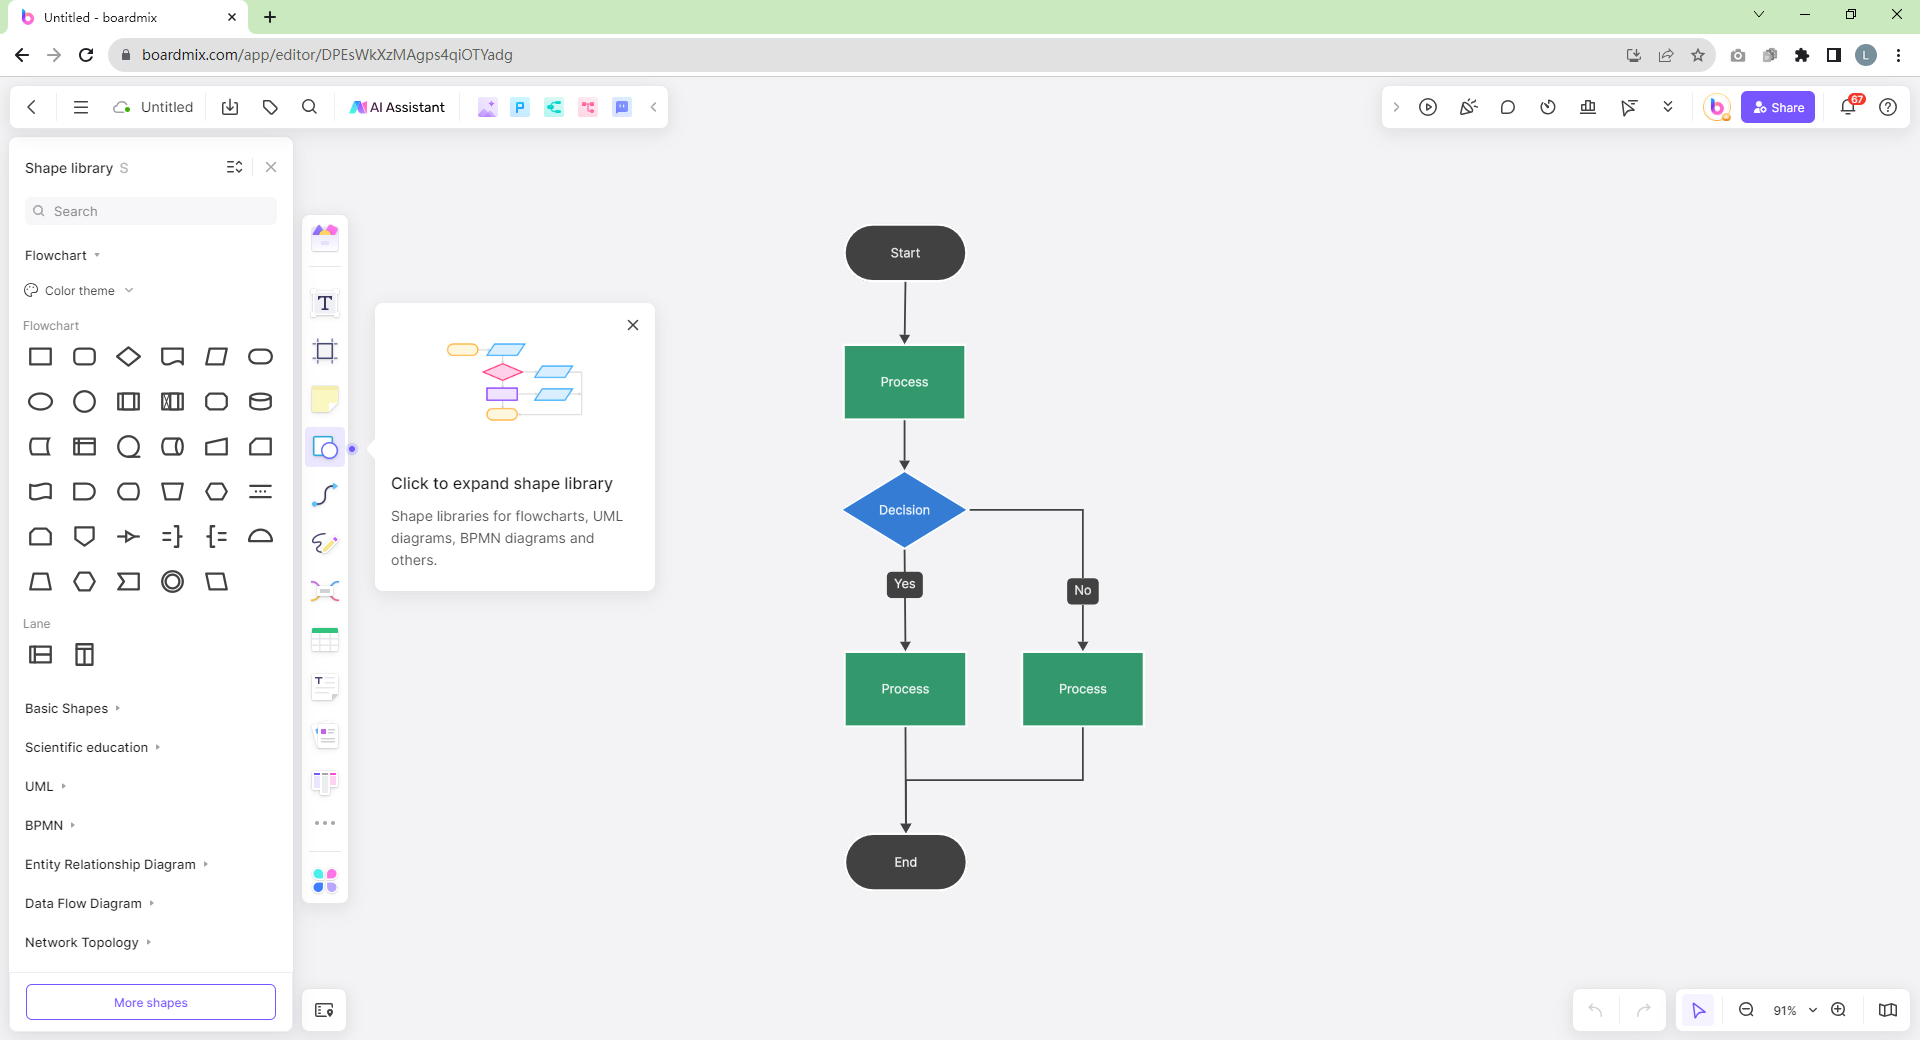
- Customize: Modify each shape's color, size, and text to fit your needs.
- Add connectors: Connect your shapes using lines or arrows. Unlike in PowerPoint, aligning and connecting shapes is more precise and easier in Boardmix.
- Add descriptions: If necessary, you can add descriptions or notes to your shapes for further clarification.
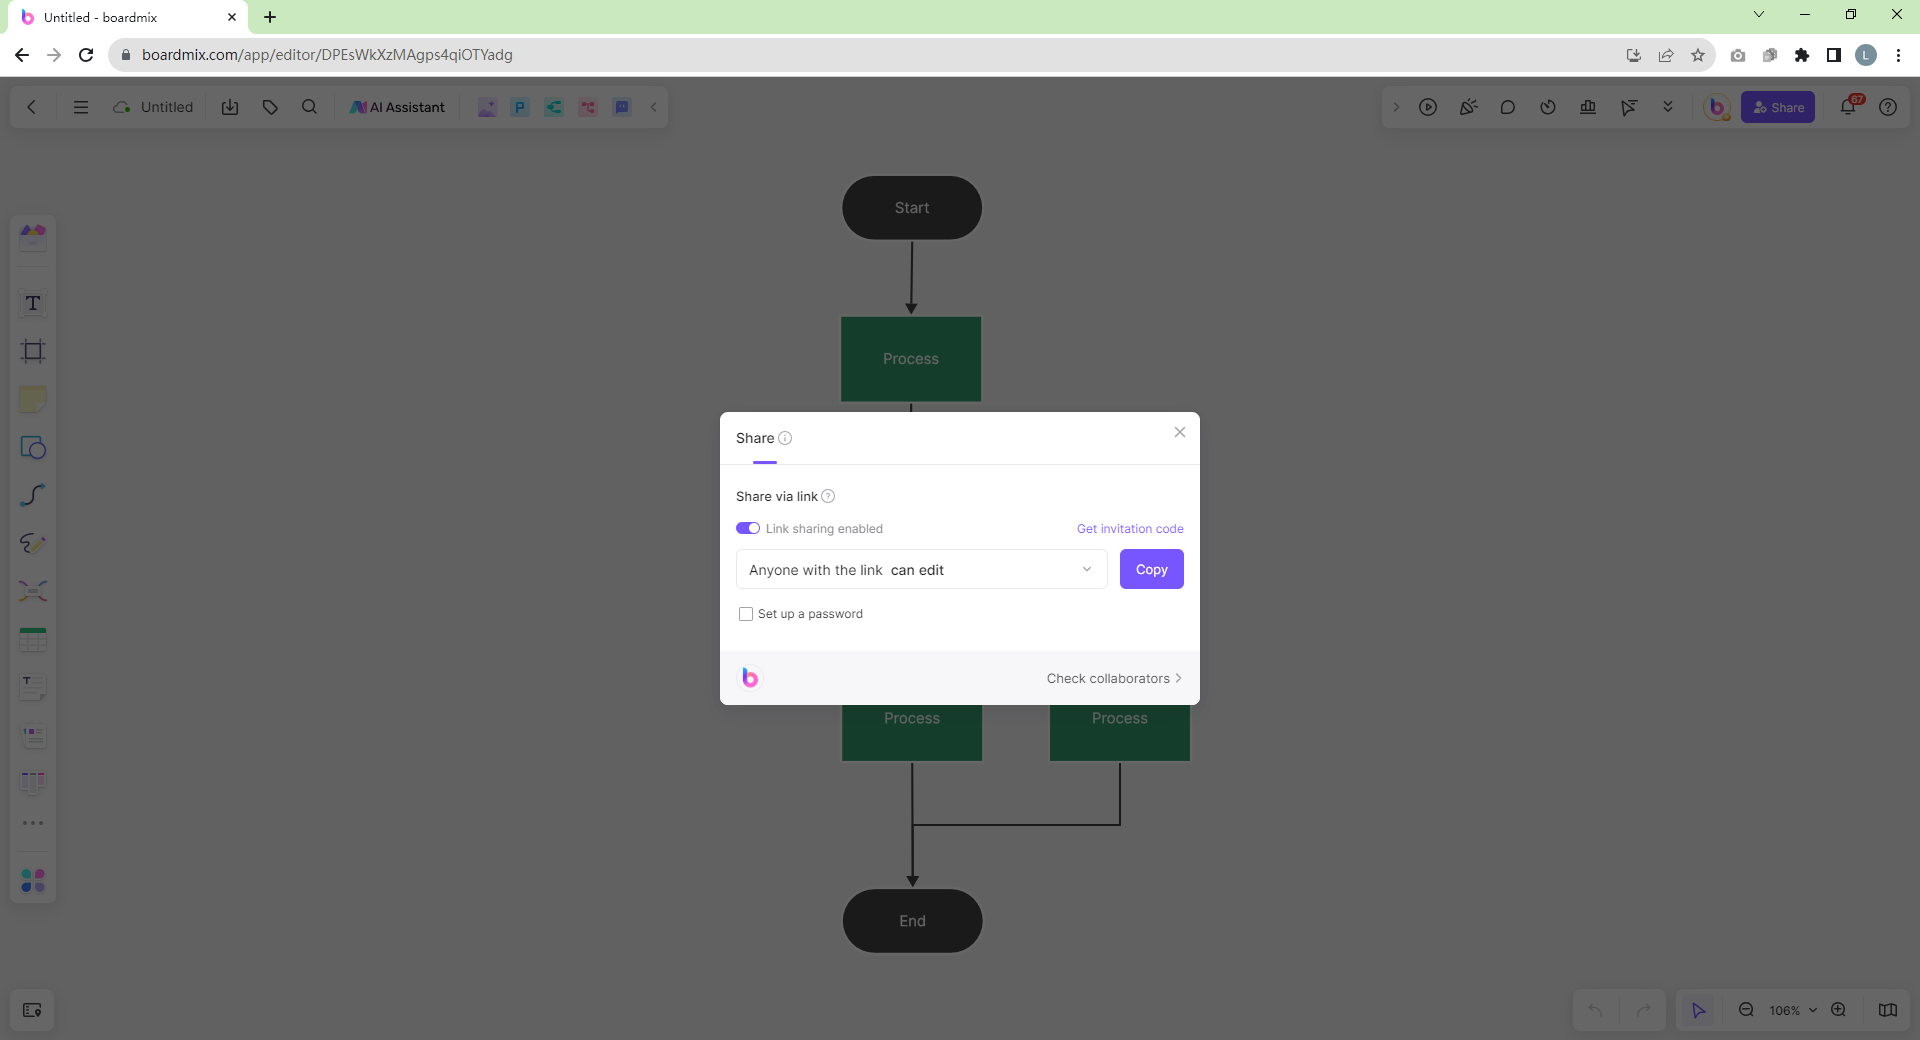
- Finalize and Share: After perfecting your flowchart, save it and share it with others via email or a generated link.
With Boardmix, making professional and complex flowcharts has never been easier. Its specialized features, ease of use, and flexibility make it an excellent choice for those who frequently work with flowcharts.
Which One is a Better Flowchart Maker: PowerPoint or Boardmix?
While PowerPoint provides basic functionalities for creating a flowchart, its limitations can be a bottleneck when it comes to creating more complex or professional-looking flowcharts. On the other hand, Boardmix is designed specifically for making diagrams and offers greater flexibility, precision, and efficiency.
Ultimately, the choice between PowerPoint and Boardmix will depend on your specific needs, preferences, and level of expertise. We hope this guide has given you a better understanding of how to create flowcharts in both tools and will help you make the right choice for your next project.


