


If your business deals with sports apparel and other accessories for athletes, it might be helpful to look into the BCG matrix of Adidas. This way, you can take inspiration from the company as you map out your matrix for your products.
Before you create the matrix, it pays to know how these Adidas products are placed in each segment and the criteria it uses to decide where to place them.
Background of Adidas
Adidas, also called Adidas AG, is a German company producing athletic apparel, shoes, and other sporting goods. During the 21st century, the company was the largest sportswear provider in Europe and the world's second-largest (after Nike). You'll know it's Adidas because of its unique three-stripe logo.
The brand grew steadily during the 1950s when football players switched to using Adidas shoes, which were known to be lightweight and have screw-in cleats. It then expanded to creating various lines of goods in 1963. Four years later, Adidas also started manufacturing apparel.
Adidas BCG Matrix Analysis
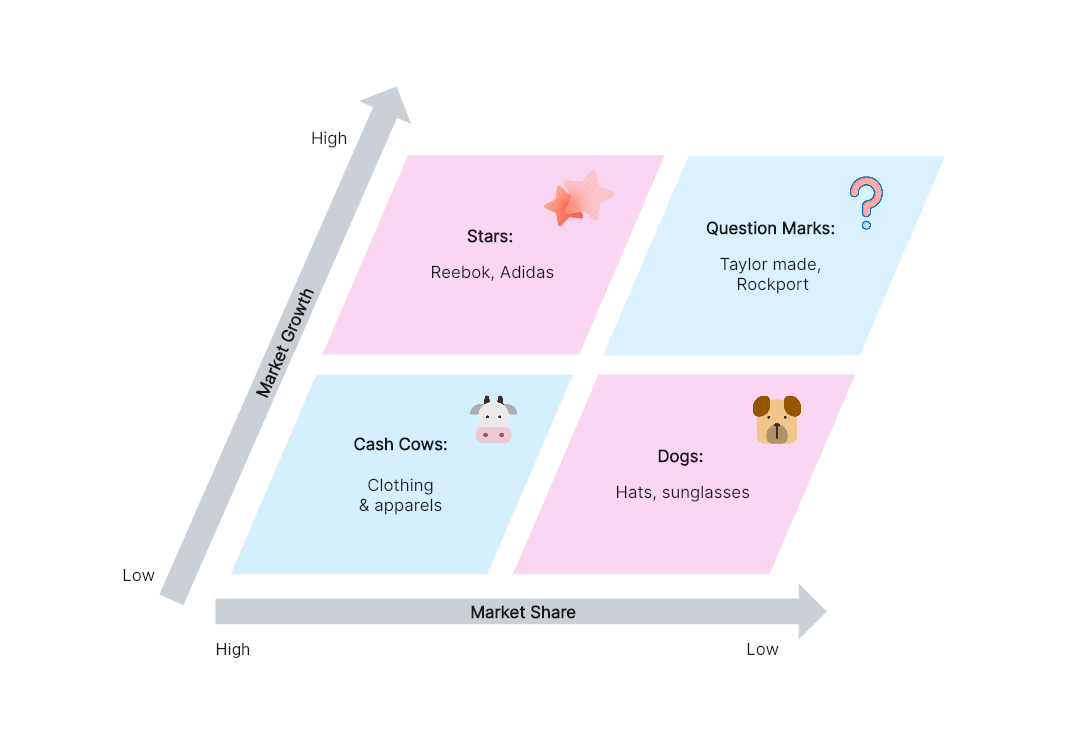
Like other matrices, the BCG matrix of Adidas also includes four significant sections: Stars, Question Marks, Cash Cows, and Dogs. See how the company groups its products using the matrix.
Stars
The goods under this BCG matrix of Adidas include those with both high market growth and market share. Most importantly, Stars have the most significant percentage of the company's profits. Since it holds a solid position in the market, only a little investment is necessary to maintain its status in the industry.
Adidas and Reebok are considered the Stars of the BCG matrix of Adidas. These two brands hold the largest market shares amid the intense competition in the sports and fitness industry. Their competitors, like Nike, are also fighting for the largest market share, which fears the Adidas Group.
Question Mark
The product in this quadrant has a low market share but has excellent market growth. If the business strategically focused on its product development, the product could increase sales and profit margins.
Taylor Made and Rockport are the Question Marks of the BCG matrix of Adidas. These two brands might have small market shares, but they also can expand further in the industry. Adidas needs to update its initiatives to transform possible gains into opportunities.
Cash Cows
There's a significant market share, but minimal market expansion is what Cash Cows is all about. This means the goods here make money through sales in the current market, but they do not have the potential for further market expansion. Clothing and apparel are the Cash Cows in the BCG matrix of Adidas. The company needs to position these products in the customers' minds by exploring geographic areas.
Dogs
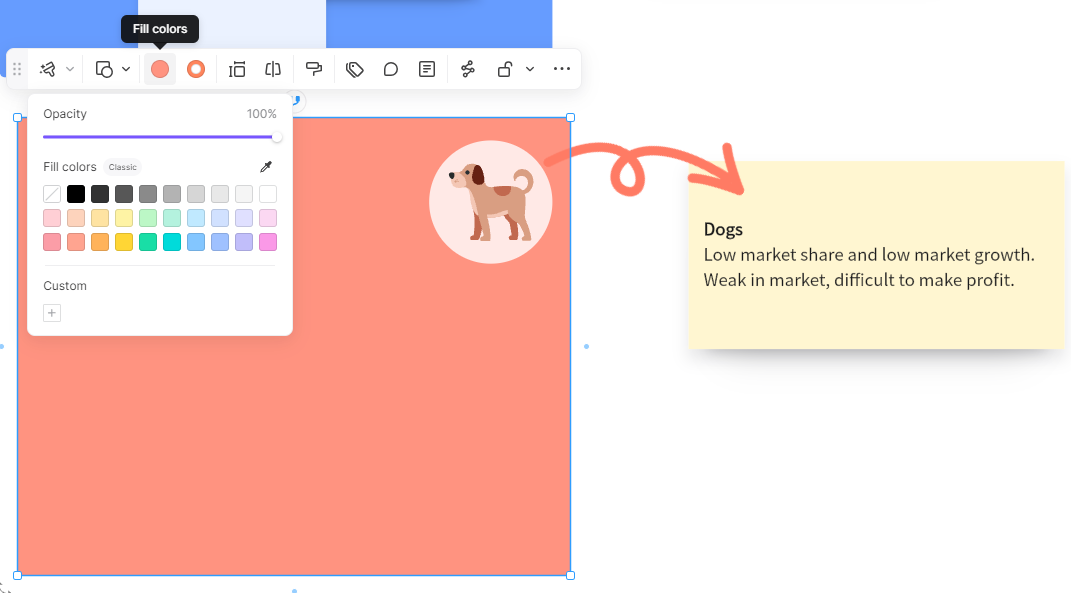
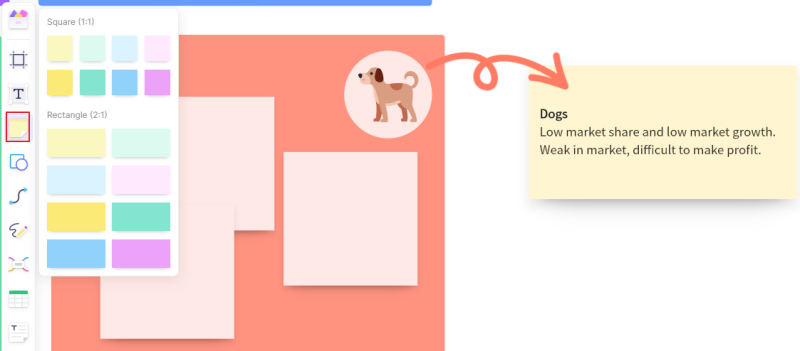
Essentially, the products considered as Dogs only operate to break even. They have a low market growth and market share. The company's sunglasses and hats are included in this quadrant. These two are among the least popular products since there are better alternatives where consumers prefer to spend their money. Despite this low turnout, Adidas still found ways to make them relevant in the market.
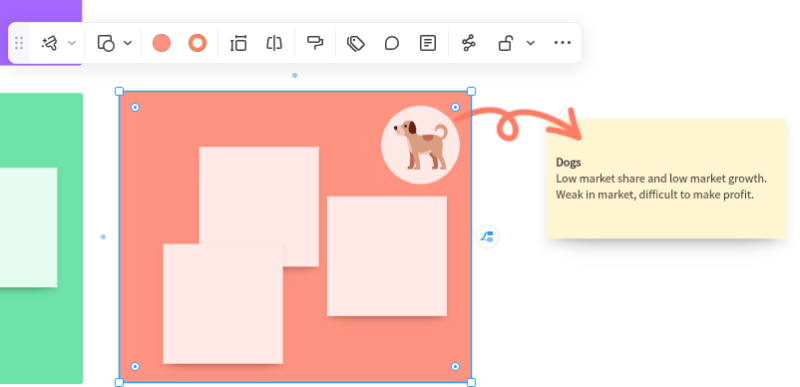
Mastering BCG Matrix Creation on Boardmix
The Boston Consulting Group (BCG) Matrix is a vital tool for strategic management, allowing you to visualize a company's product portfolio and identify growth opportunities. Here's how you can create a BCG Matrix on Boardmix.
1. Login and Create a New Board
First, log into your Boardmix account. Once logged in, click on ‘New Board'. This gives you a fresh canvas to work on.

2. Draw the BCG Matrix Grid or Use a Template
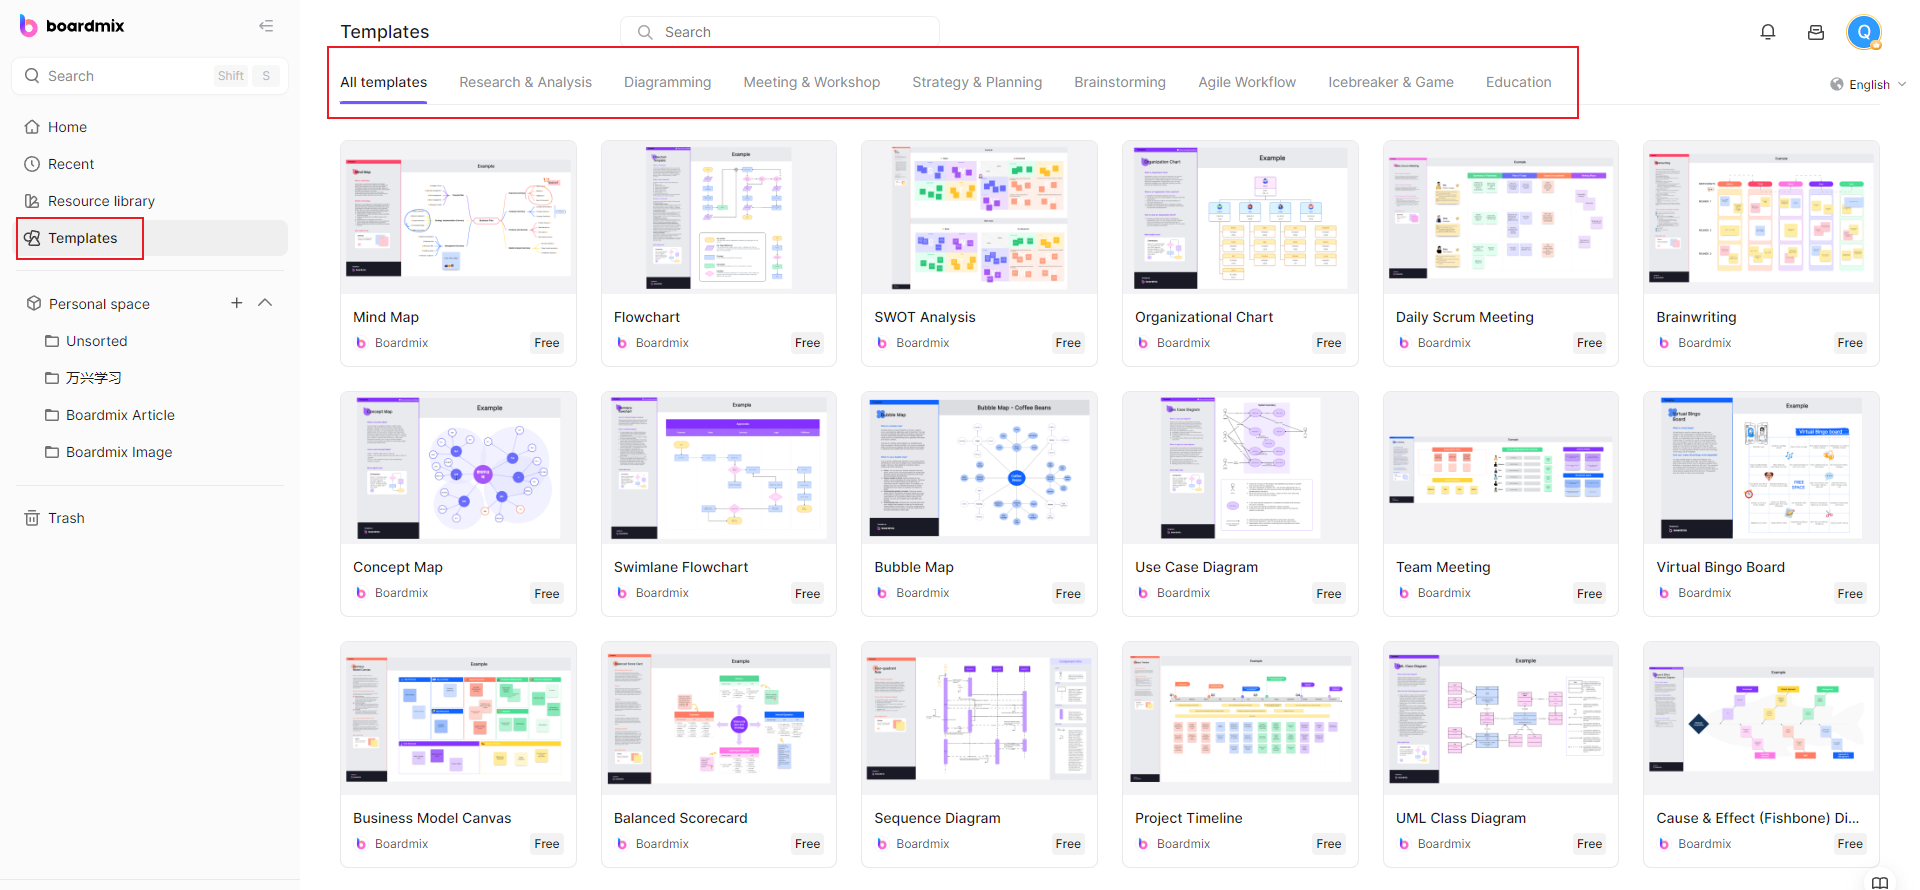
The BCG Matrix consists of a 2x2 grid. Use the ‘shape' tool in the toolbar to create this grid. You will need two perpendicular lines intersecting in the middle to form four quadrants. You can also search for the BCG Matrix template in the template library and use it for free.
3. Label the Axes
Next, label your axes. The y-axis usually represents the market growth rate, while the x-axis represents the relative market share. You can add these labels using the 'text' tool from the toolbar.
4. Add Quadrant Labels
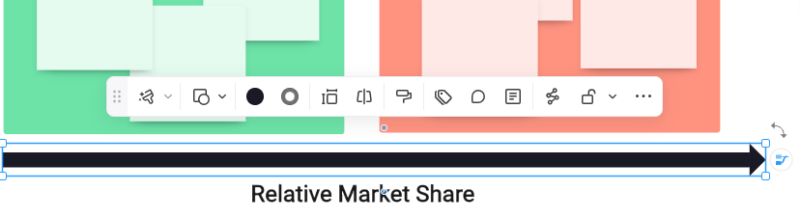
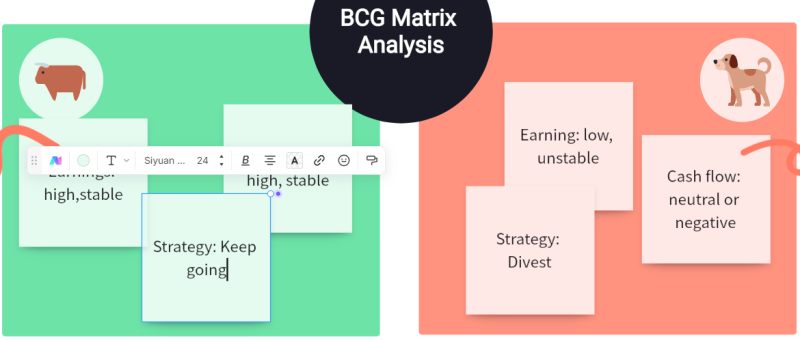
Each quadrant in the BCG Matrix represents a different product category: Cash Cows (high market share, low market growth), Dogs (low for both), Stars (high for both), and Question Marks (low market share, high market growth). Use the text tool again to add these labels.
5. Plot Products
Start plotting your products or business units in the appropriate quadrants based on their market share and growth rate. You can use different shapes or colors for each product to make them distinguishable.
6. Customize Your Diagram
Boardmix offers various customization options. Feel free to change colors, add patterns, or adjust sizes as needed to create a visually engaging BCG Matrix
7. Add Notes or Annotations
If needed, add any notes or annotations for clarification using the text tool. This can be especially helpful when sharing your BCG Matrix with others who might not be familiar with all the products or units plotted.
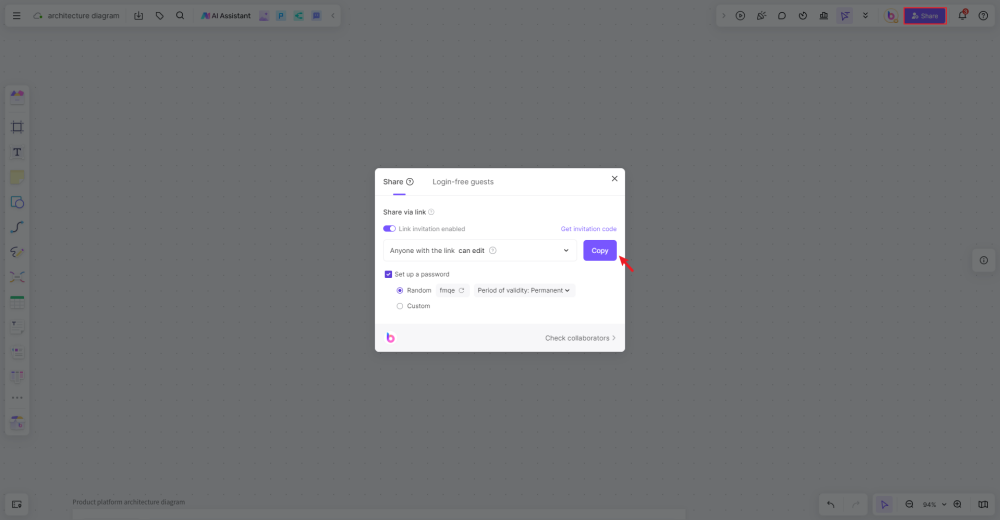
8. Save and Share Your BCG Matrix
Once you're happy with your BCG Matrix, save it on Boardmix's secure cloud storage for future reference. You can also share your diagram with colleagues or stakeholders via email or direct link.
Creating a BCG Matrix on Boardmix can significantly enhance your strategic planning process by providing a clear visualization of your product portfolio's current state and highlighting potential areas of growth or investment.
Key Takeaways
The BCG matrix of Adidas is easy to understand because of the visual illustration it provides. You can also effectively illustrate your matrix through a pre-built template from Boardmix. Since it is pre-designed, you only need to fill in the details for each segment of the matrix to finish the diagram. The online diagramming tool lets you tweak some elements on the template, like changing the colors and adding images, shapes, and arrows. It's a flexible template you can share with peers through a unique link. Check out the template here.
References
BCG Matrix of Adidas. (2018, August 15). https://bcgmatrixanalysis.com/bcg-matrix-of-adidas/
Adidas. (2023, August 4). https://www.britannica.com/topic/Adidas-AG


