


The ability to create a BCG Matrix can significantly impact strategic planning. It provides an invaluable perspective on the allocation of resources and decision-making processes within an organization. In this comprehensive guide, we provide an in-depth understanding of the BCG Matrix, a walkthrough to creating one in Excel and Boardmix, and handy tips for effective utilization.
What is a BCG Matrix?
The BCG Matrix, also known as the Boston Consulting Group Matrix, is a strategic tool for portfolio analysis and business planning. It helps companies understand their product portfolio and make informed business decisions. It's a square grid with four quadrants representing four types of strategic business units – Stars, Cash Cows, Question Marks, and Dogs.
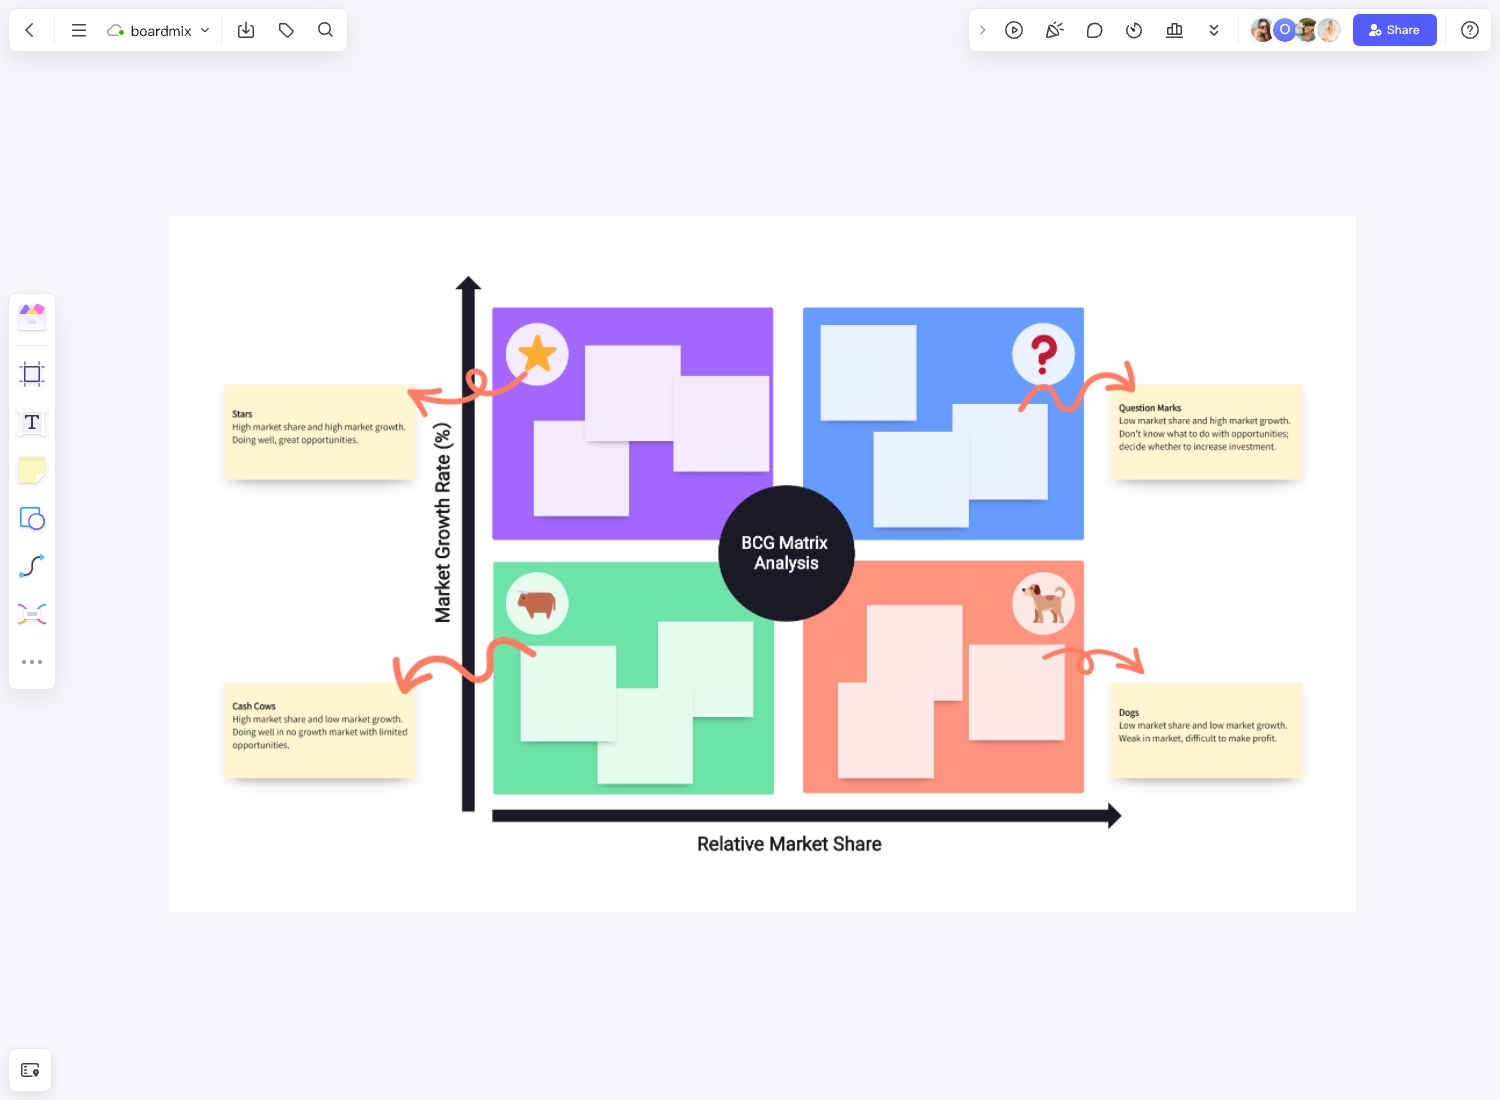
Each quadrant signifies the growth rate and market share, providing a clear picture of where each product or service stands in the market. Essentially, this allows businesses to prioritize investments and resources towards high-potential offerings.
How to Create a BCG Matrix in Excel
Creating a BCG matrix in Excel is straightforward and doesn't require any specialized skills. Follow these steps:
- Begin by opening a new Excel sheet and listing all your products or services.
- On one axis, list the growth rate of each product. On the other, list the relative market share.
- Plot each product or service on the matrix according to its growth rate and market share.
- Highlight each plotted point to differentiate between Stars, Cash Cows, Question Marks, and Dogs.
- Label each quadrant accordingly.
Supplementing this process with screenshots can make it even easier to follow along.
How to Create a BCG Matrix with Boardmix
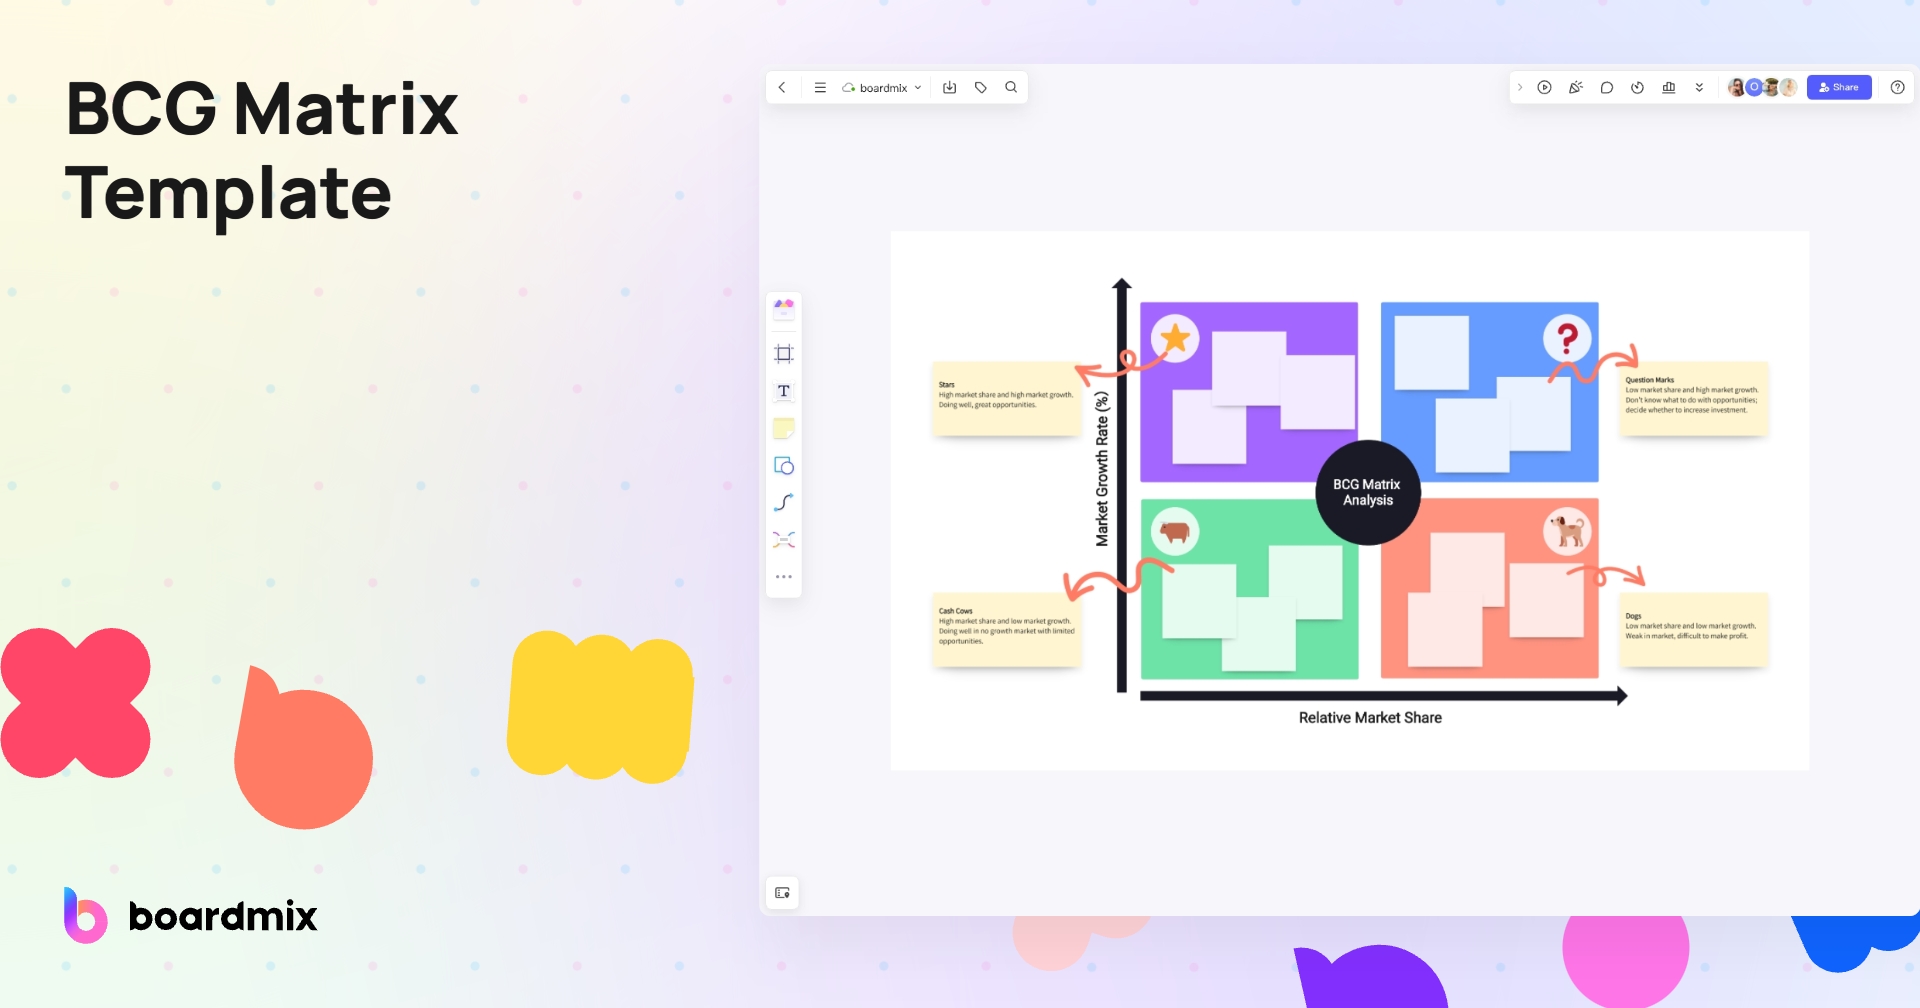
With Boardmix, creating a BCG matrix becomes an effortless task. You can either use a pre-built template or build one from scratch.
Using Pre-Built Template
Boardmix offers ready-to-use BCG matrix templates which significantly simplify the creation process.
- Access the Boardmix dashboard and click on the 'Template Gallery' option.
- Locate the BCG matrix template and select it.
- Input your product data directly into the matrix fields.
- Adjust color-coding to differentiate between each quadrant.
Creating from Scratch
If you prefer a more personalized approach, you can also create a BCG matrix from scratch.
- From your dashboard, click 'New' to open a new canvas.
- Define your X and Y axis as 'Market Growth' and 'Market Share' respectively.
- Draw four quadrants and label them as 'Stars', 'Cash Cows', 'Question Marks', and 'Dogs'.
- Now, plot your products accordingly.
Tips to Use a BCG Matrix
With a comprehensive understanding of how to create a BCG Matrix, it's time to explore ways to utilize this strategic tool effectively. Implementing the right tactics will not only augment the utility of your BCG Matrix but also enhance strategic decision-making within your organization. Here are a few tips to help you optimize the use of your BCG Matrix.
- Regularly Update Your Matrix: Market dynamics are ever-evolving. Consumer behavior, competitive landscapes, and economic conditions fluctuate and can dramatically impact your product's position in the matrix. Therefore, it's imperative to update your BCG Matrix regularly. This continual review will ensure that it accurately reflects current market conditions and your product's relative status, helping your organization make well-informed business decisions.
- Combine with Other Strategic Tools: While the BCG Matrix offers valuable insights on its own, its efficacy increases when used in conjunction with other strategic tools. For example, employing SWOT analysis can provide an in-depth look into internal and external factors affecting your business. Simultaneously, a PESTLE analysis can help you understand the broader macro-environment in which your company operates. By merging the results from these analyses with your BCG Matrix, you can formulate a robust, holistic business strategy.
- Avoid Tunnel Vision: Despite its considerable benefits, remember that the BCG Matrix is not a panacea. It's merely one tool among many others. The matrix could oversimplify reality, as it only takes into account market share and growth rate while disregarding other essential factors like profitability, competition intensity, or market segmentation. Hence, avoid using it as the sole determinant for business decisions. Strive for a balanced perspective that accounts for multiple factors affecting your products or services.
- Diversify Your Portfolio: By clearly highlighting where your products stand in terms of market share and growth rate, the BCG matrix provides a unique opportunity to diversify your product portfolio. Ensure that you have products in all quadrants – stars, cash cows, question marks, and dogs. Each offers distinct advantages and combines to create a balanced portfolio.
- Take Advantage of Your Cash Cows: Cash cows are low-growth but high-market-share products that generate significant revenue with minimal investment. Profits derived from these products can be used to fund potential stars (high-growth, high-market-share products) or question marks (high-growth, low-market-share products).
- Consider Reallocation of Resources: The BCG matrix gives an excellent visualization of where resources are currently deployed and where they could potentially be better utilized. For example, if a product is identified as a 'dog' (low-growth, low-market-share), it might be an indication that resources allocated to that product might be better utilized elsewhere.
In conclusion, the BCG Matrix is an invaluable tool that provides clarity in strategic planning. By using either Excel or Boardmix, you can easily create and update your BCG matrix. So don't hesitate – embark on this journey of strategic decision-making with our guide.


