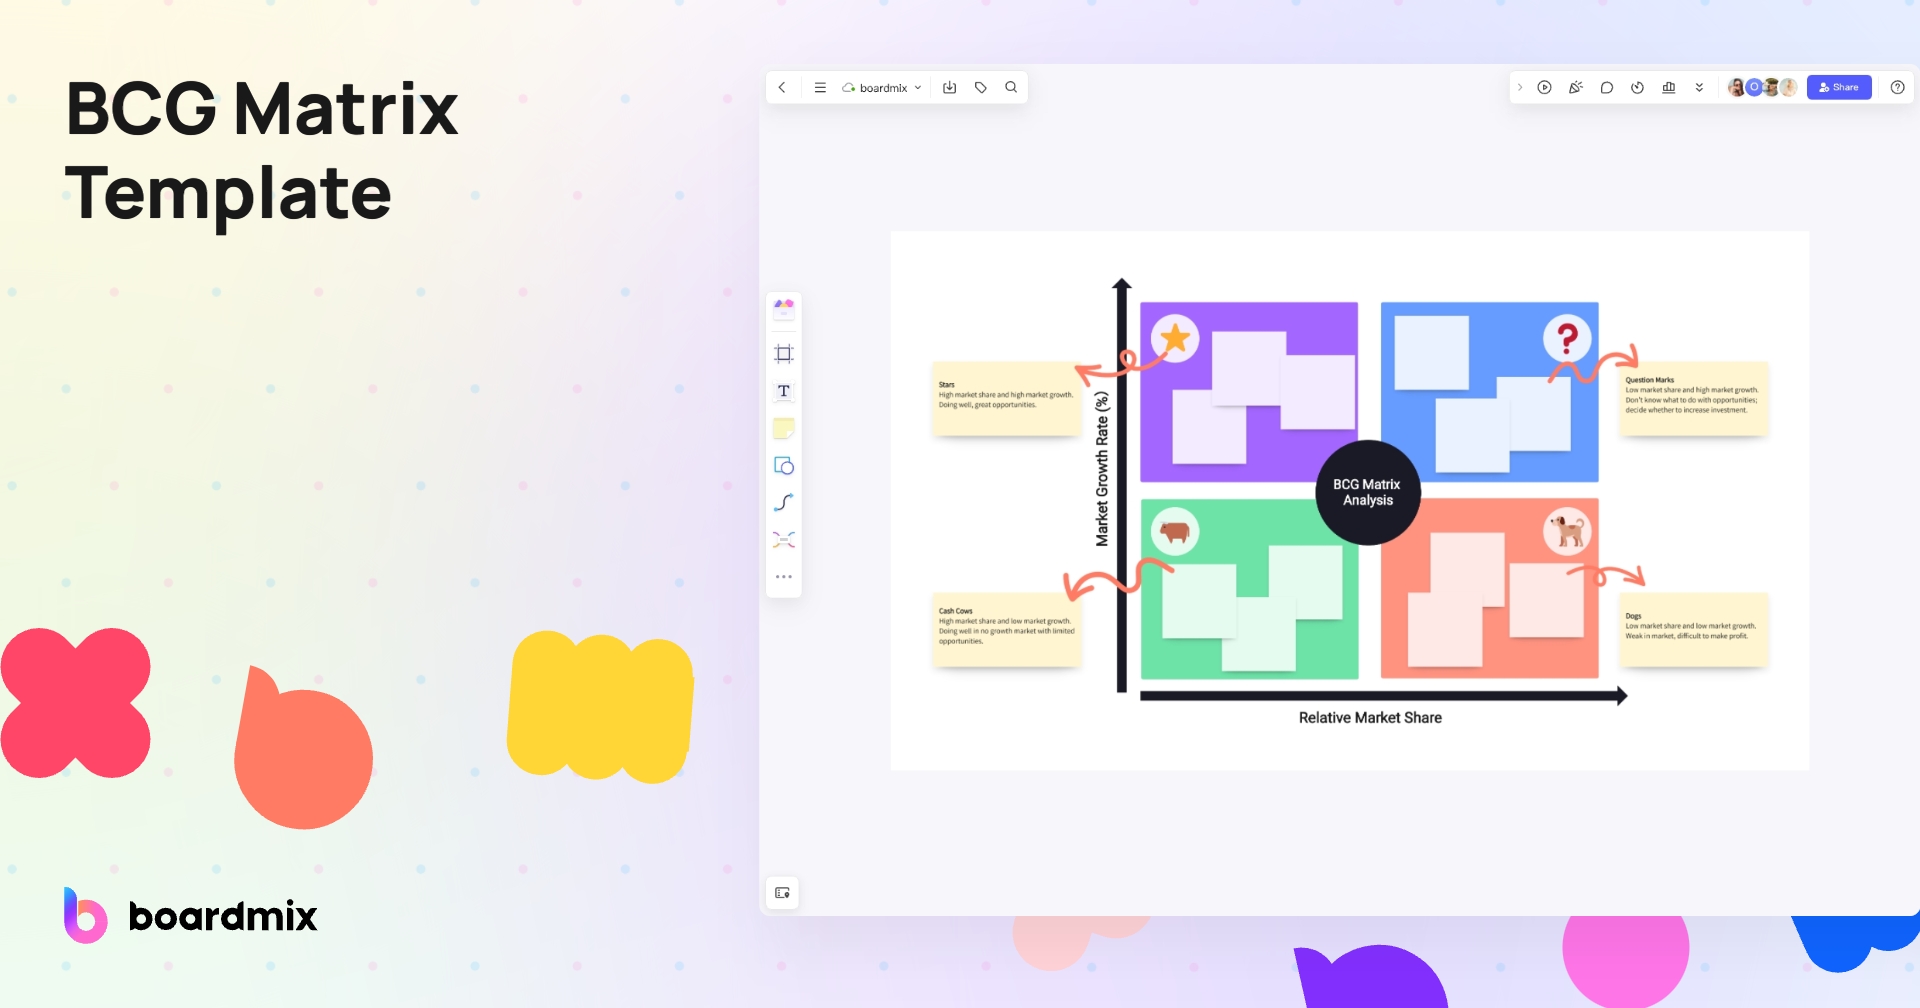
About the BCG Matrix Template
Explanation of BCG Matrix
The BCG matrix is also commonly called the product portfolio matrix. It is a popular business tool used for brand portfolio evaluation, particularly its market standing. The matrix consists of a 2x2 structure for classifying the products. Its primary defining factors are market growth rate and market share.
Significance in Business Strategy
With proper implementation, the BCG matrix reveals plenty of useful information that businesses can use to make decisions regarding their products and services. Through the matrix, a business can easily see which products need to be kept in the portfolio because they are generating considerable revenue. On the opposite corner, the matrix reveals products that are not meeting target market growth or market share and thus would be more viable for the company to sell to avoid taking more losses.
Brief History of BCG Matrix Development
The BGC matrix template has had many versions over the years, but it was first used during the 1970s. It was created by the founder of BGC or Boston Consulting Group, by the name of Bruce Henderson. The company developed the first BCG matrix template to evaluate the potential and strategic position of its brand portfolio.
What is the BCG matrix structure?
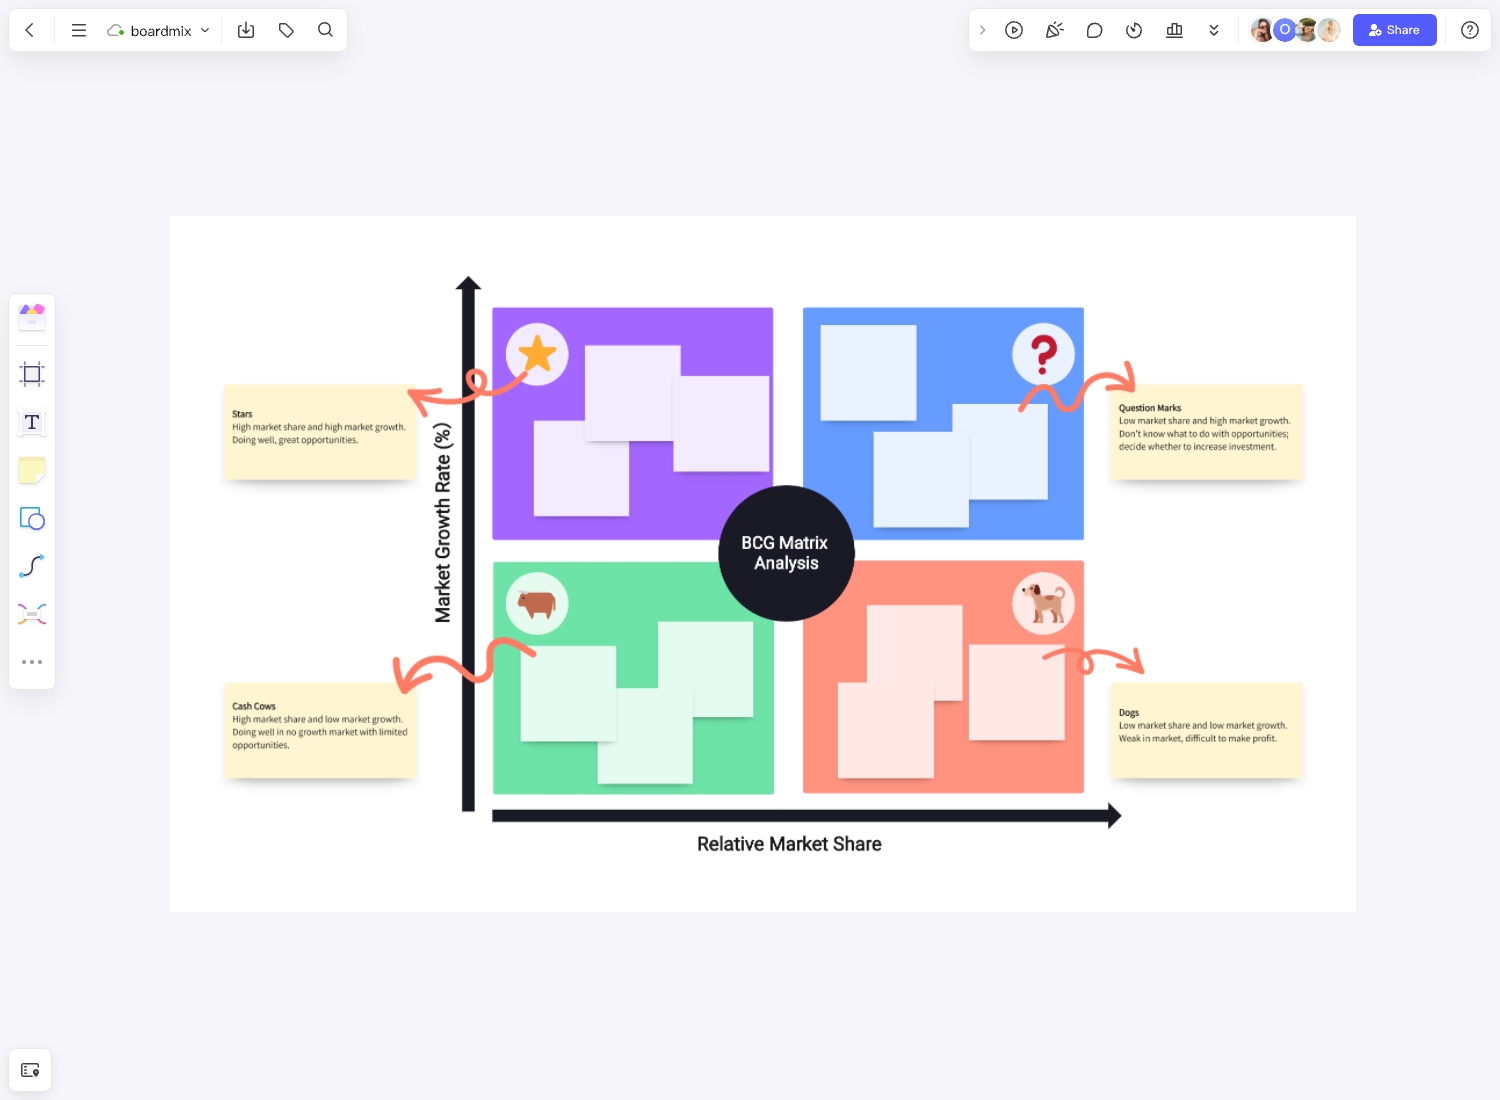
The BCG Matrix is a strategic planning tool that uses a two-dimensional matrix to classify a company's products or business units into four different categories.
Here's the basic structure:
-
Horizontal Axis: This represents the relative market share of each product or business unit. It's a measure of your product's strength in the market compared to your competitors. The further to the right on this axis, the higher your market share.
-
Vertical Axis: This represents the market growth rate of each product or business unit. It's an indication of how fast the market for each of your products is growing. The higher up on this axis, the faster the market growth.
-
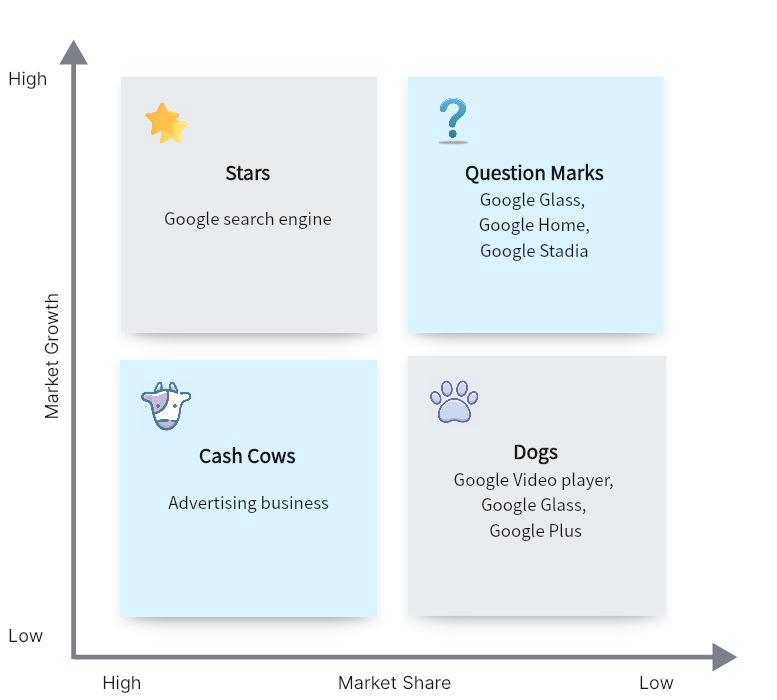
Quadrants: The matrix is divided into four quadrants, each representing a different type of product:
- Stars (top right): High market share, high market growth rate.
- Question Marks (top left): Low market share, high market growth rate.
- Cash Cows (bottom right): High market share, low market growth rate.
- Dogs (bottom left): Low market share, low market growth rate.
Each quadrant requires a different strategic approach and has implications for where you should invest, divest or develop further. By plotting your products or business units on this matrix, you can get a clear picture of your portfolio's current state and make informed decisions about where to focus your efforts and resources.
What are the 4 quadrants of the BCG matrix?
The four quadrants of the BCG Matrix represent different types of products in a company's portfolio.
They are:
-
Stars: These are products that have a high market share in high-growth industries. Stars are often the leaders in their market and generate more revenue than they consume. However, they also require substantial investment to sustain their growth.
-
Question Marks: Also known as "problem children," these products have a low market share in high-growth industries. They have growth potential but also pose a risk due to their low market share. These products require careful consideration as to whether increased investment will result in them becoming Stars or if they will remain as Question Marks.
-
Cash Cows: These are products with a high market share in low-growth industries. Cash Cows require little investment and generate more cash than they consume. They often provide the financial foundation of a company, allowing it to invest in other areas.
-
Dogs: Dogs have a low market share in low-growth industries. They neither generate substantial cash nor require substantial investment. While they may generate enough cash to sustain themselves, Dogs do not hold much growth potential.
Examples of BCG Matrix in Business
Case Study of Apple Inc.’s BCG Matrix
Try the Template for Free
Explanation of Product Portfolio
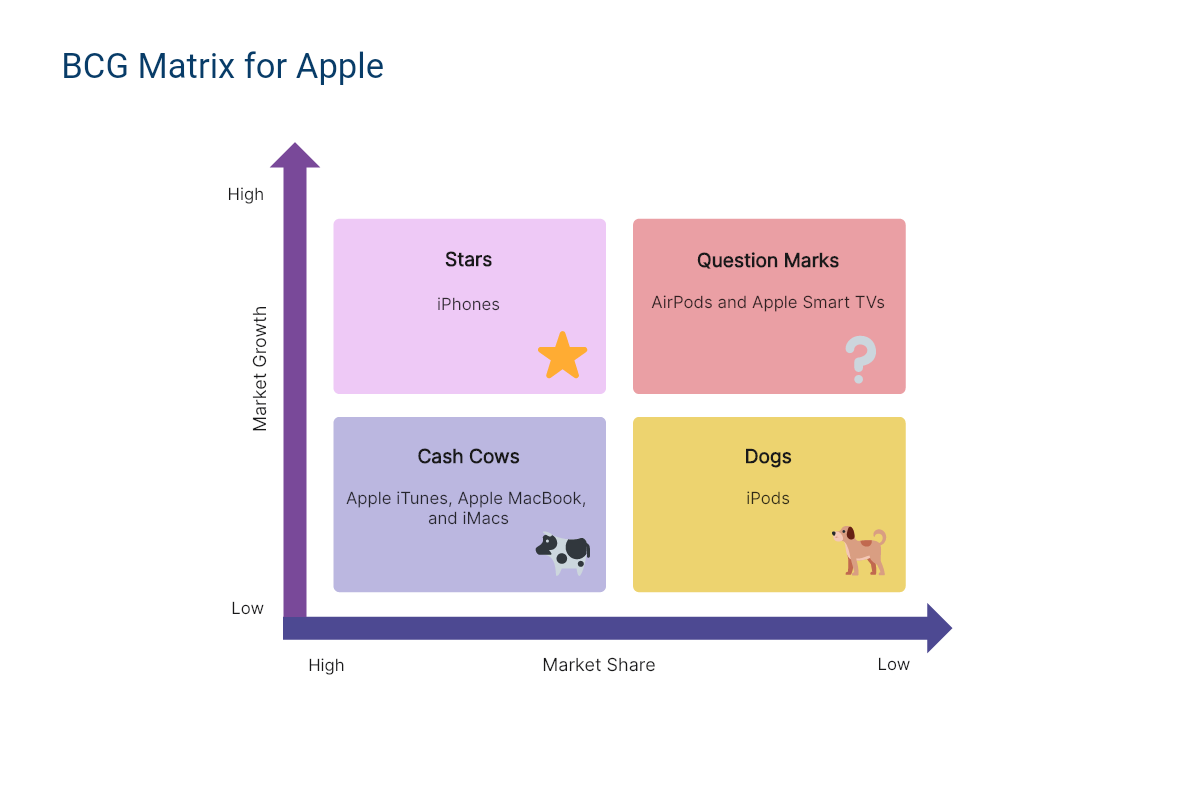
Apple Inc. is one of the world’s biggest consumer electronics manufacturers. It has a vast product portfolio but is best known for the iPhone and the iPad. It also offers a range of software applications and online services.
Positioning of Products in the Matrix
With the diverse product portfolio of Apple Inc., each of the quadrants in the matrix has been easily filled. The biggest question mark right now is the Apple TV, while the stars are the iPhones, without a doubt. The MacBook, iMacs, and Apple iTunes all comfortably sit in the Cash Cow area, while the iPods are decidedly in the Dog quadrant.
Analysis of Each Quadrant
Apple TV is a Question Mark because it is in a fast-growing market but is currently lagging behind many other stronger players in the market. With some adjustments, this product can eventually be a Star, joining the iPhone that has been dominating the Star quadrant for years. Every time the company launches a new iPhone, consumers clamor to get their hands on one, indicating a very strong hold of the market.
In the Cash Cow quadrant, the MacBook and Apple iTunes have been generating a steady stream of revenue for the company for years. These products are considered top brands in their respective markets, and there is no sign that the trend is going to change anytime soon.
Finally, the sole occupant of the Dog quadrant is the iPods. It failed to meet expectations in terms of market growth as competitors took a firm hold of the market.
Case Study of Unilever’s BCG Matrix
Try the Template for Free
Explanation of Product Portfolio
When it comes to consumer goods, Unilever is the third biggest player in the world, closely trailing Procter & Gamble and Nestle. Unilever has over 400 active brands, which are sold to more than 190 countries. Unilever’s best-selling products are soaps and other items in the personal care industry.
Positioning of Products in the Matrix
Unilever's laundry soap Wheel and bath soap Lifebuoy are the company's Question Marks. The market for these products has a high growth rate but has a low market share. The stars of the company are Lux body soap, the skin cream Fair & Lovely, the powder drink Energile, and the Heartbrand ice creams. Sitting in the cash cow quadrant are its long-time brands Surf Excel, Blue Band, Knorr, and Lipton. Finally, the shampoo brand Clear and the fabric conditioner Comfort are the dogs in the Unilever BCG matrix.
Analysis of Each Quadrant
To maintain its #3 rank in the consumer goods industry, Unilever must position its question marks so that they will eventually turn into stars. The market share of the products in the stars category is growing continuously each year, and they also generate increasingly high revenue. Unilever's trademark personal care products are the main revenue generators, supplying funds to the other quadrants. As for the products in the dog quadrant, there has been no significant growth in market share so there is no certainty that production will continue.
Who is BCG Matrix Template for?
The BCG Matrix Template is designed for a wide range of users, primarily those involved in strategic planning and decision-making within a business. Here's a more detailed look at who can benefit from this tool:
-
Business Owners and Entrepreneurs: If you own a business or are planning to start one, the BCG Matrix Template can help you evaluate your product portfolio, identify growth opportunities, and make informed decisions about where to invest resources.
-
Product Managers: Product managers can use the BCG Matrix to assess the performance of their products in terms of market share and growth potential. This can guide them in prioritizing product development efforts and allocating resources effectively.
-
Marketing Professionals: For marketers, the BCG Matrix is a valuable tool for understanding the competitive position of their products and identifying marketing strategies that can maximize profitability.
-
Strategic Planners: Those involved in strategic planning can use the BCG Matrix Template to gain insights into the business's current situation and prospects. It helps in formulating strategies that align with the company's goals and market dynamics.
-
Consultants: Business consultants can use the BCG Matrix to provide clients with a clear, objective analysis of their product portfolio, helping them make strategic decisions that drive growth and profitability.
-
Investors: Investors can also use the BCG Matrix to evaluate a company's product portfolio, which can inform investment decisions.
How to Use BoardMix's BCG Matrix Template
The BCG Matrix, developed by the Boston Consulting Group, is a strategic planning tool that businesses use to evaluate their product portfolio and make informed decisions. BoardMix's BCG Matrix Template is an easy-to-use tool that simplifies this process. Let's delve into how you can use it effectively.

Firstly, you need to understand the four quadrants of the BCG Matrix: Stars, Question Marks, Cash Cows, and Dogs. Each represents a different type of product in your portfolio. Stars are high-growth, high-market-share products; Question Marks are high-growth, low-market-share products; Cash Cows are low-growth, high-market-share products; and Dogs are low-growth, low-market-share products.
To start using BoardMix’s BCG Matrix template, log into your BoardMix account and select the template from the template library. If you don’t have an account yet, create one—it’s free and only takes a few minutes.
Once you've opened the template, start by listing all your products or business units. Then evaluate each based on its market growth rate and relative market share. This will help you place each product in one of the four quadrants.
Remember to be objective in your evaluation—don't let personal biases affect your analysis. Use reliable data to make your decisions. This might involve some research but it will ensure your matrix accurately reflects your business reality.
The next step is to analyze the position of each product in the matrix. This will give you insights into which products need investment (Stars and Question Marks), which ones provide steady cash flow (Cash Cows), and which ones might need to be discontinued or reevaluated (Dogs).
Finally, use these insights to inform your strategic decisions. You might decide to invest more in Stars, divest from Dogs, or convert Question Marks into Stars.
How do I create a BCG matrix?
Creating a BCG matrix involves several steps, but it's relatively straightforward. Here's how you can create one:
-
List Your Products or Business Units: Start by identifying all the products or business units that you want to evaluate.
-
Determine Market Growth Rate: For each product or business unit, determine the market growth rate. This is usually expressed as a percentage and represents how fast the market for each product is growing.
-
Determine Relative Market Share: Next, calculate the relative market share for each product. This is a measure of your product's strength in the market compared to your competitors.
-
Plot Your Products on the Matrix: Now that you have this information, you can plot each product on the matrix. The vertical axis represents the market growth rate, and the horizontal axis represents the relative market share.
-
Assign Each Product to a Quadrant: Based on where they fall on the matrix, assign each product to one of the four quadrants: Stars (high growth, high share), Question Marks (high growth, low share), Cash Cows (low growth, high share), or Dogs (low growth, low share).
-
Analyze and Make Decisions: Use your completed BCG Matrix to analyze your product portfolio and inform strategic decisions about where to invest resources.
Advantages of Using BCG Matrix in Business
Strategic Planning
A BCG matrix template is an invaluable tool in long-term strategic planning. It aids in the identification of new opportunities for growth and investment by pinpointing which products deliver the best market performance.
Resource Allocation
With the results displayed by the BCG matrix model, you can allocate more resources to the products that deliver high return on investment, and avoid wasting resources on those that fail to show any growth in the market.
Risk Management
There are times when a company spends too much effort and resources on products that turn out to be unprofitable in the long run. You can avoid this risk by analyzing the BCG matrix template and directing your focus on the products that do well for your business.
Identification of Growth Opportunities
Ever since it was created, the BCG matrix has been a crucial tool that companies use to identify growth opportunities. The matrix gives you a bird’s eye view of your product portfolio, making it easy to identify the areas with the biggest growth potential.
Limitations of BCG Matrix in Business
Limited Scope
The BCG matrix only takes into account a product’s market share and its growth rate. These are vital factors but they are not the only ones that determine whether a product should be continued or not.
Simplistic Approach
Although it has been used for years, the BCG matrix template is considered by many as too simplistic for accurate categorization of products, especially when it comes to very small market shares. For such cases, alternate methods would be more effective.
Dependence on Market Growth and Market Share
The basic structure of the BCG matrix template is entirely dependent on market share and market growth. If there is not much movement in both these aspects, yet other factors are continually affecting overall product performance, this model might not result in accurate results.
Poor Market Forecast
The BCG matrix relies on present market trends. To some point, you can use this to predict future market scenarios. However since this model disregards other potentially critical factors, there could be times that it could result in a poor market forecast.