If you're new to using a perceptual map template, here are some questions worth considering. Do you understand customers ' perceptions and sentiments when offering your product or service? Is it deemed a necessity or a luxury to them? Do they perceive it as superior to alternatives available from your competitors?
It's not easy to guess what your customers think or feel just by guessing. However, it is very important to get a pulse of your customers' perceptions, as these will be crucial in planning your subsequent business strategies, especially for sales and marketing. That is why you must learn how to use a perceptual map template.
What is a perceptual map?

A perceptual map is a chart that gives a clear visual image of what customers think of your products or services compared to those of competing brands. Perceptual mapping can be done in a few different ways, but the most basic type of map has two axes where the competing brands are plotted accordingly. This diagram lets you easily see where you stand amongst other similar products or services in the market.
Generating a perceptual map with accurate data for plotting competing brands is straightforward. To simplify the process further, it's advisable to utilize a perceptual map template, such as the one available at Boardmix. This tool streamlines the process and enhances your mapping efficiency.
Benefits of using a perceptual map template
Aside from simply seeing your brand's position in the market, there are a few other benefits that you can gain by using a perceptual map template.
Uncover market gaps
A perceptual map can easily show you gaps in the market where a new product might be created to fulfill the unmet needs of your clients.
Evaluate marketing campaigns
The placement of your brand on the perceptual map, especially when compared to maps created at an earlier time frame, can reveal the effectiveness of a recent marketing campaign. It can also give you valuable insight into creating more strategic business plans for future campaigns.
Improve your brand
Now that you know how customers perceive your products and services, you can make the necessary changes to elevate their perception even more, like adding more features or changing how you market your brand.
Perceptual Map Examples in Marketing
Let’s now have a look at several perceptual map marketing examples in this part.
Car Brands Perceptual Map
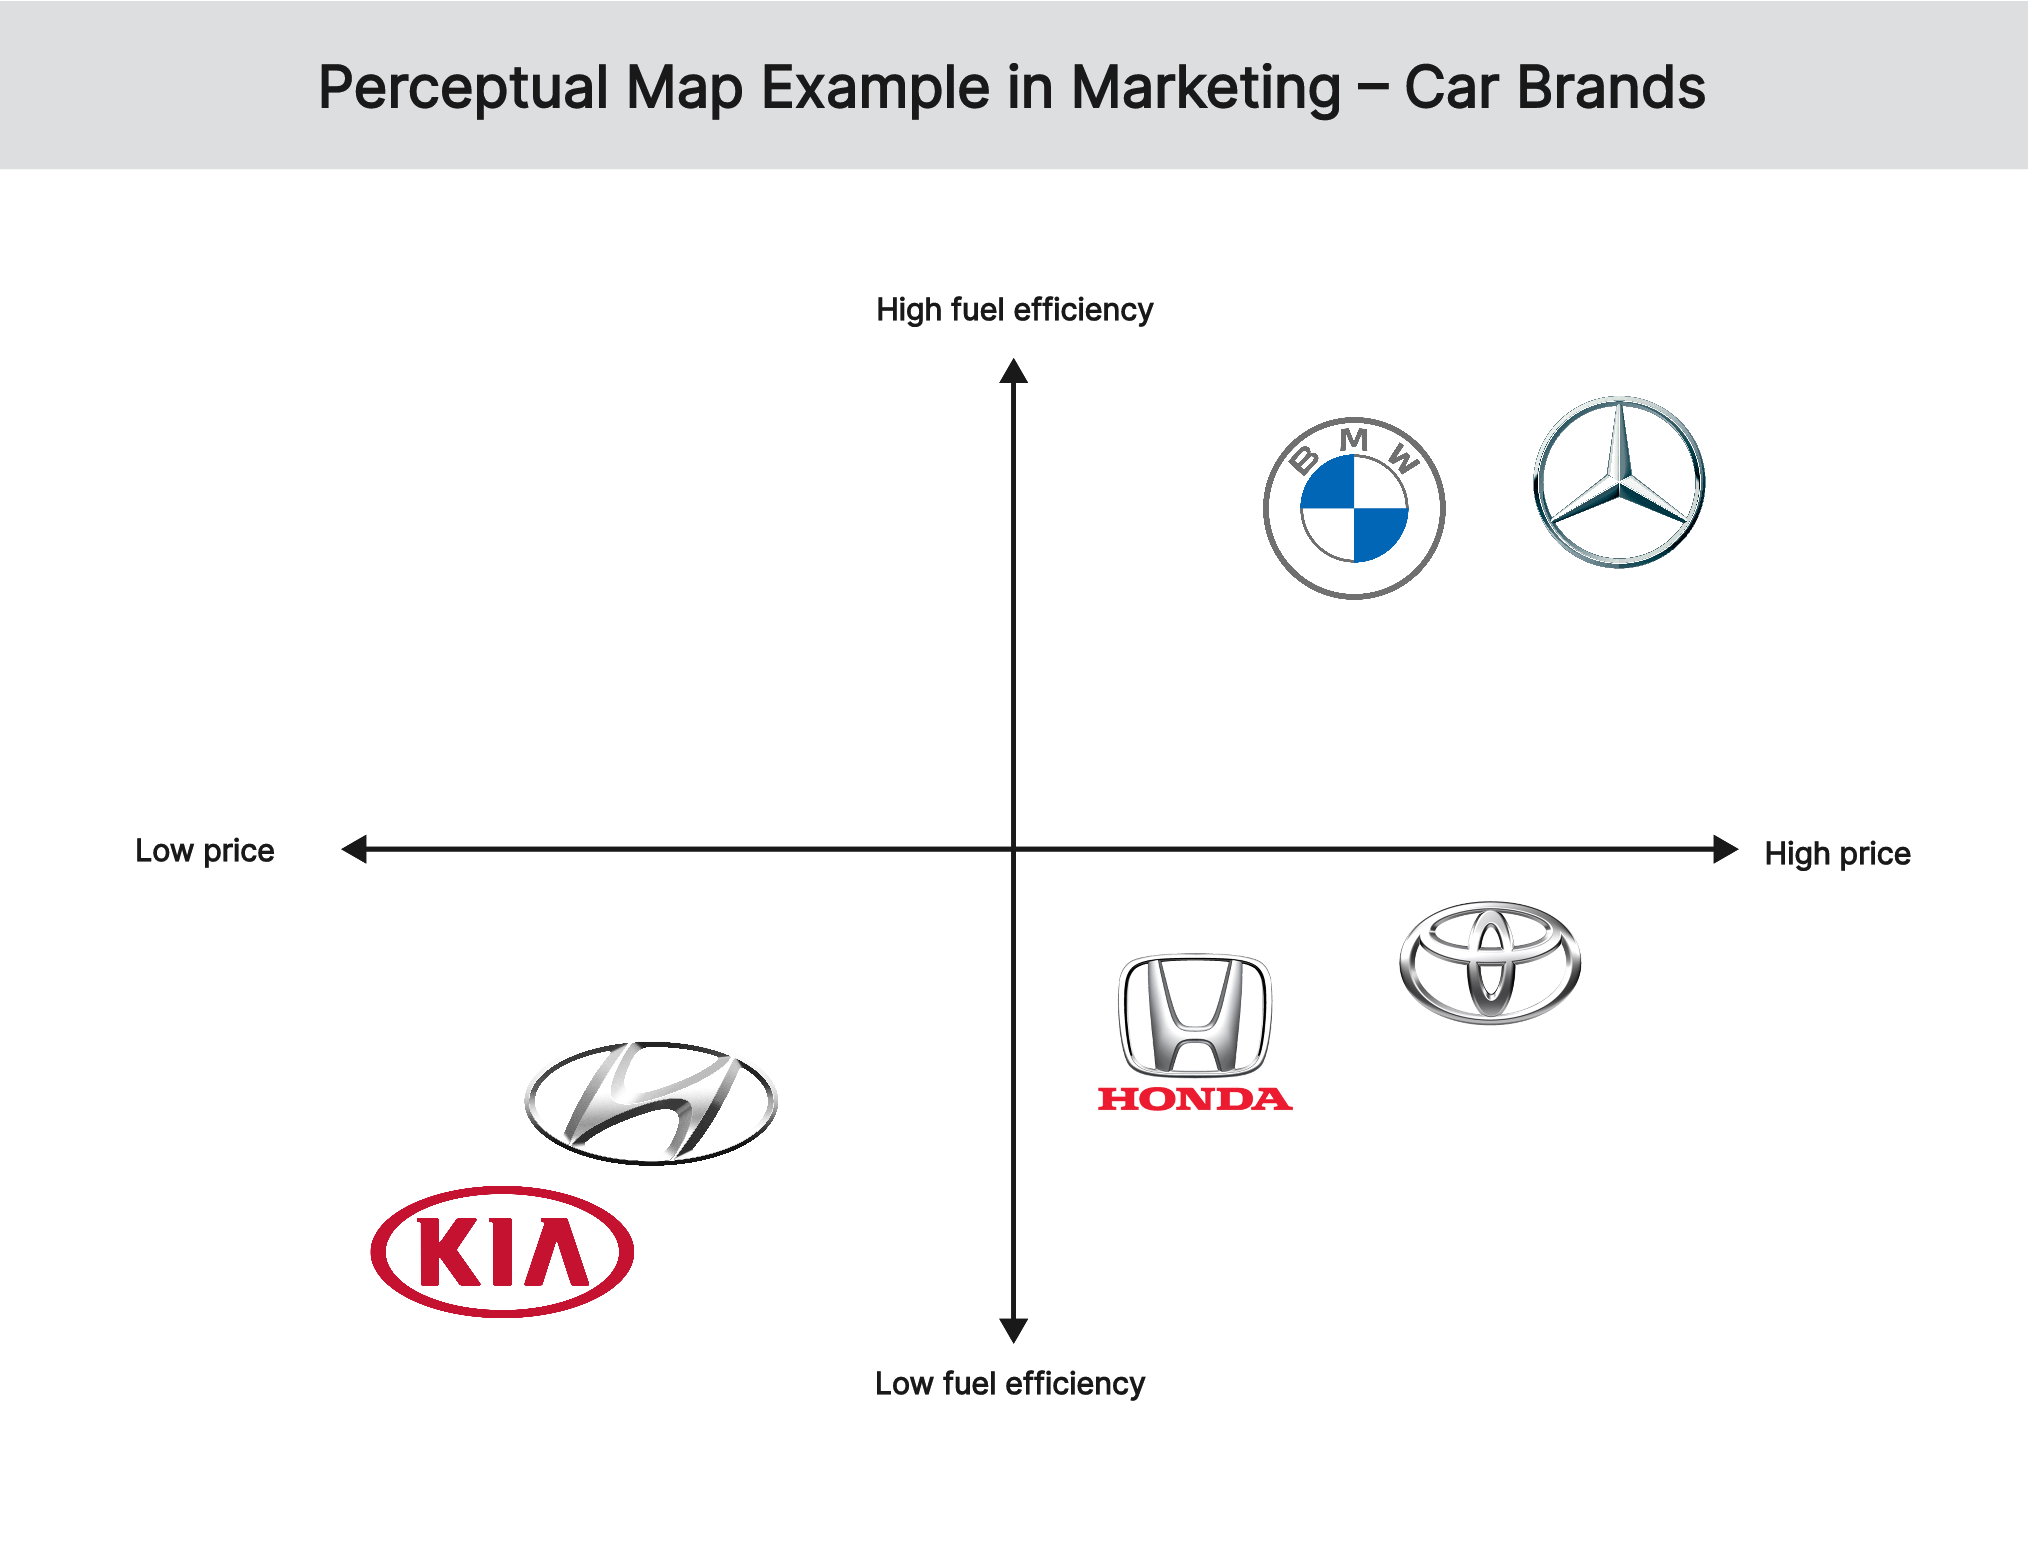
Let’s consider a perception map that shows the positioning of different car brands based on their price and fuel efficiency. In this perceptual map, luxury car brands, such as BMW and Mercedes-Benz are positioned at the top. Most customers perceive such luxury brands as having high prices and high fuel efficiency. On the other hand, budget car brands like Hyundai and Kia are positioned at the bottom of the perceptual map. Customers perceive these to have low prices and low fuel efficiency. For mid-range car brands like Honda and Toyota, are positioned in the middle to align with the perception of moderate prices and fuel efficiency.
Smartphone Brands Perceptual Map
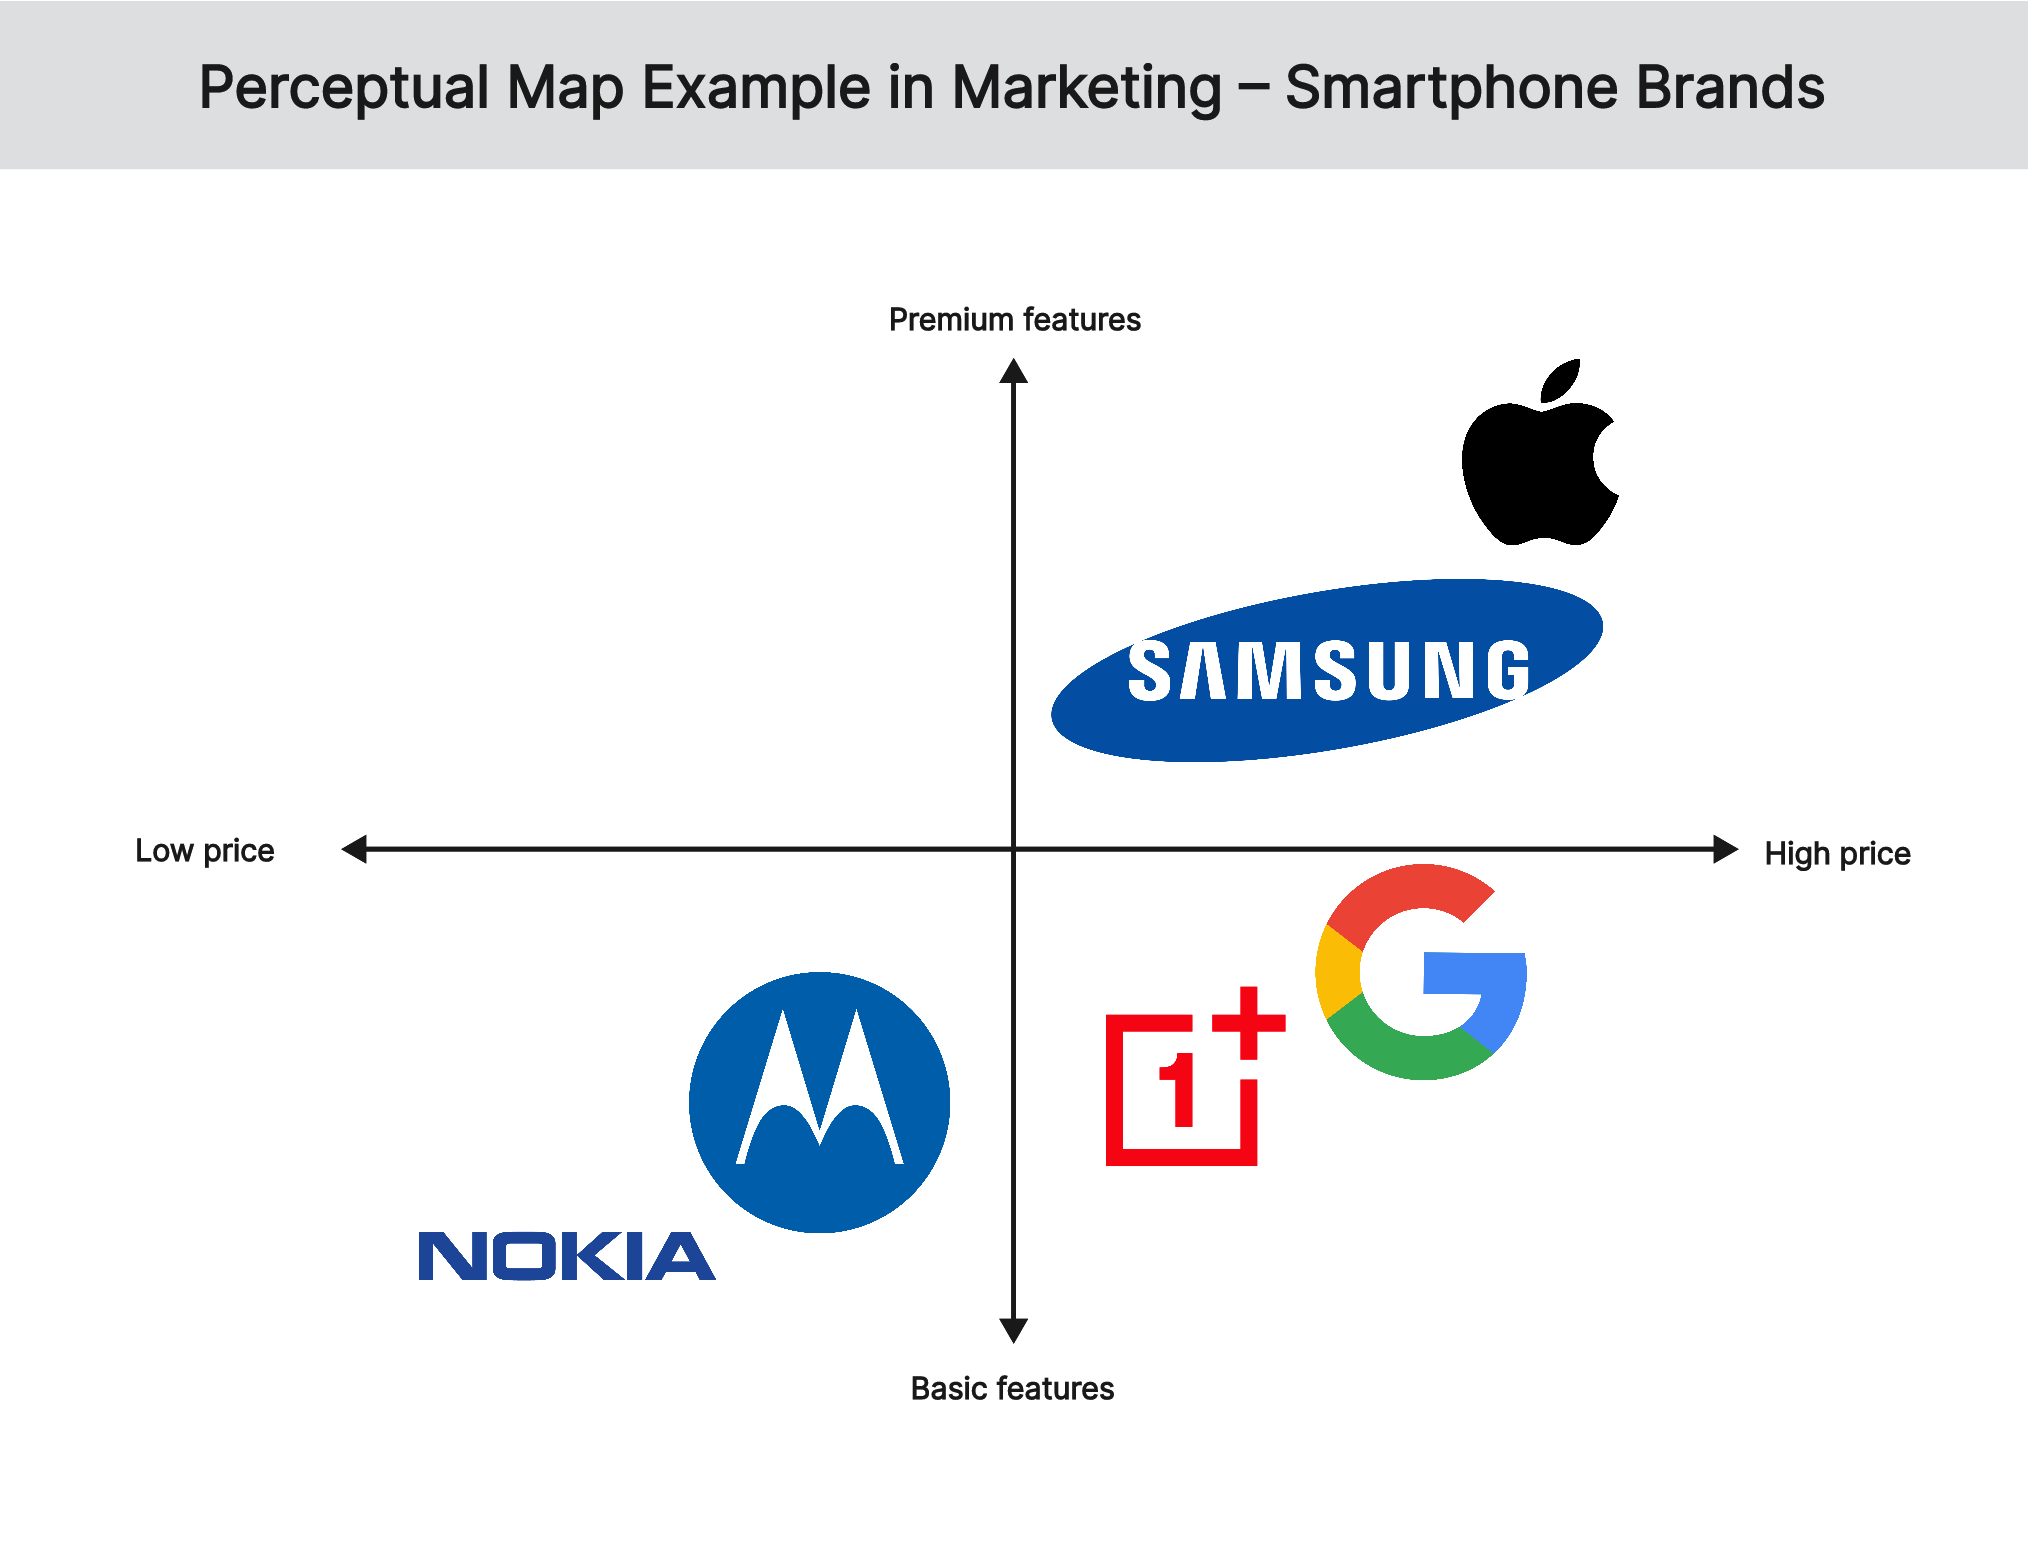
In the second perceptual map marketing example, the positioning of smartphone brands is presented based on their price and features. The Apple iPhone and Samsung Galaxy are positioned at the top of the map to reflect their high prices and premium features, while Nokia and Motorola are at the bottom of the map with their low prices and basic features. The Google Pixel and OnePlus phones are positioned in the middle to reflect their moderate prices and mid-range features.
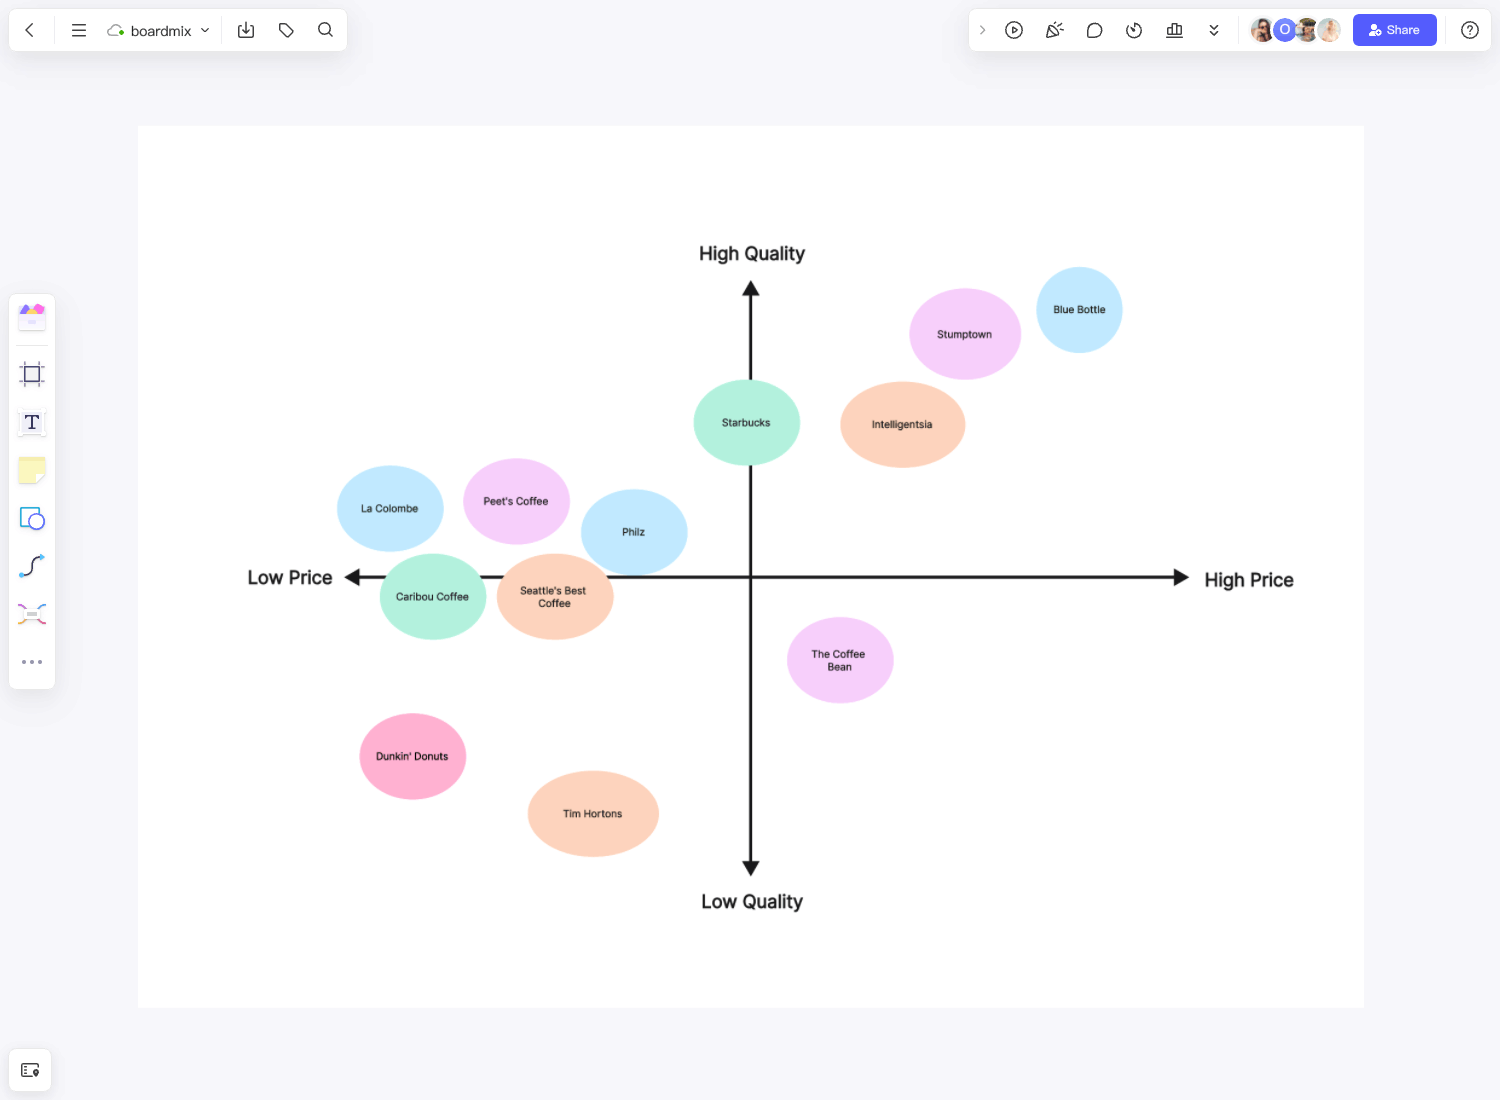
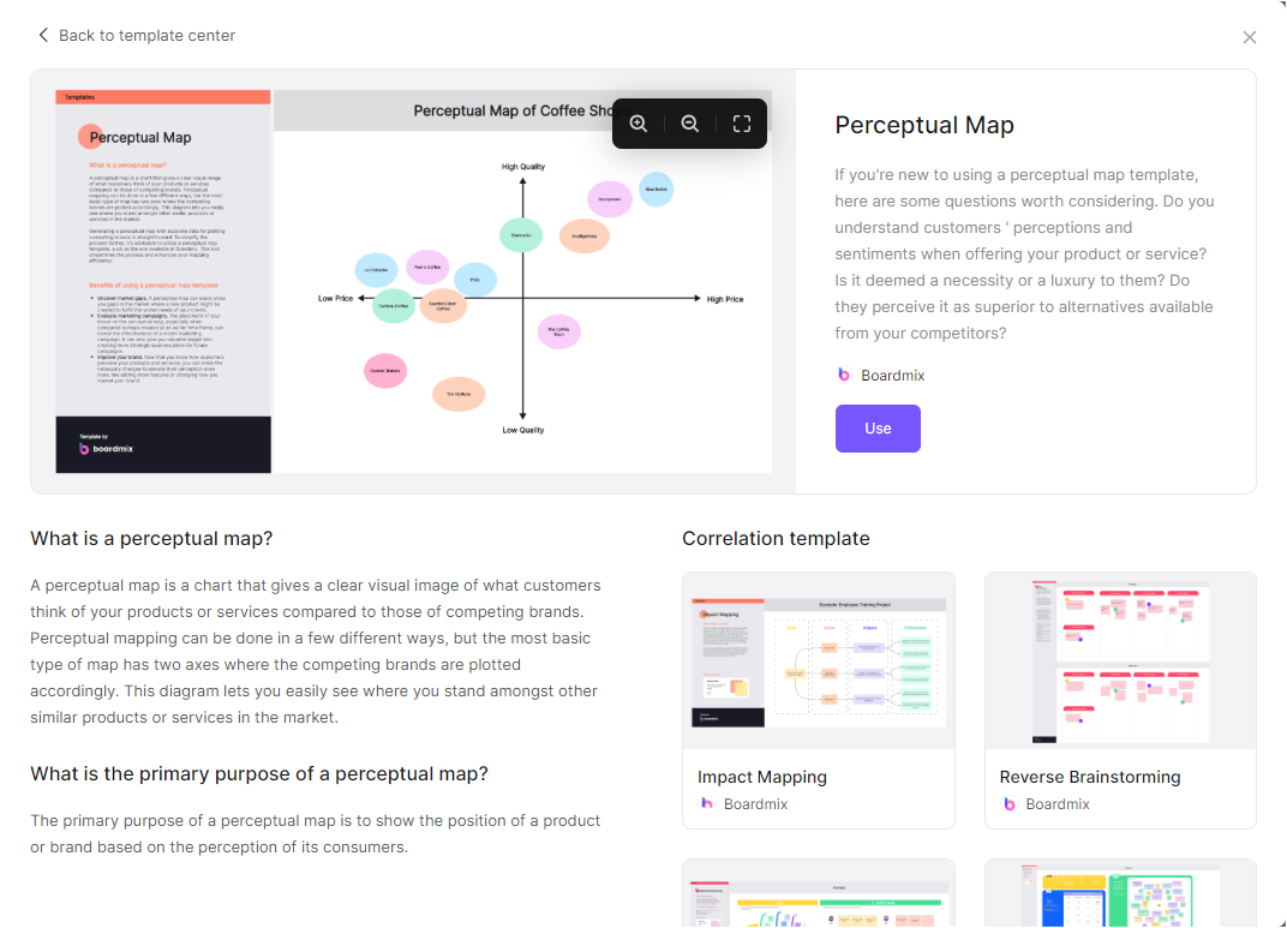
Coffee Brands Perceptual Map
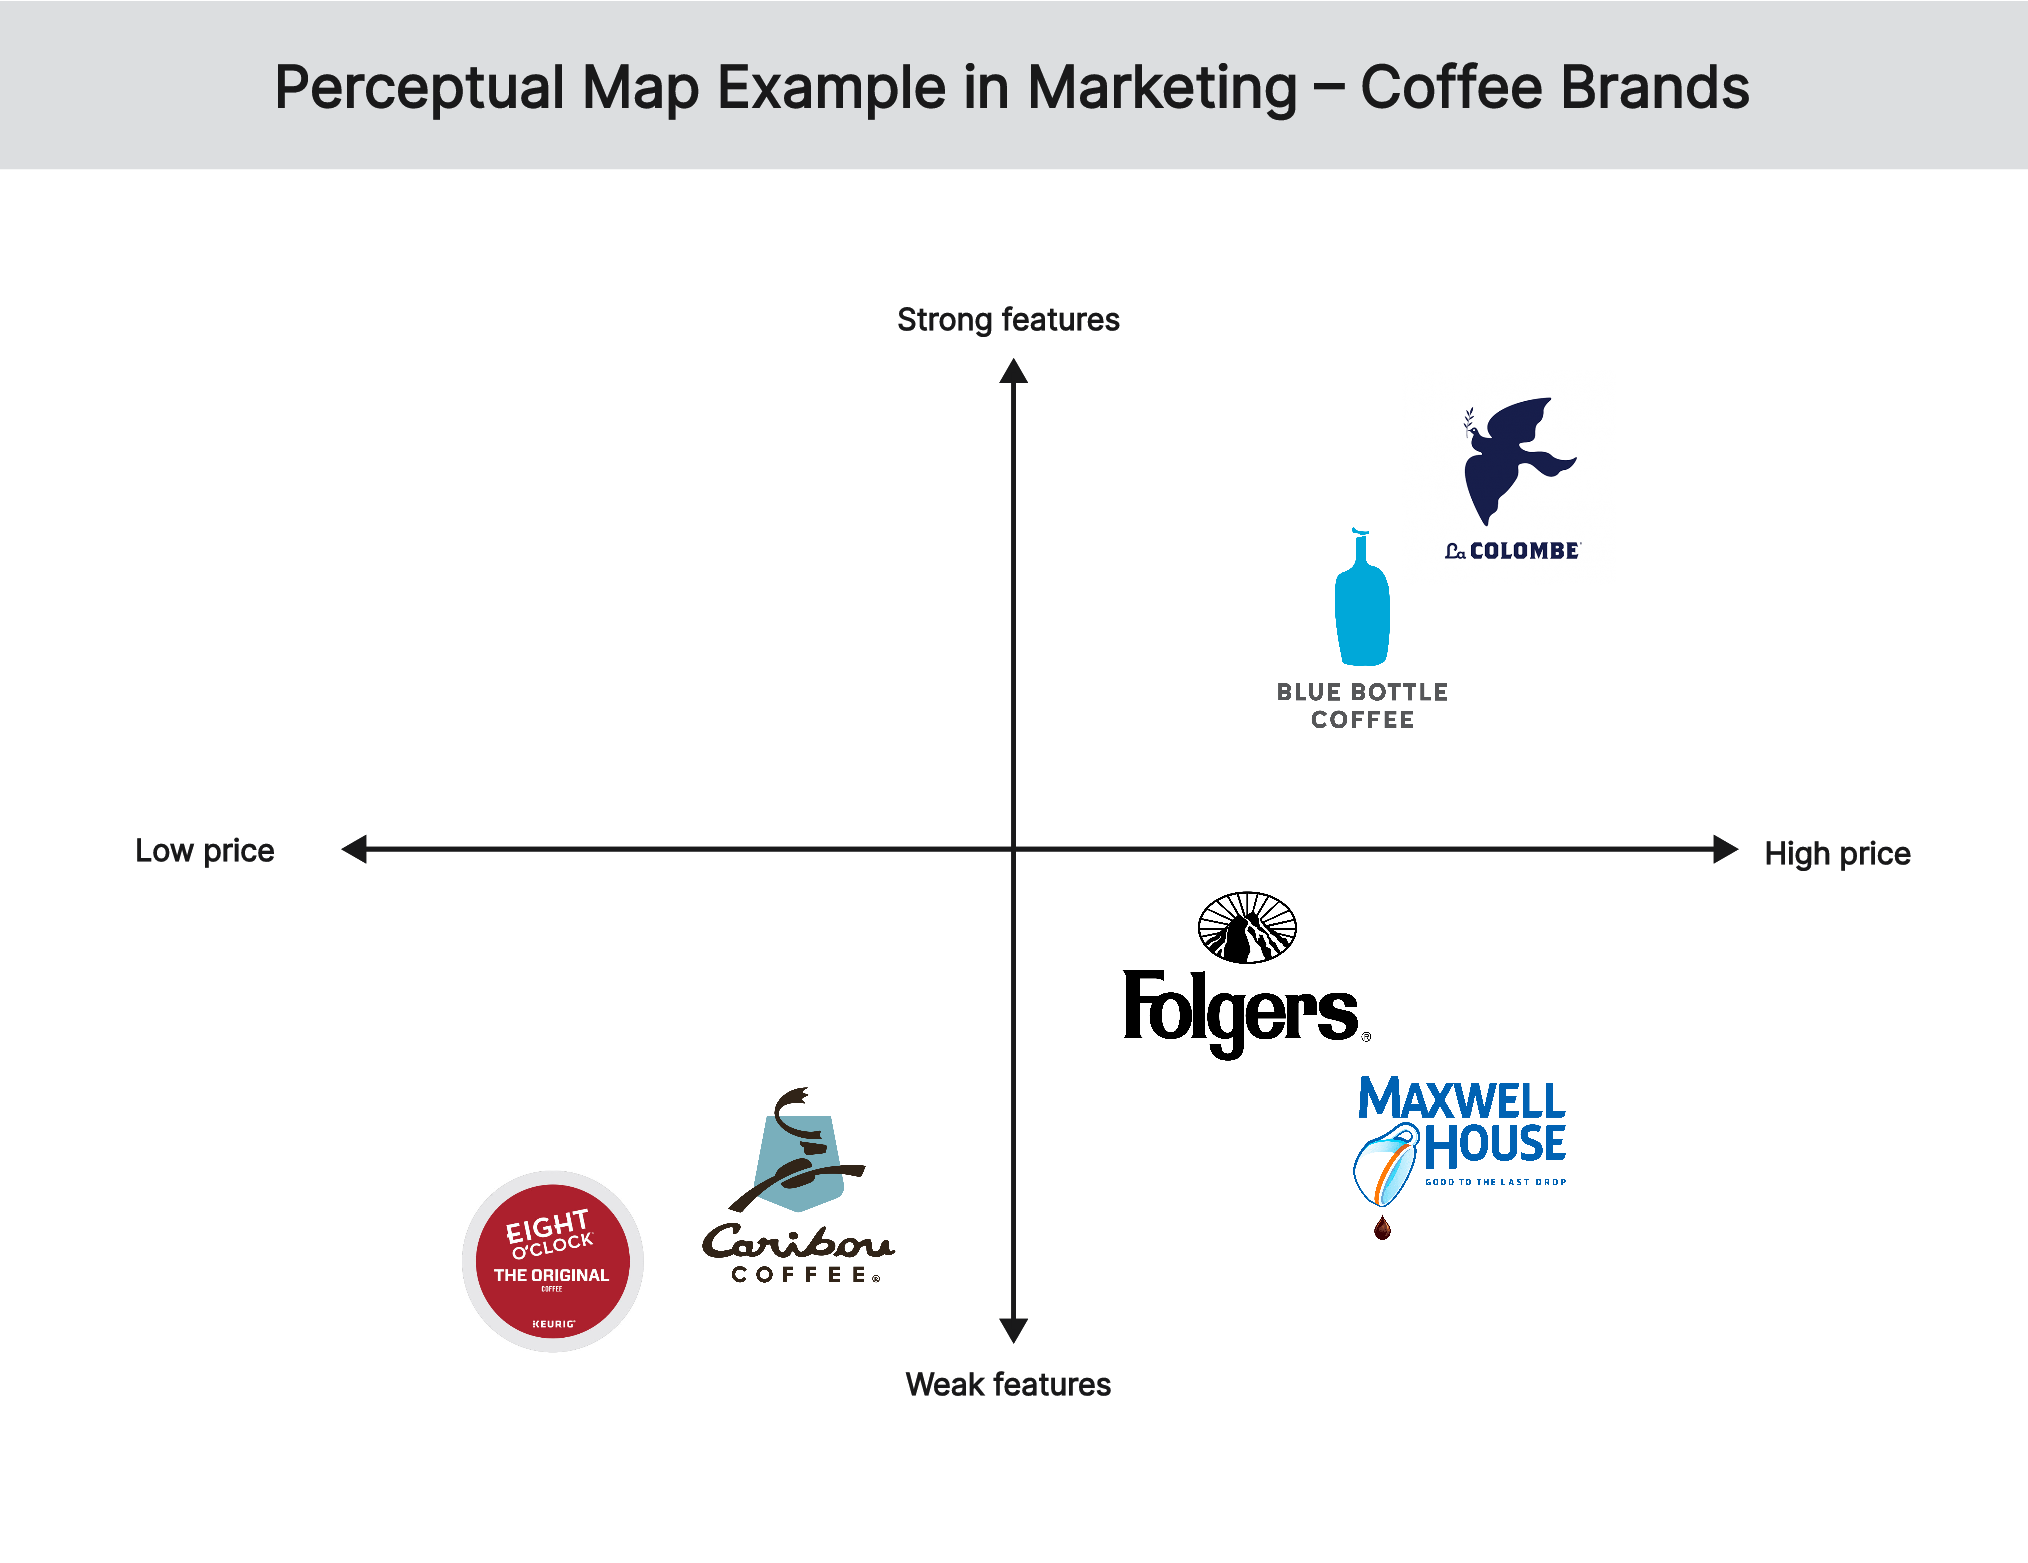
The third perceptual map marketing example represents the position of coffee brands in the market based on their prices and tastes. At the top of the map are La Colombe Single Origin Coffee and Blue Bottle Coffee because of their strong taste and high prices while Caribou Coffee and Eight O’clock Coffee are positioned at the bottom to reflect their weak taste and low prices. At the middle of the map are Folgers and Maxwell House, which are characterized by moderate taste and moderate prices.
How to build a perceptual map template Using Boardmix
In building a perceptual map, start by identifying the attributes of the product that you want to examine or measure. Then survey how consumers would rate your brand and competing brands. Gather and plot the survey results onto the Boardmix perceptual map template, which is extremely simple to use. From there, you can make all sorts of analyses of the displayed data. You can locate market gaps, verify if your brand is at an ideal position on the grid, think of ways to further improve your position, and so on.
Step 1 – Create your free account or sign up for the plan that meets your demands.

Step 2 – Click the Templates button on your workspace and select the perceptual map template.
Step 3 – Select your criteria, with which you will evaluate your product.
Step 4 – Place your product and your competitors on the graph.
Common Tips
-You can collect data for different perceptual maps at once when you’re surveying customers.
-In addition to consumer surveys, focus groups are a great source of information.
-Larger companies may benefit from multi-dimensional perceptual maps, but you will not need to hire a research and data expert to produce these in most cases.
-Review and update your perceptual map regularly, preferably once in three months.
Step 5 – Share your perceptual map with your team.
FAQs about perceptual map template
What is the primary purpose of a perceptual map?
The primary purpose of a perceptual map is to show the position of a product or brand based on the perception of its consumers.
What is a perceptual map vs. a preference map?
In a perceptual map, the position of a product or brand is based on selected attributes, while in a preference map, it is based on the actual choices made by consumers.