Gantt charts have long been a staple in the realm of project management, offering a visual timeline that helps teams track progress, manage tasks, and meet deadlines efficiently. With the rise of digital tools, creating Gantt charts has become easier and more accessible than ever, thanks to a variety of online makers available for free.
"Plans are nothing; planning is everything." — Dwight D. Eisenhower
The use of Gantt charts in project management allows teams to break down complex projects into manageable timelines, ensuring that every task is accounted for and completed on schedule. This visual tool is particularly useful for keeping all stakeholders on the same page and for adjusting plans as projects evolve.
In this article, we will explore five of the best free Gantt chart online makers. These tools will help you streamline your project planning, tracking, and collaboration efforts, ultimately leading to more successful and timely project outcomes.
What is a Gantt chart?
A Gantt chart is a type of bar chart that illustrates a project schedule and helps in the management and planning of projects. Named after its creator, Henry Gantt, who developed it in the 1910s, the chart provides a graphical representation of the project's timeline, showing the start and end dates of the project's tasks or activities.
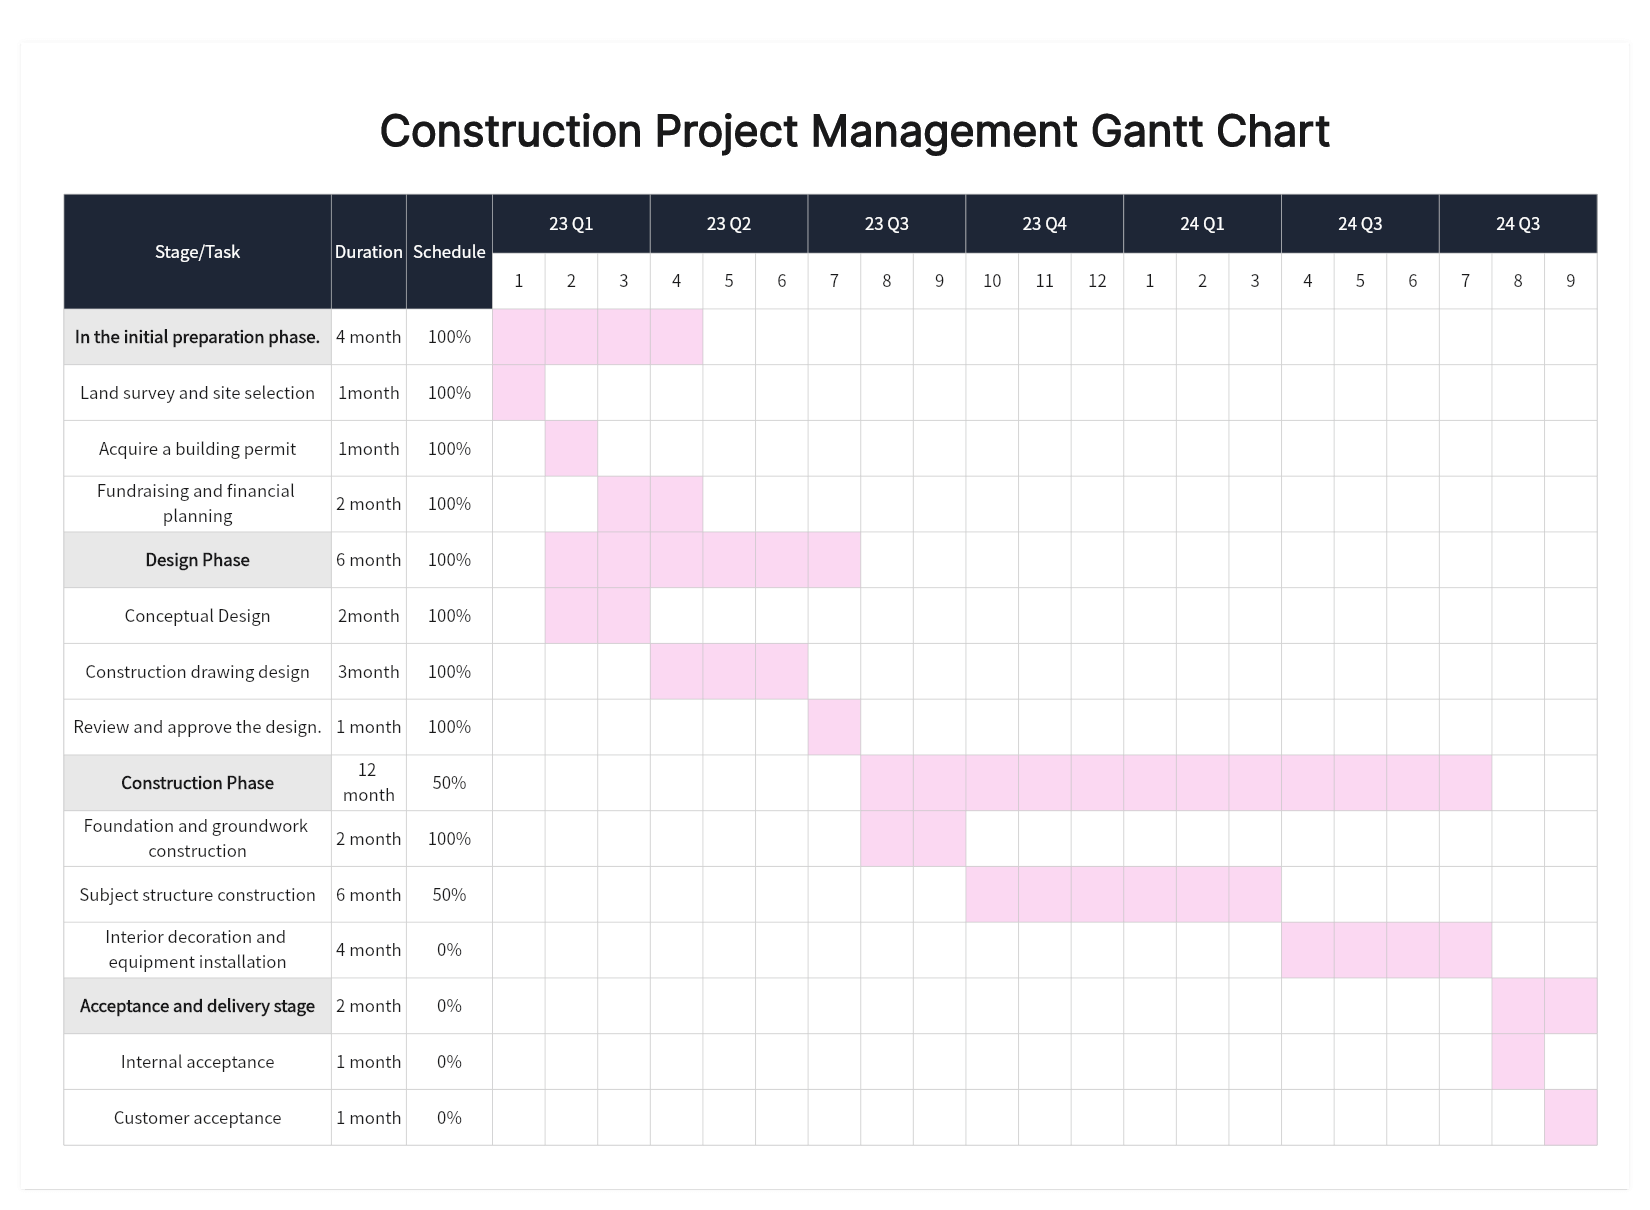
Key features of a Gantt chart include✨✨:
1. Timeline Representation: It displays the project timeline along the horizontal axis, often in days, weeks, or months.
2. Tasks and Activities: Each task or activity is represented as a bar (or series of bars) along the timeline, with the length of the bar indicating the duration of the task.
3. Dependencies: Gantt charts can show the relationships and dependencies between tasks, such as which tasks must be completed before others can start.
4. Progress Tracking: The charts can be used to track progress, with completed tasks often shown in a different color or pattern.
5. Resource Allocation: Some Gantt charts include information about resource allocation, showing which resources are assigned to which tasks.
6. Milestones: Key project milestones can be marked on the chart to provide clear reference points for the project timeline.
7. Adjustability: Gantt charts are dynamic and can be adjusted as the project progresses, allowing for changes in task duration, start/end dates, and resource allocation.
8. Versatility: They are used in various fields and industries, from construction and manufacturing to software development and event planning.
Gantt charts are a valuable tool for project managers and teams to visualize project schedules, manage timelines, allocate resources effectively, and ensure that projects stay on track.
Why use a Gantt chart maker online for project management?
Using an online Gantt chart maker as a project management tool offers numerous advantages for any organization, enhancing the efficiency and clarity of project management.
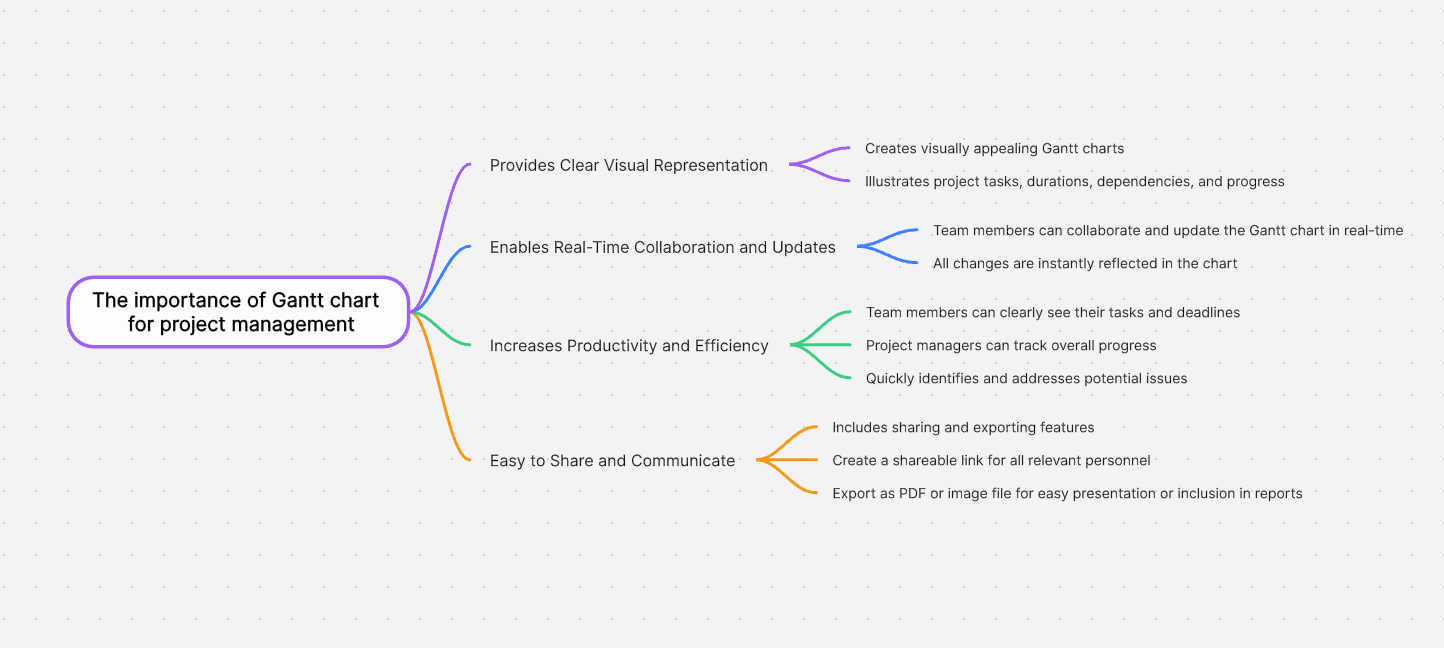
1. Provides Clear Visual Representation
An online Gantt chart maker can create visually appealing Gantt charts that make various aspects of a project easily understandable. These charts illustrate project tasks, durations, dependencies between tasks, and progress. This clear visualization helps in better understanding and planning the project.
2. Enables Real-Time Collaboration and Updates
Online Gantt chart makers, such as Boardmix, allow team members to collaborate and update the Gantt chart in real-time. Whether it's adding new tasks, adjusting timelines, or marking tasks as complete, all changes are instantly reflected in the chart. This ensures that all team members are aware of the latest project status.
3. Increases Productivity and Efficiency
By using an online Gantt chart maker, team members can clearly see their tasks and deadlines, enabling them to better manage their time and priorities. Project managers can also track the overall progress of the project through the Gantt chart, quickly identifying and addressing potential issues, thereby improving project execution efficiency.
4. Easy to Share and Communicate
Online Gantt chart makers typically include sharing and exporting features. You can create a shareable link for all relevant personnel to view the Gantt chart or export it as a PDF or image file for easy presentation in meetings or inclusion in reports.
An online Gantt chart maker is a powerful and flexible tool that can benefit both large organizations and small teams. Whether you are planning a complex large-scale project or managing the daily tasks of a small team, using an online Gantt chart maker can make your project management work easier and more efficient.
What to look for in an online Gantt chart maker?
When looking for an online Gantt Chart maker, consider the following features based on the search results provided:
1. User Interface and Ease of Use: The tool should have an intuitive interface that allows you to easily create and manage Gantt charts without a steep learning curve.
2. Multi-User Collaboration: The ability to invite and collaborate with team members in real-time can be crucial for project management.
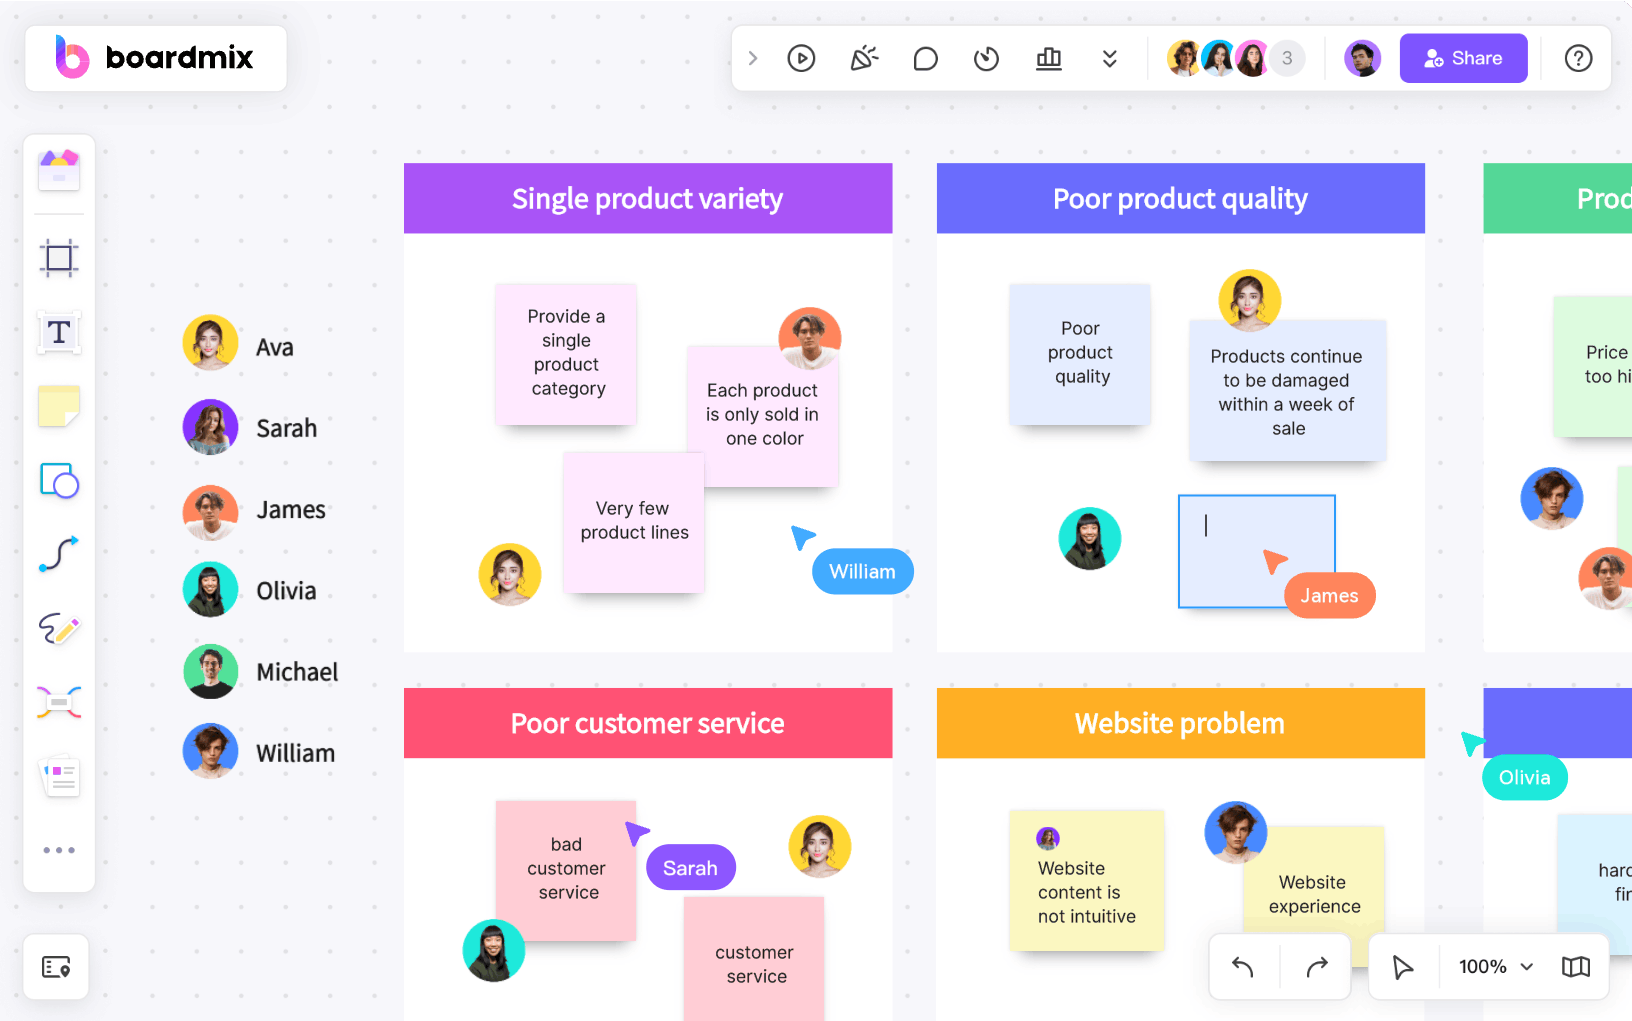
3. Customization Options: Look for options to customize the appearance of your Gantt chart, including colors, fonts, labels, and more.
4. Task Management Features: Features like task dependencies, milestones, and progress tracking can help you effectively plan and monitor project timelines.
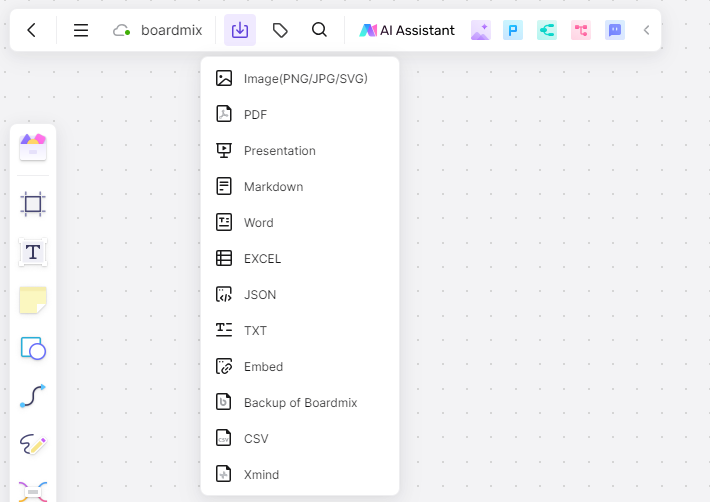
5. Export Options: The ability to export your Gantt charts in various formats such as images or Excel files for sharing and reporting purposes.
6. Hierarchical Task Structure: Some Gantt chart makers allow tasks to be organized in an infinite hierarchy, which can be beneficial for complex projects.
7. Permission Settings: The ability to set different levels of access and permissions for team members to control who can edit or view the Gantt chart.
8. Holiday and Workday Settings: Customizable work schedules and holiday settings that can automatically adjust task timelines.
9. Integration Capabilities: Check if the tool can integrate with other project management tools or software you are using.
10. Search Functionality: A search feature to quickly find tasks within the Gantt chart, especially useful for large projects.
11. Reporting and Analytics: Some Gantt chart makers offer reporting features that provide insights into project progress and performance.
12. Mobile Access: Consider whether you need access to the Gantt chart on mobile devices and if the tool has a responsive design or a dedicated app.
13. Data Backup and Security: Ensure the tool offers data backup and maintains the security of your project data.
14. Pricing and Subscription Options: Evaluate the pricing structure and whether it fits within your budget, considering the features you need.
By considering these features, you can select an online Gantt Chart maker that best fits your project management needs.
5 online Gantt chart maker for creating Gantt chart online
The task of project management has always required immense organizational and planning skills. Fortunately, there are many tools that can make this task much simpler. Among them, Gantt chart creation tools are crucial in helping project managers better plan, coordinate, and track project progress. Below, we introduce you to the top five online Gantt chart creation tools.
1. Boardmix
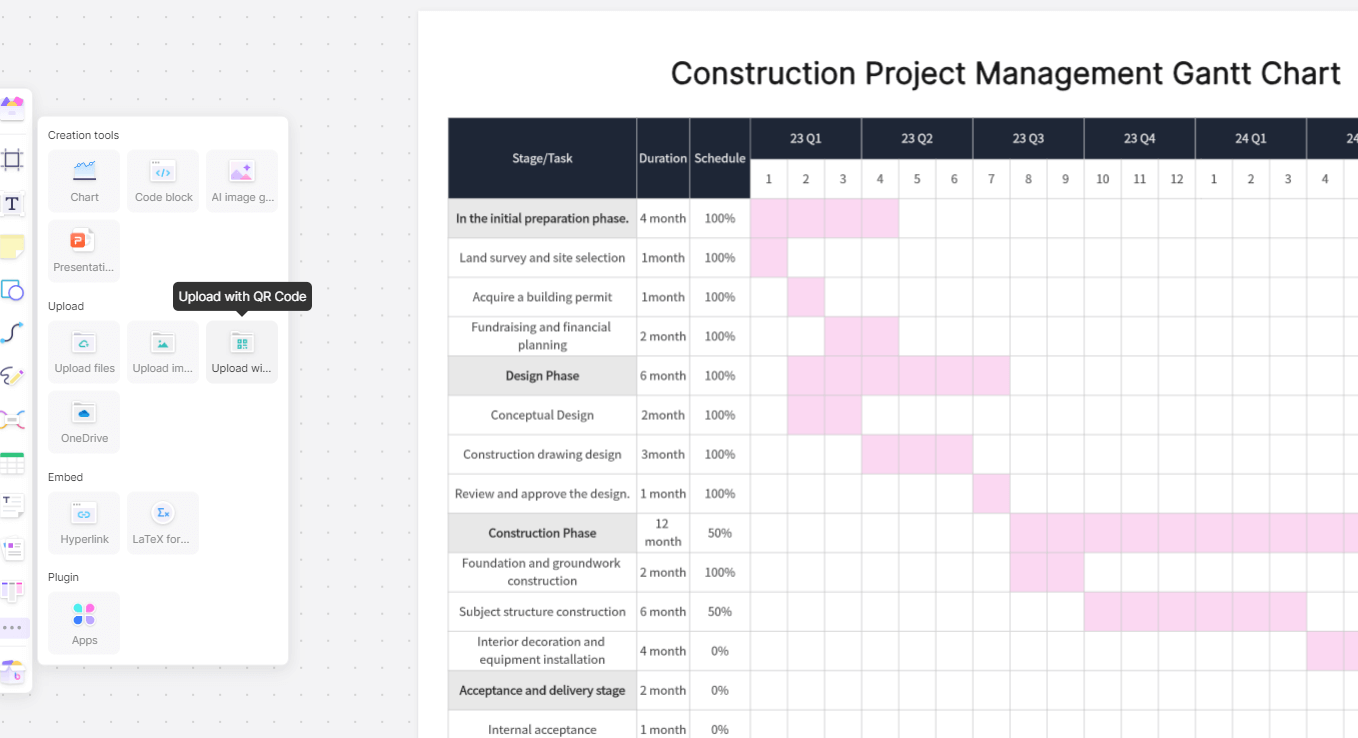
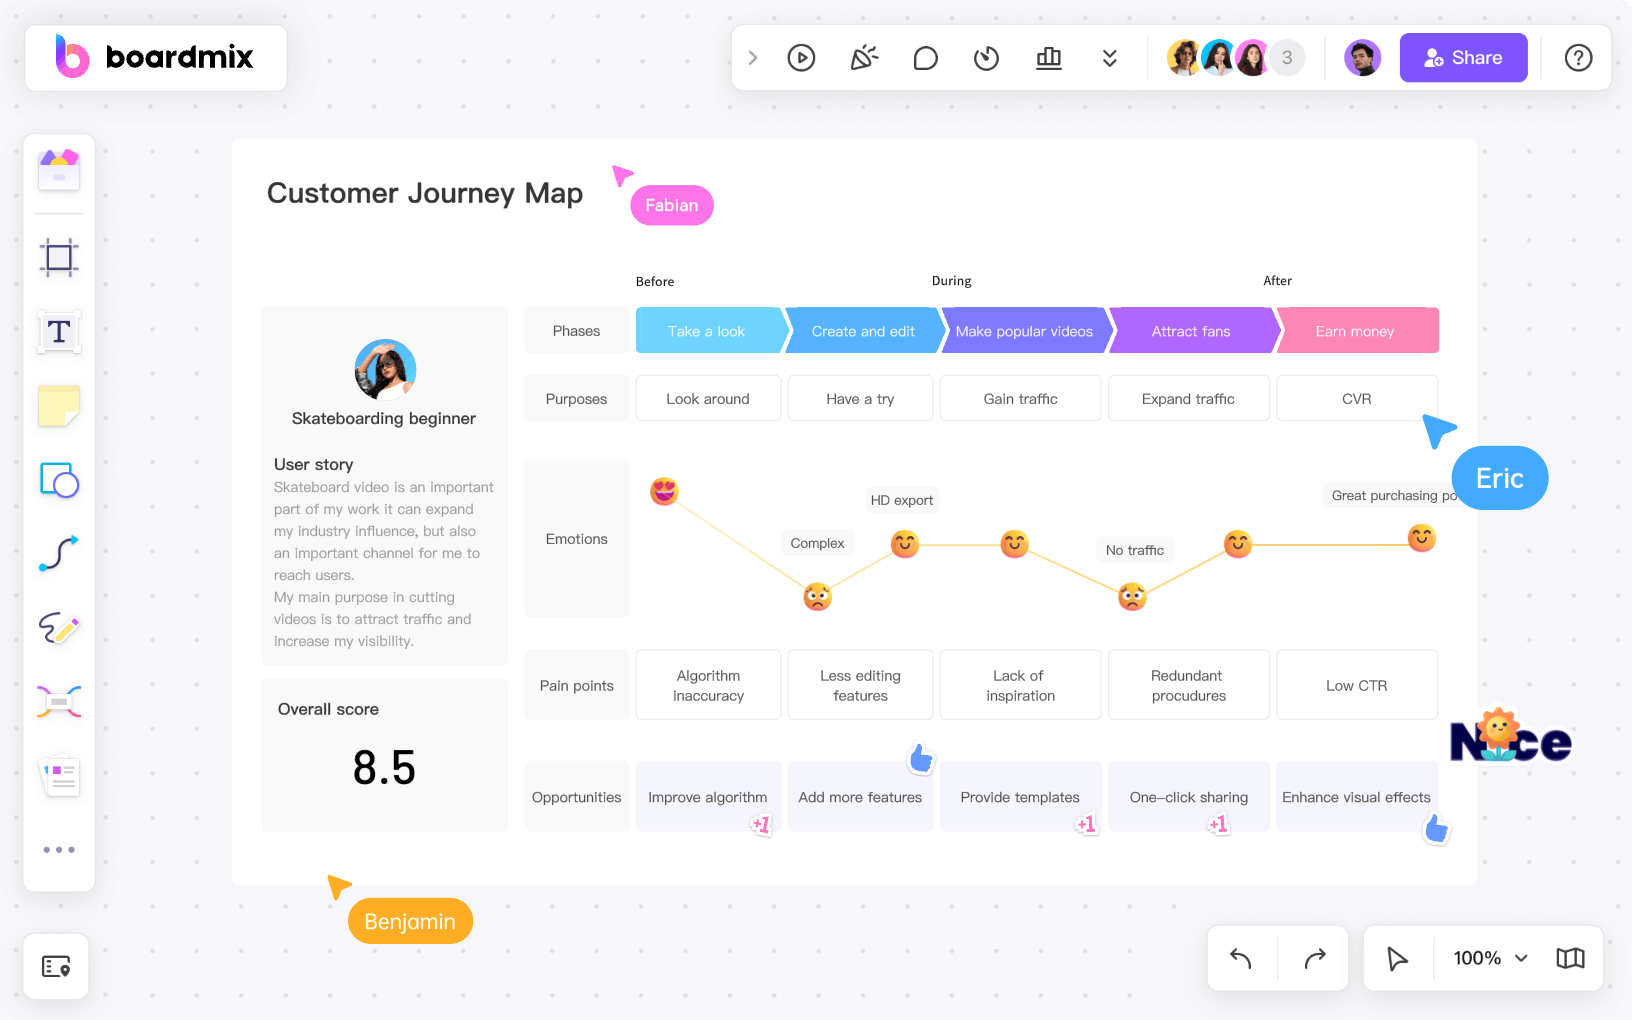
Boardmix offers an intuitive and powerful online Gantt chart creator. Whether you are an experienced project manager or a novice just starting out in project management, you can benefit from the free Gantt chart templates provided by Boardmix. You can easily create and edit tasks and adjust the start and end times of tasks by dragging the ends of the bars. At the same time, Boardmix also provides real-time collaboration, sharing, and export functions.
2. Wrike
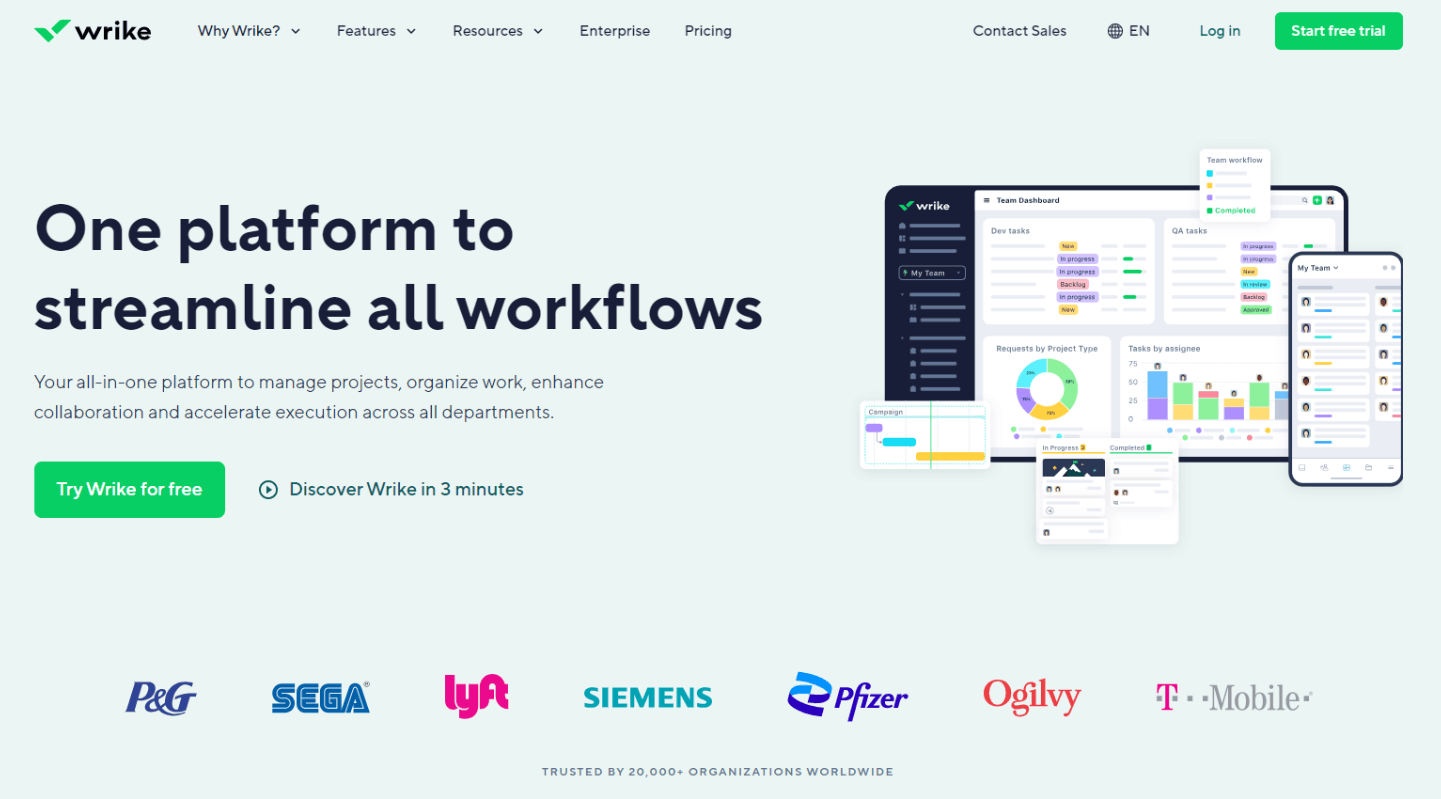
Wrike is a cloud-based project management and collaboration tool that offers robust Gantt chart creation capabilities. You can use it to set task dependencies, manage resource allocation, and track project progress. Wrike also has a built-in timeline view that can help you better plan and manage your projects.
3. Smartsheet
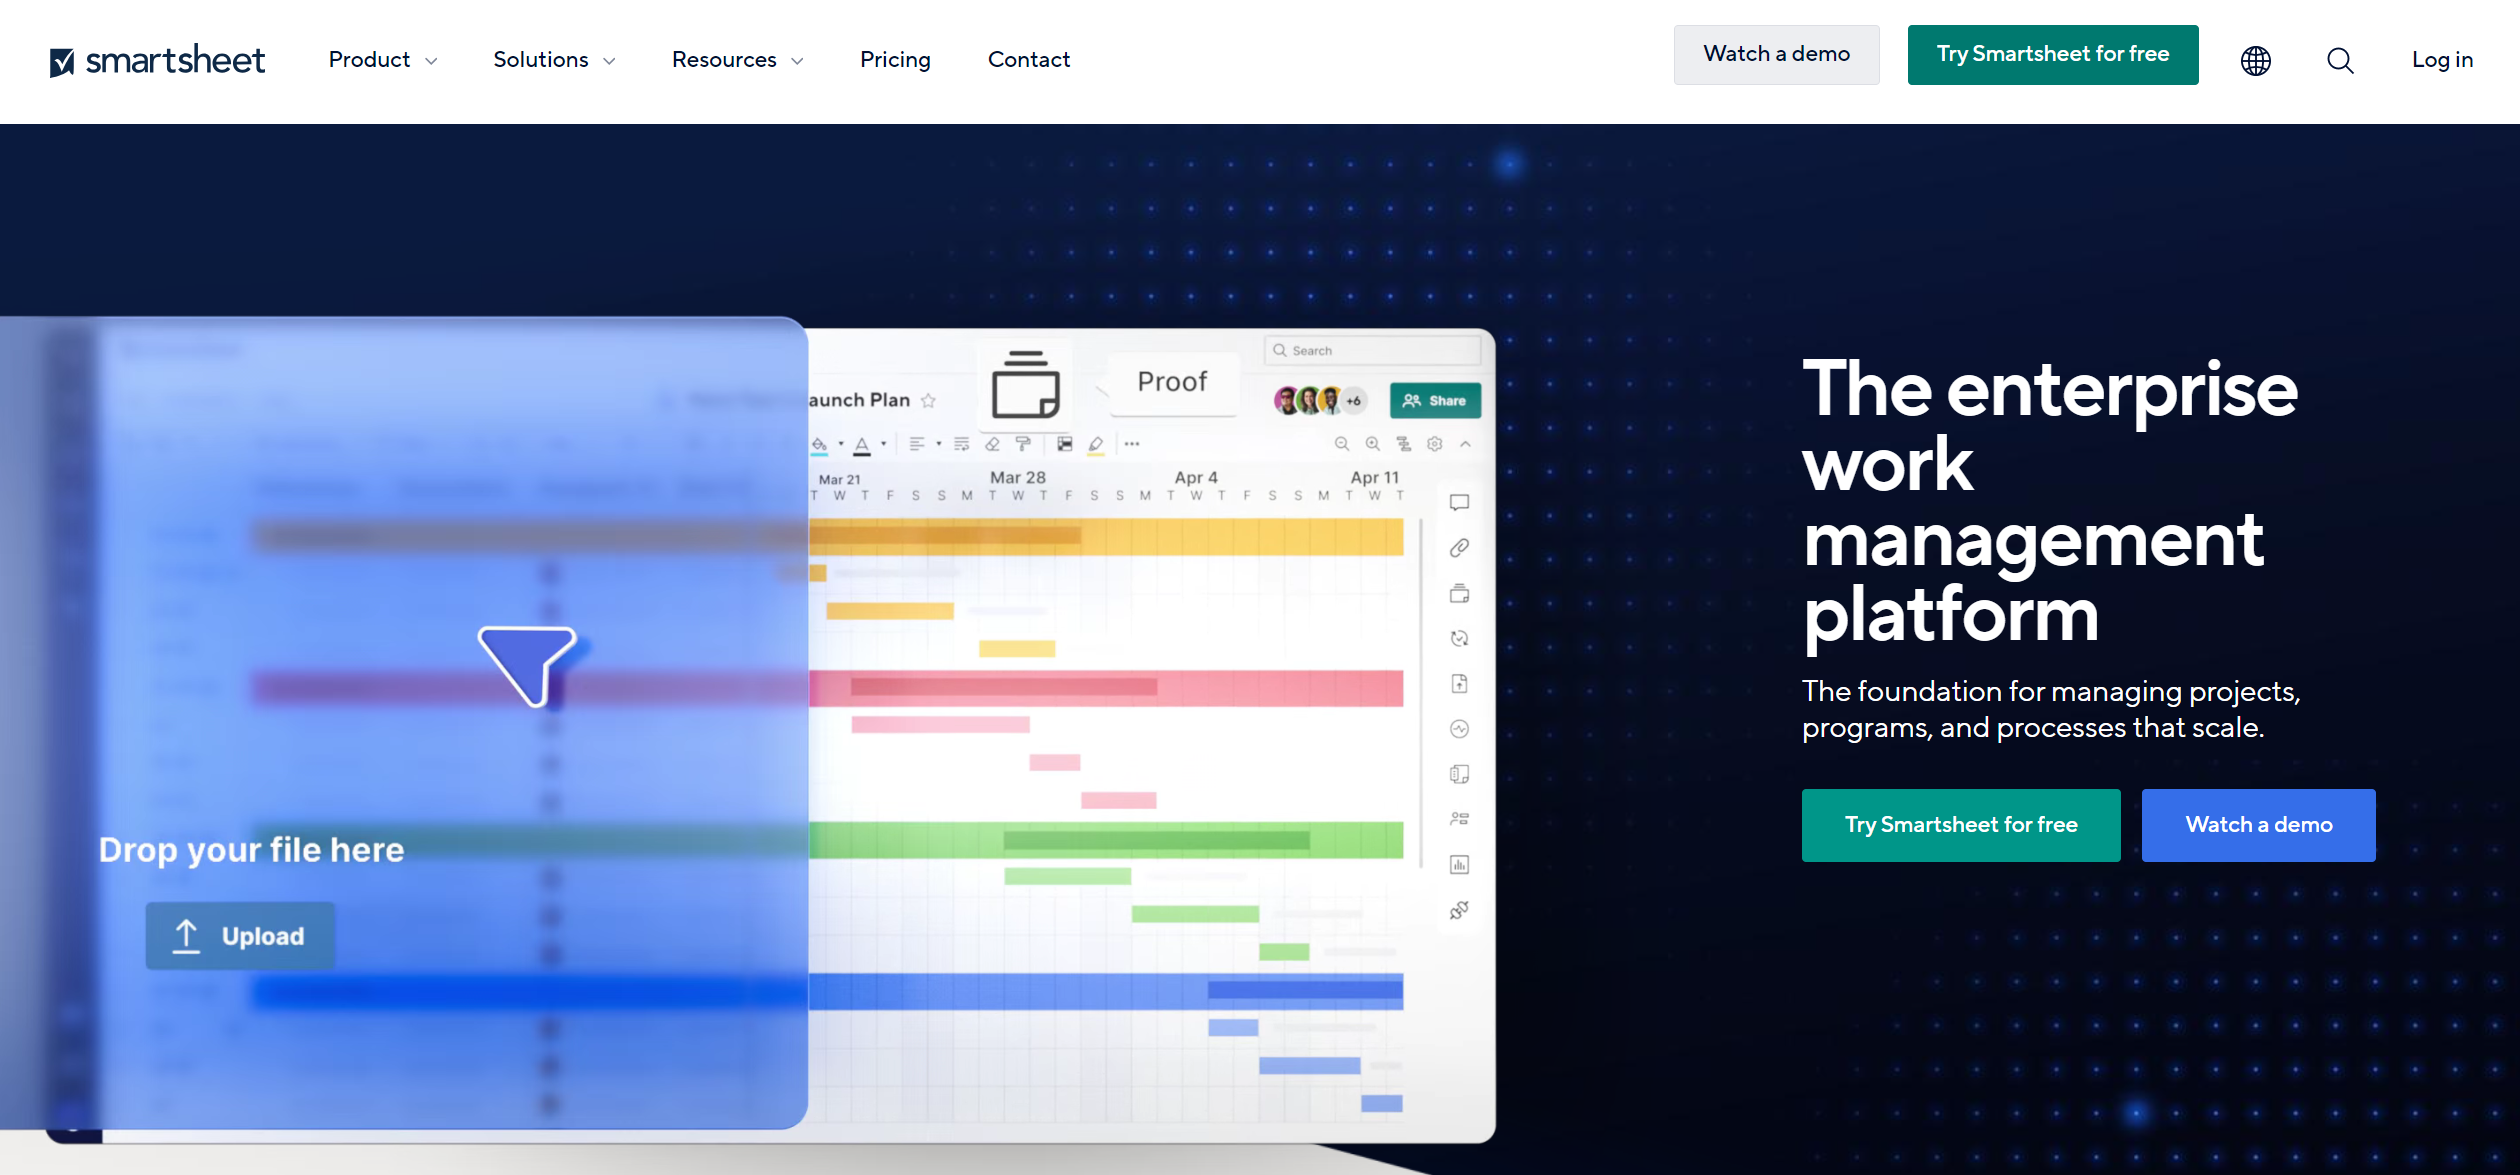
Smartsheet is a popular online project management tool that offers an easy-to-use Gantt chart creator. In Smartsheet, you can create customizable Gantt charts, conveniently track task progress, set dependencies, and manage multiple projects.
4. TeamGantt
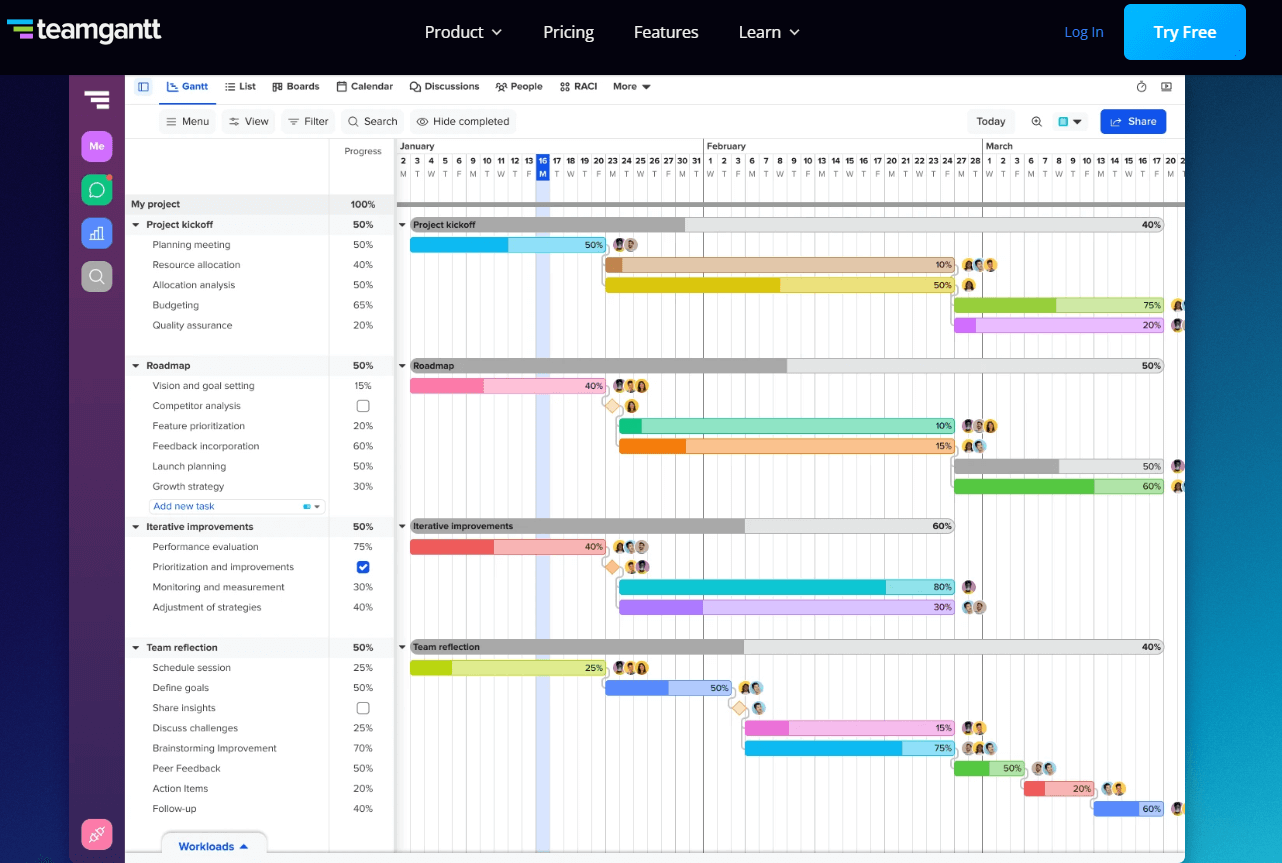
As the name suggests, TeamGantt is specifically designed for creating Gantt charts. This online tool is very intuitive and allows you to quickly create outstanding Gantt charts while supporting team collaboration, sharing, and export functions. In addition to this, TeamGantt also provides advanced features such as resource management and time tracking.
5. Microsoft Project
Microsoft Project is an industry-leading project management software that provides advanced Gantt chart creation capabilities. Microsoft Project allows you to easily define project tasks, set dependencies, and offers a wealth of view options to help you monitor the status and progress of your projects. Moreover, as part of Microsoft Office, it can seamlessly integrate with other Microsoft products such as Excel and Outlook.
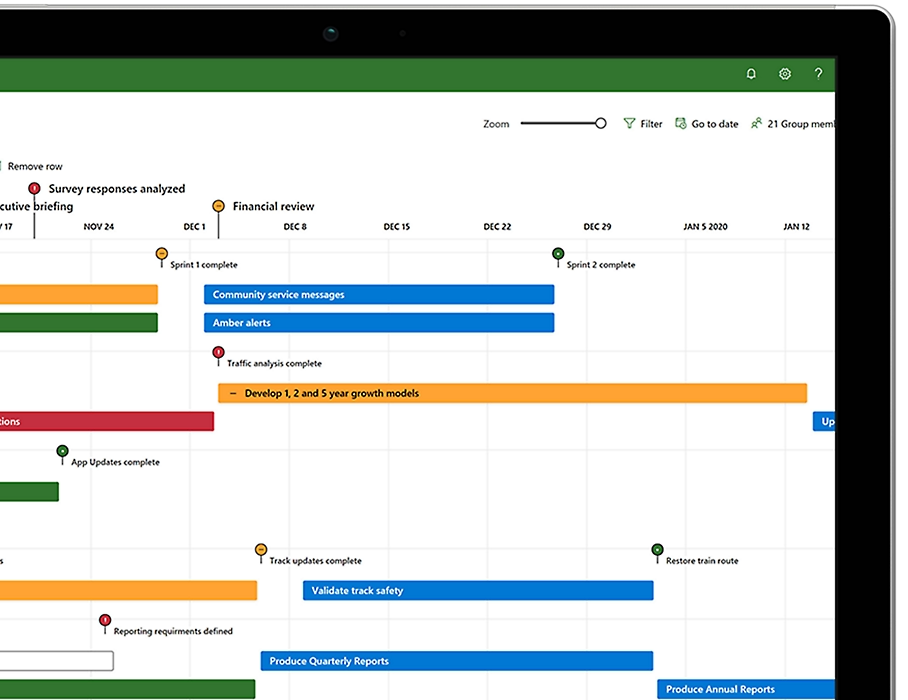
These online Gantt chart creation tools all have their advantages and features. Choosing the right tool according to your needs can greatly enhance your project management efficiency.
How do I make a Gantt chart online for free?
If you're looking for a quick and convenient way to create Gantt charts online, Boardmix would be your ideal choice. It offers free Gantt chart templates that allow you to easily create your own Gantt charts. Here are the steps to create a Gantt chart for free on Boardmix:
Log in and Choose a Template
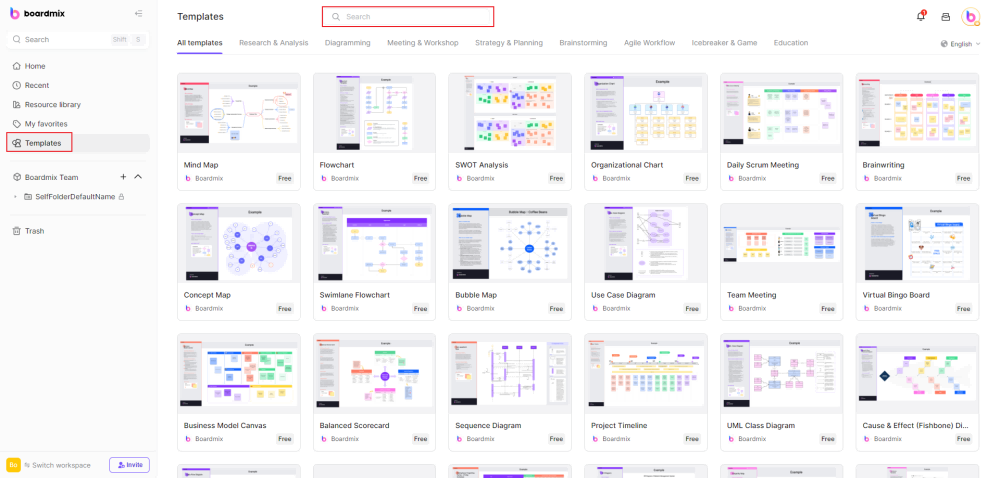
First, you need to visit the official website of Boardmix and register. After completing the registration, log into your account and then navigate to the "Template Library" page. Here, you can see various Gantt chart templates. Choose a template that suits your needs and click "Start Using".
Create a Project
After selecting a template, you will be guided to a new page. Here, you need to fill in some basic information to create a new project. For example, the name of the project, start date, end date, etc. After entering this information, click the "Create" button.
Add and Edit Tasks
In the newly created project page, you can start adding tasks. Click the "Add New Task" button and then fill in the task name, description, start date, end date, and person in charge, etc.
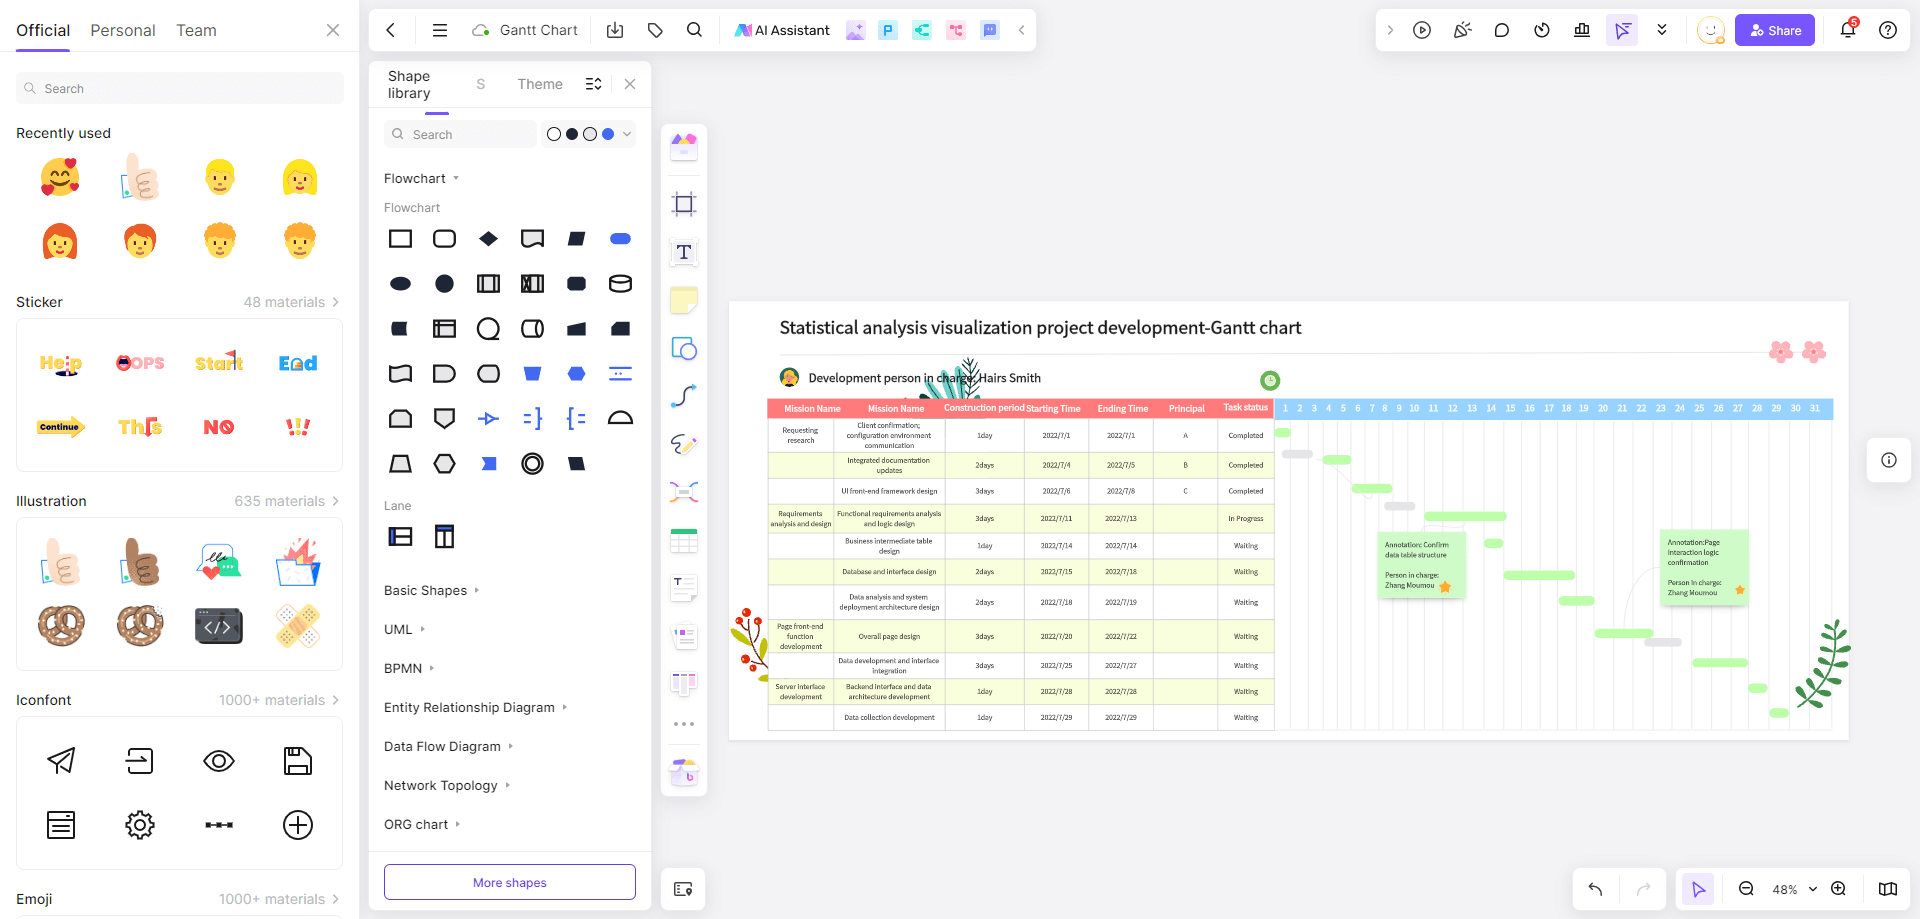
Each task can be displayed as an independent bar on the Gantt chart. You can adjust the start and end times of the task by dragging the ends of the bar. If there are dependencies between tasks, you can represent them with arrows.
Monitor and Adjust Progress
Gantt charts not only help you plan projects but also monitor project progress. On the Gantt chart, completed tasks will be marked green. If there are any delays, you can directly adjust the timeline of tasks on the chart.
Share the Gantt Chart
After completing the creation of the Gantt chart, you might want to share it with team members or clients. Boardmix provides a sharing feature that allows you to generate a link and send it to them via email or other methods.
Boardmix offers an intuitive and powerful tool for creating Gantt charts. It not only helps you manage projects better but also gives your team members or clients a clearer understanding of the project. Whether you are an experienced project manager or a novice just starting out in project management, you can benefit from Boardmix's free Gantt chart templates.
FAQ about the Gantt chart
Is Google Gantt chart free?
Yes, Google Gantt Chart is free to use. Google provides a Gantt Chart through its Google Charts library, which is an open-source, web-based data visualization tool. You can use it by incorporating the Google Charts JavaScript library into your web application.
Does Office 365 have a Gantt chart?
Office 365 does not have a dedicated Gantt chart tool, but it includes Microsoft Project, a project management software that offers extensive Gantt chart functionalities. If you have a subscription that includes Microsoft Project, you can create and manage Gantt charts. Additionally, you can use other Office 365 applications like Excel to create Gantt charts manually or with the help of templates.
Is there a Gantt chart in Excel?
Excel does not have a built-in Gantt chart feature, but you can create a Gantt chart using its bar chart functionality. This typically involves setting up your data in a specific way and formatting a stacked bar chart to look like a Gantt chart. There are also templates available within Excel or online that can help streamline the process of creating a Gantt chart.


