


The cause-and-effect fishbone diagram, also known as the Ishikawa diagram, serves as a powerful tool in problem-solving and root-cause analysis. Uncovering core issues is at the heart of the Fishbone Diagram methodology. By meticulously examining the potential causes branching off the main spine, teams can delve deep into the complexities of a problem, identifying not just the surface-level issues but also their underlying root causes. In this exploration, we will delve into the intricacies of cause-and-effect fishbone diagrams, understanding their structure, methodology, and their pivotal role in uncovering core issues.
Part1. Overview of Fishbone Diagrams
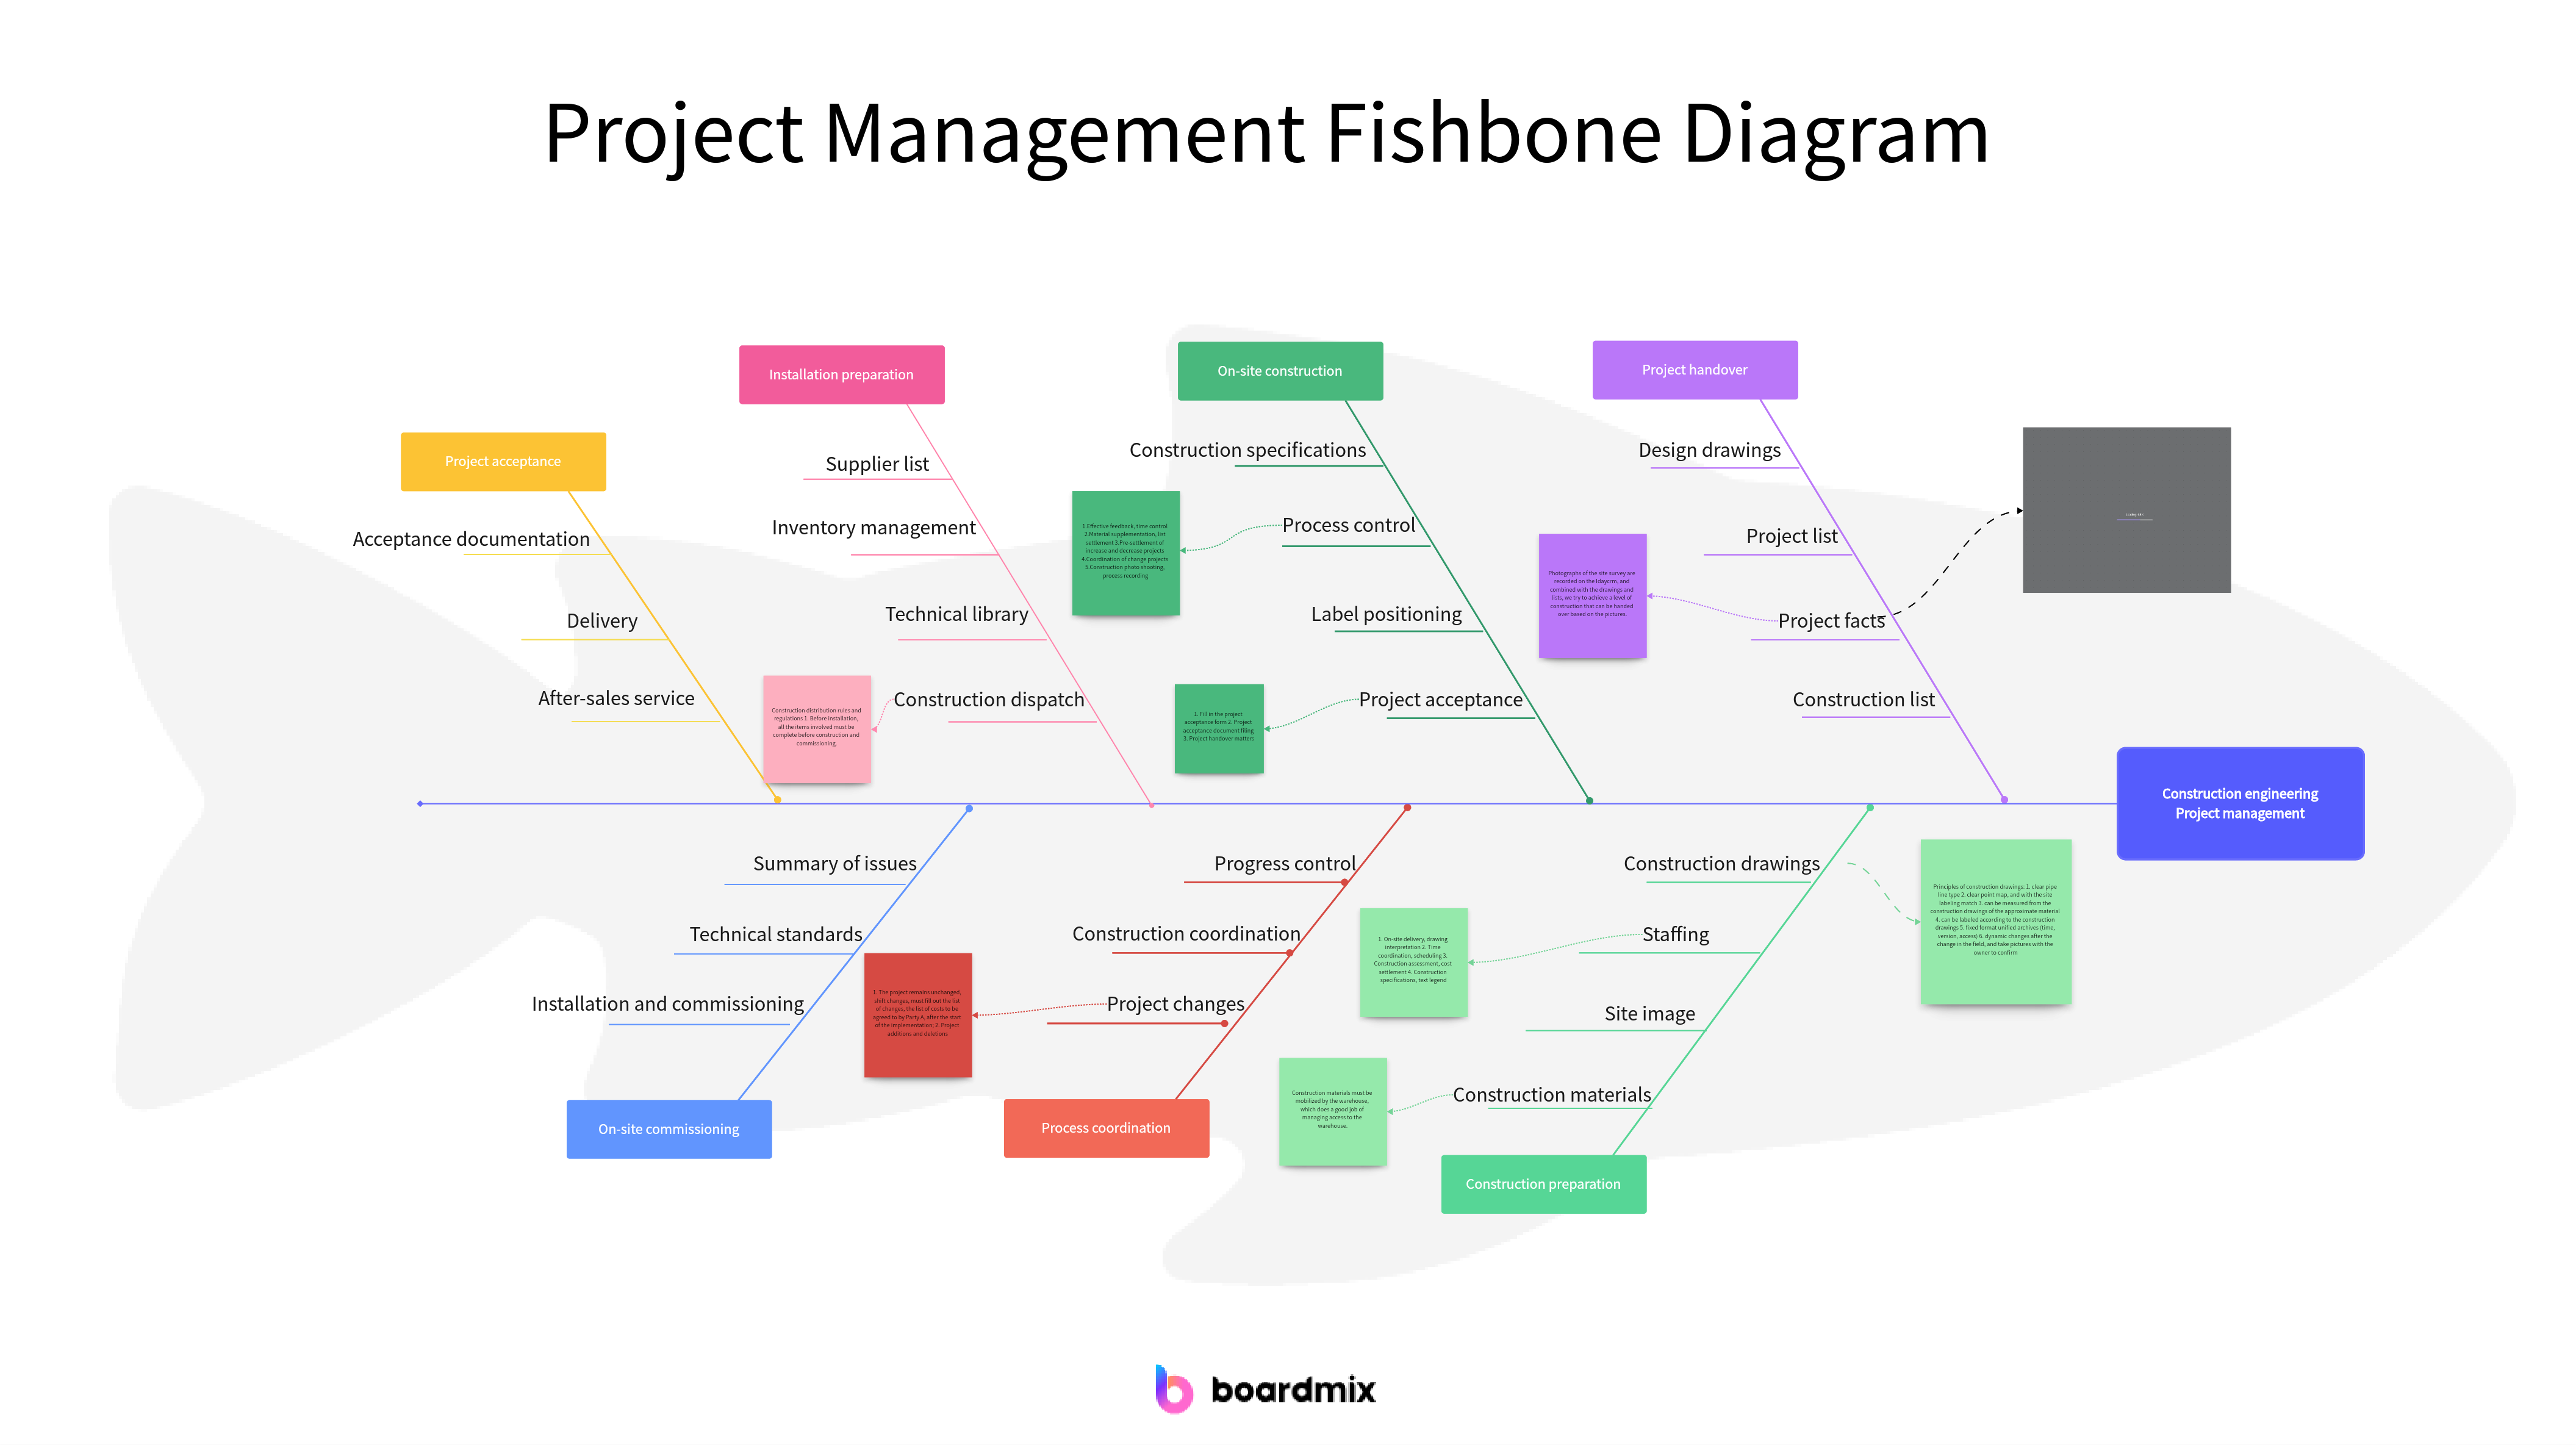
The cause-and-effect fishbone diagrams are graphical tools used to analyze the potential causes of a problem or an effect. They are named after their shape, which resembles a fishbone.
Definition and purpose of Fishbone diagrams
Fishbone diagrams provide a visual representation of the various factors that can contribute to a specific problem or outcome. The main purpose of using a fishbone diagram is to identify and analyze the root causes of a problem, rather than just treating its symptoms. By visually organizing and categorizing the potential causes, it becomes easier to understand the relationships between different factors and identify the most influential ones.
Key components and how they aid in cause identification
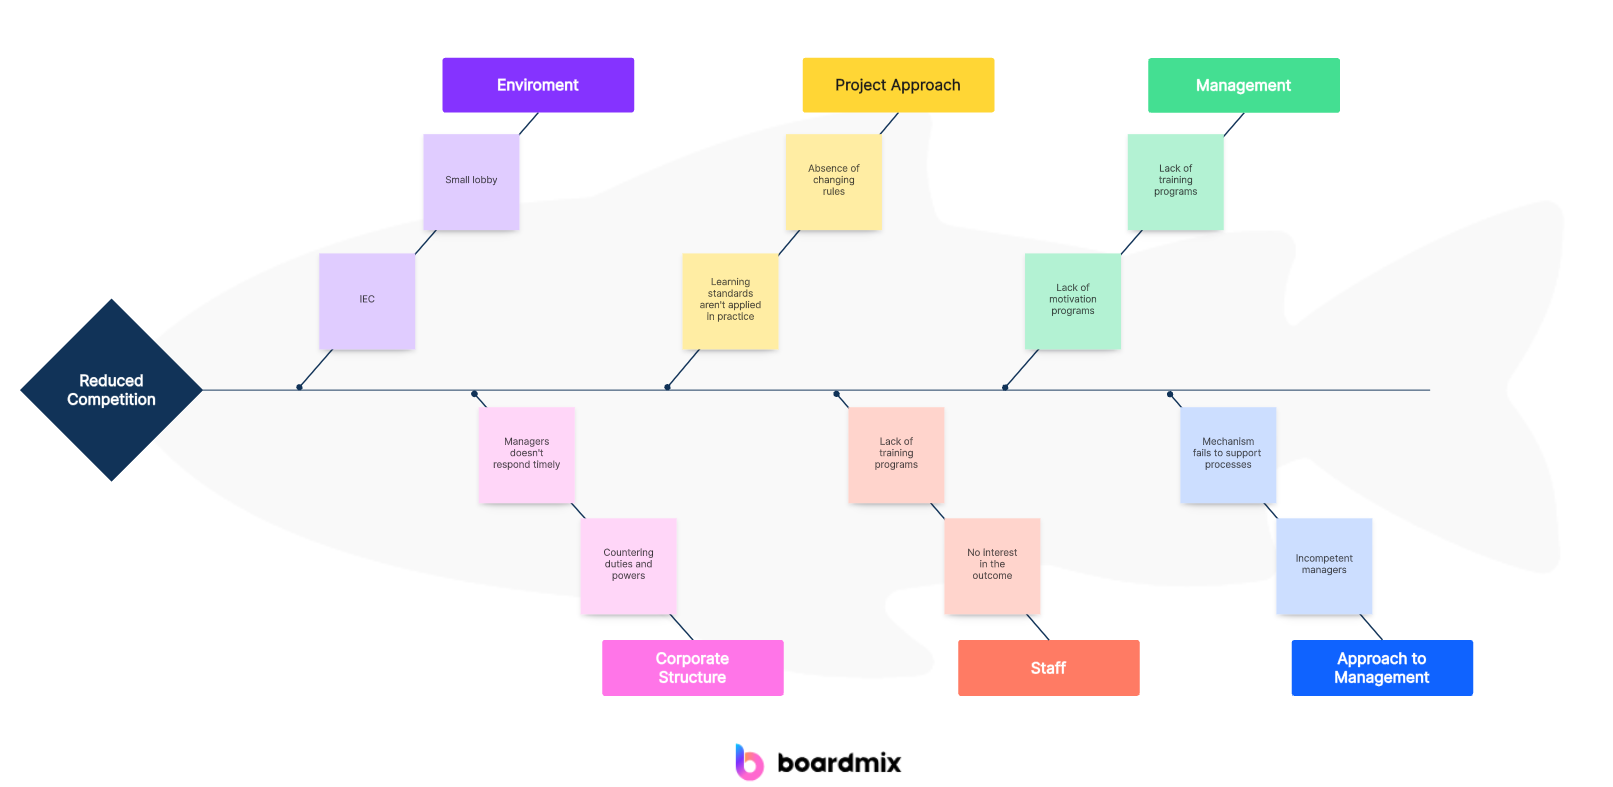
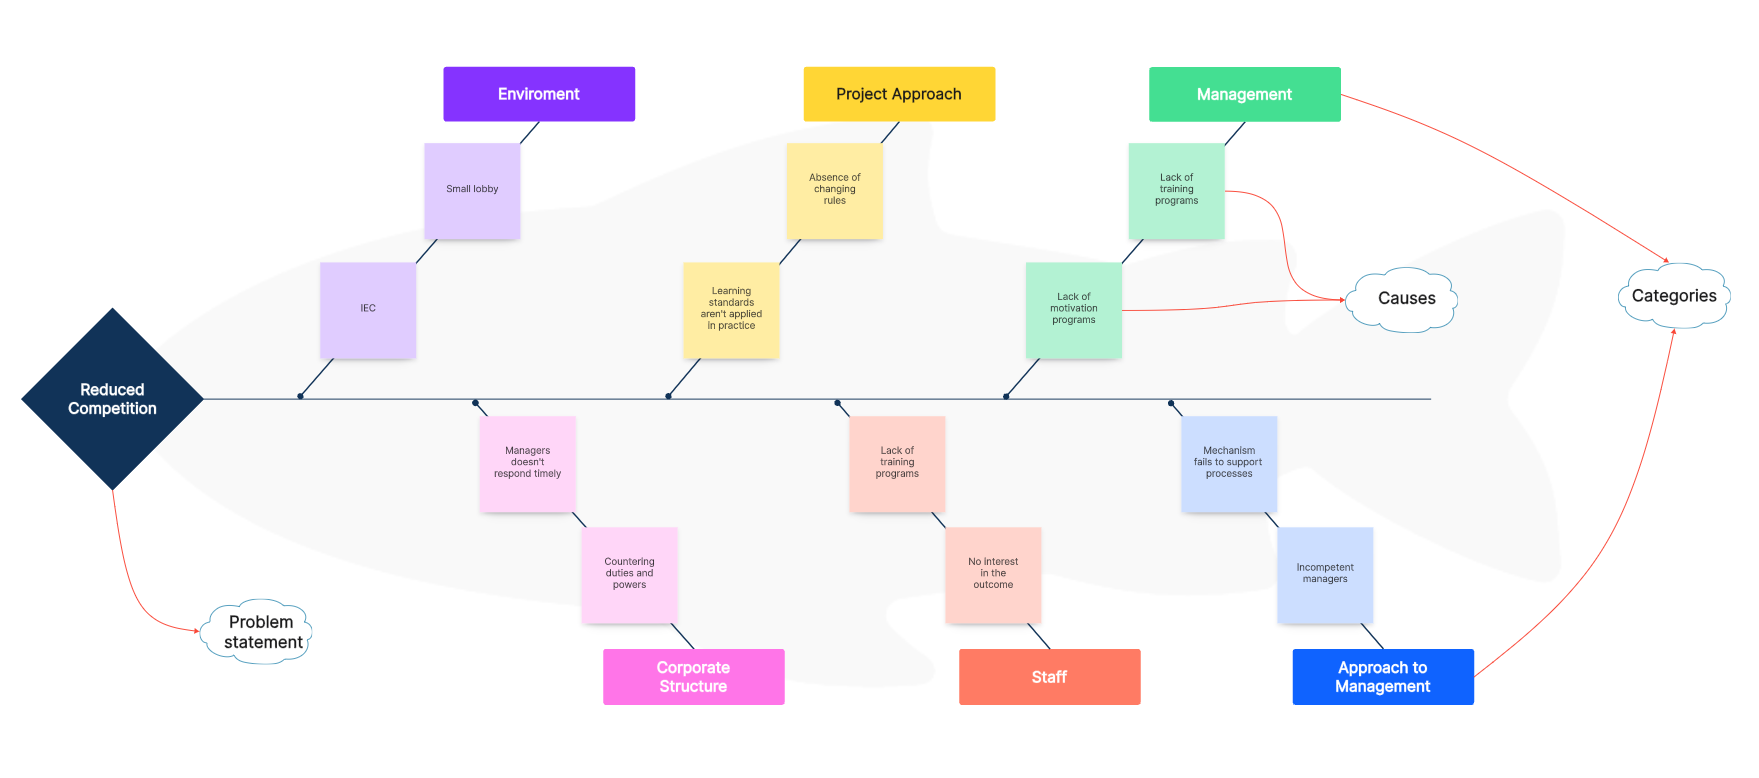
- Problem statement: At the head of the fishbone diagram, the specific problem or effect that needs to be analyzed is stated clearly. This serves as a starting point for identifying the causes.
- Categories: The fishbone diagram branches out into several categories, which are aligned with different potential causes. These categories typically include 6 M's: Manpower, Machine, Material, Method, Measurement, and Environment. By categorizing the causes, it becomes easier to analyze and prioritize them.
- Causes: Under each category, various potential causes are listed. These causes are brainstormed by a team or individuals involved in the analysis process. It's important to encourage diverse perspectives and input during this stage to ensure a comprehensive understanding of the problem.
- Analysis and prioritization: Once the causes are identified, they can be analyzed further to determine their likelihood of contributing to the problem. This can be done through data analysis, root cause analysis, or expert opinions. The causes can then be prioritized based on their significance and impact on the problem.
- Relationships: Fishbone diagrams also allow for the identification of relationships between different causes. This can be represented by connecting lines or arrows, showing how one cause may influence or interact with another cause. Understanding these relationships helps in developing effective strategies and solutions.
By utilizing these key components, fishbone diagrams enable a structured approach to problem-solving and aid in the identification of root causes. They promote collaboration and facilitate a deeper understanding of complex problems, ultimately leading to more informed decision-making and improved outcomes.
Part2. Methodology of Fishbone Diagrams
The cause-and-effect fishbone diagrams are useful tools for analyzing the potential causes of a problem or effect. They provide a visual representation of the various factors that can contribute to a specific issue and help in identifying the root causes.
Steps to Construct a Cause-and-Effect Fishbone Diagram
- Identify the problem or effect: Begin by clearly stating the specific problem or effect that needs to be analyzed. This will serve as the starting point for constructing the cause-and-effect fishbone diagram.
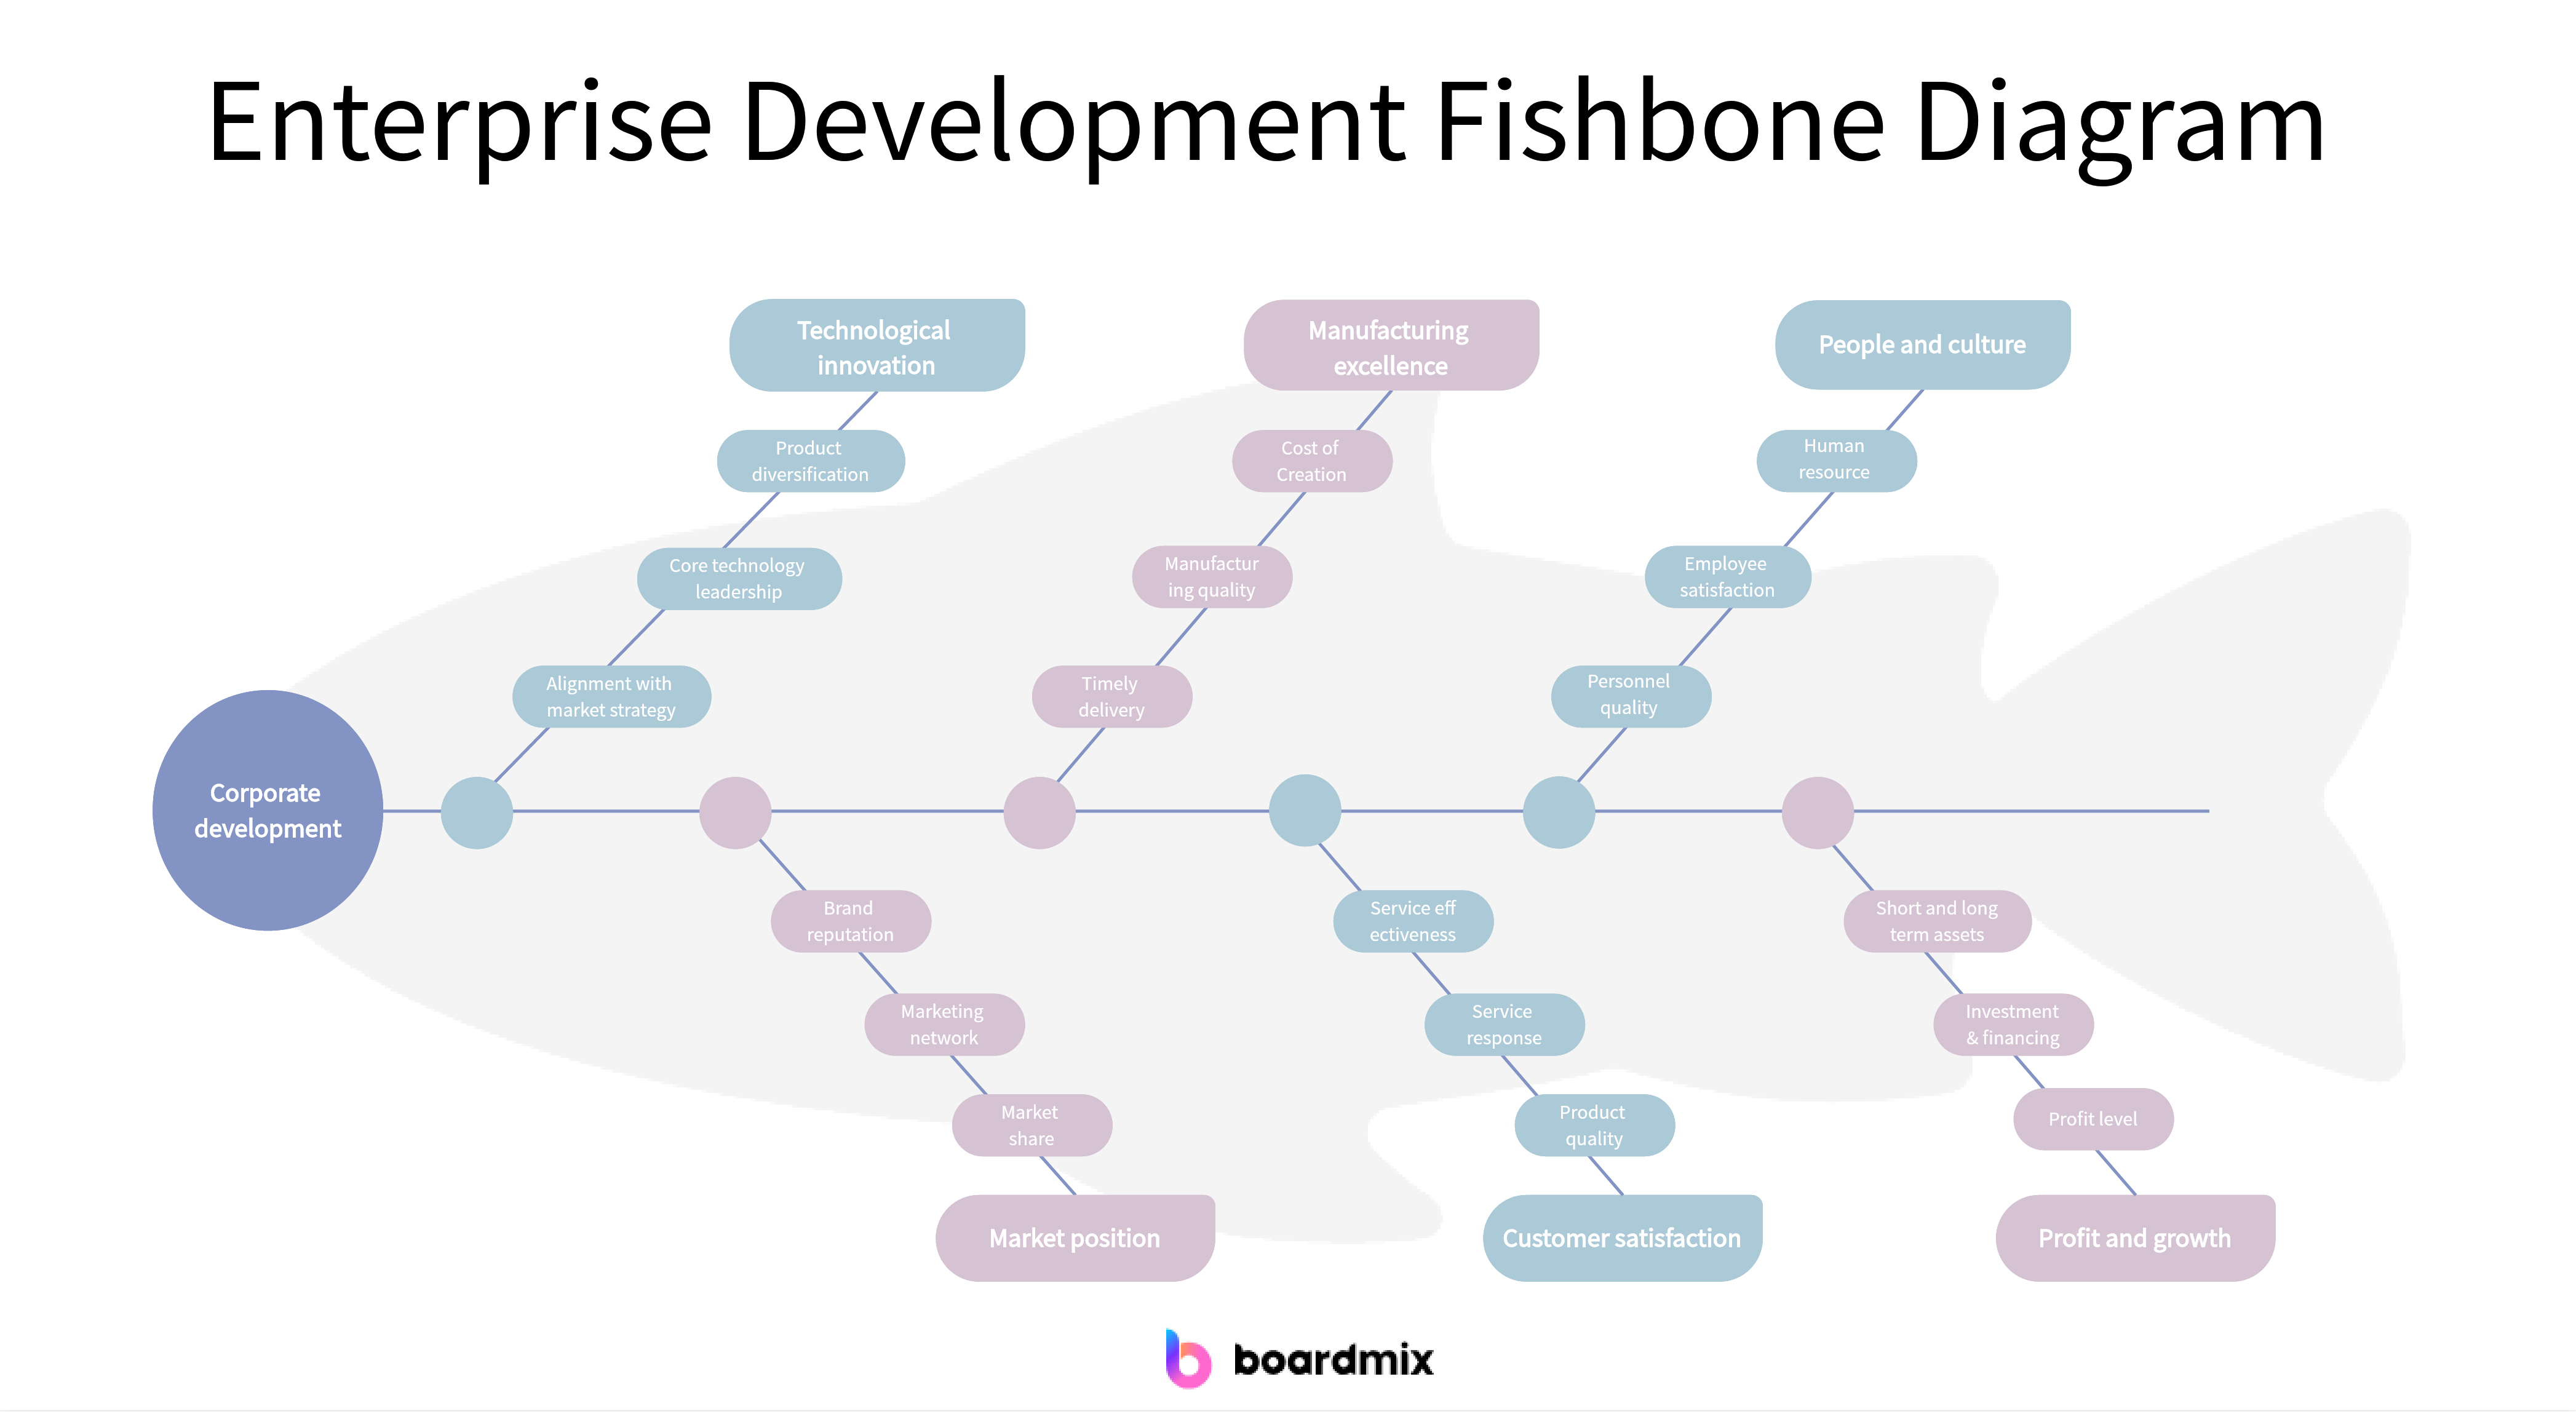
- Determine categories: Identify the major categories or factors that could potentially contribute to the problem. These categories are often represented by the 6 M's: Manpower, Machine, Material, Method, Measurement, and Environment. Other categories may be relevant depending on the nature of the problem.
- Brainstorm causes: Under each category, brainstorm and list all possible causes that could contribute to the problem. Encourage input from a team or individuals with different perspectives and expertise to ensure a comprehensive list.
- Analyze and prioritize causes: Once the causes have been identified, analyze them further to determine their likelihood of contributing to the problem. This can be done through data analysis, root cause analysis, or expert opinions. Consider factors such as frequency, impact, and feasibility when prioritizing the causes.
- Draw the diagram: Draw the fishbone diagram by connecting each cause to its respective category using lines or arrows. This visually represents the relationships between different causes and their respective categories.
- Review and refine: Review the fishbone diagram with the team or individuals involved in the analysis process. Make adjustments or additions as necessary to ensure accuracy and completeness.
How the Fishbone Diagram Reveals Core Issues
The fishbone diagram helps in revealing core issues by visually organizing and categorizing the potential causes of a problem. By analyzing the relationships between different causes and their respective categories, it becomes easier to identify the most influential factors or root causes.
The diagram allows for a systematic approach to problem-solving and promotes collaboration among team members. It provides a comprehensive view of the problem, which aids in understanding the complexity of the issue at hand.
By utilizing a fishbone diagram, organizations can gain insights into the underlying causes of problems and make more informed decisions on how to address them effectively. The diagram helps in focusing efforts on tackling the root causes rather than just treating the symptoms, leading to long-term solutions and improved outcomes.
Fishbone diagrams provide a structured methodology for cause analysis and aid in identifying core issues. By following the steps outlined above, organizations can leverage this tool to improve problem-solving capabilities and drive positive change.
Part3. Cause and Effect Fishbone Diagrams Example
Ishikawa diagrams are useful tools for analyzing the causes of quality issues or problems in a process or product. The fishbone diagram helps to identify potential causes and their relationships to the quality issue. Here is an example of how a Quality Analysis Fishbone Diagram can be used.
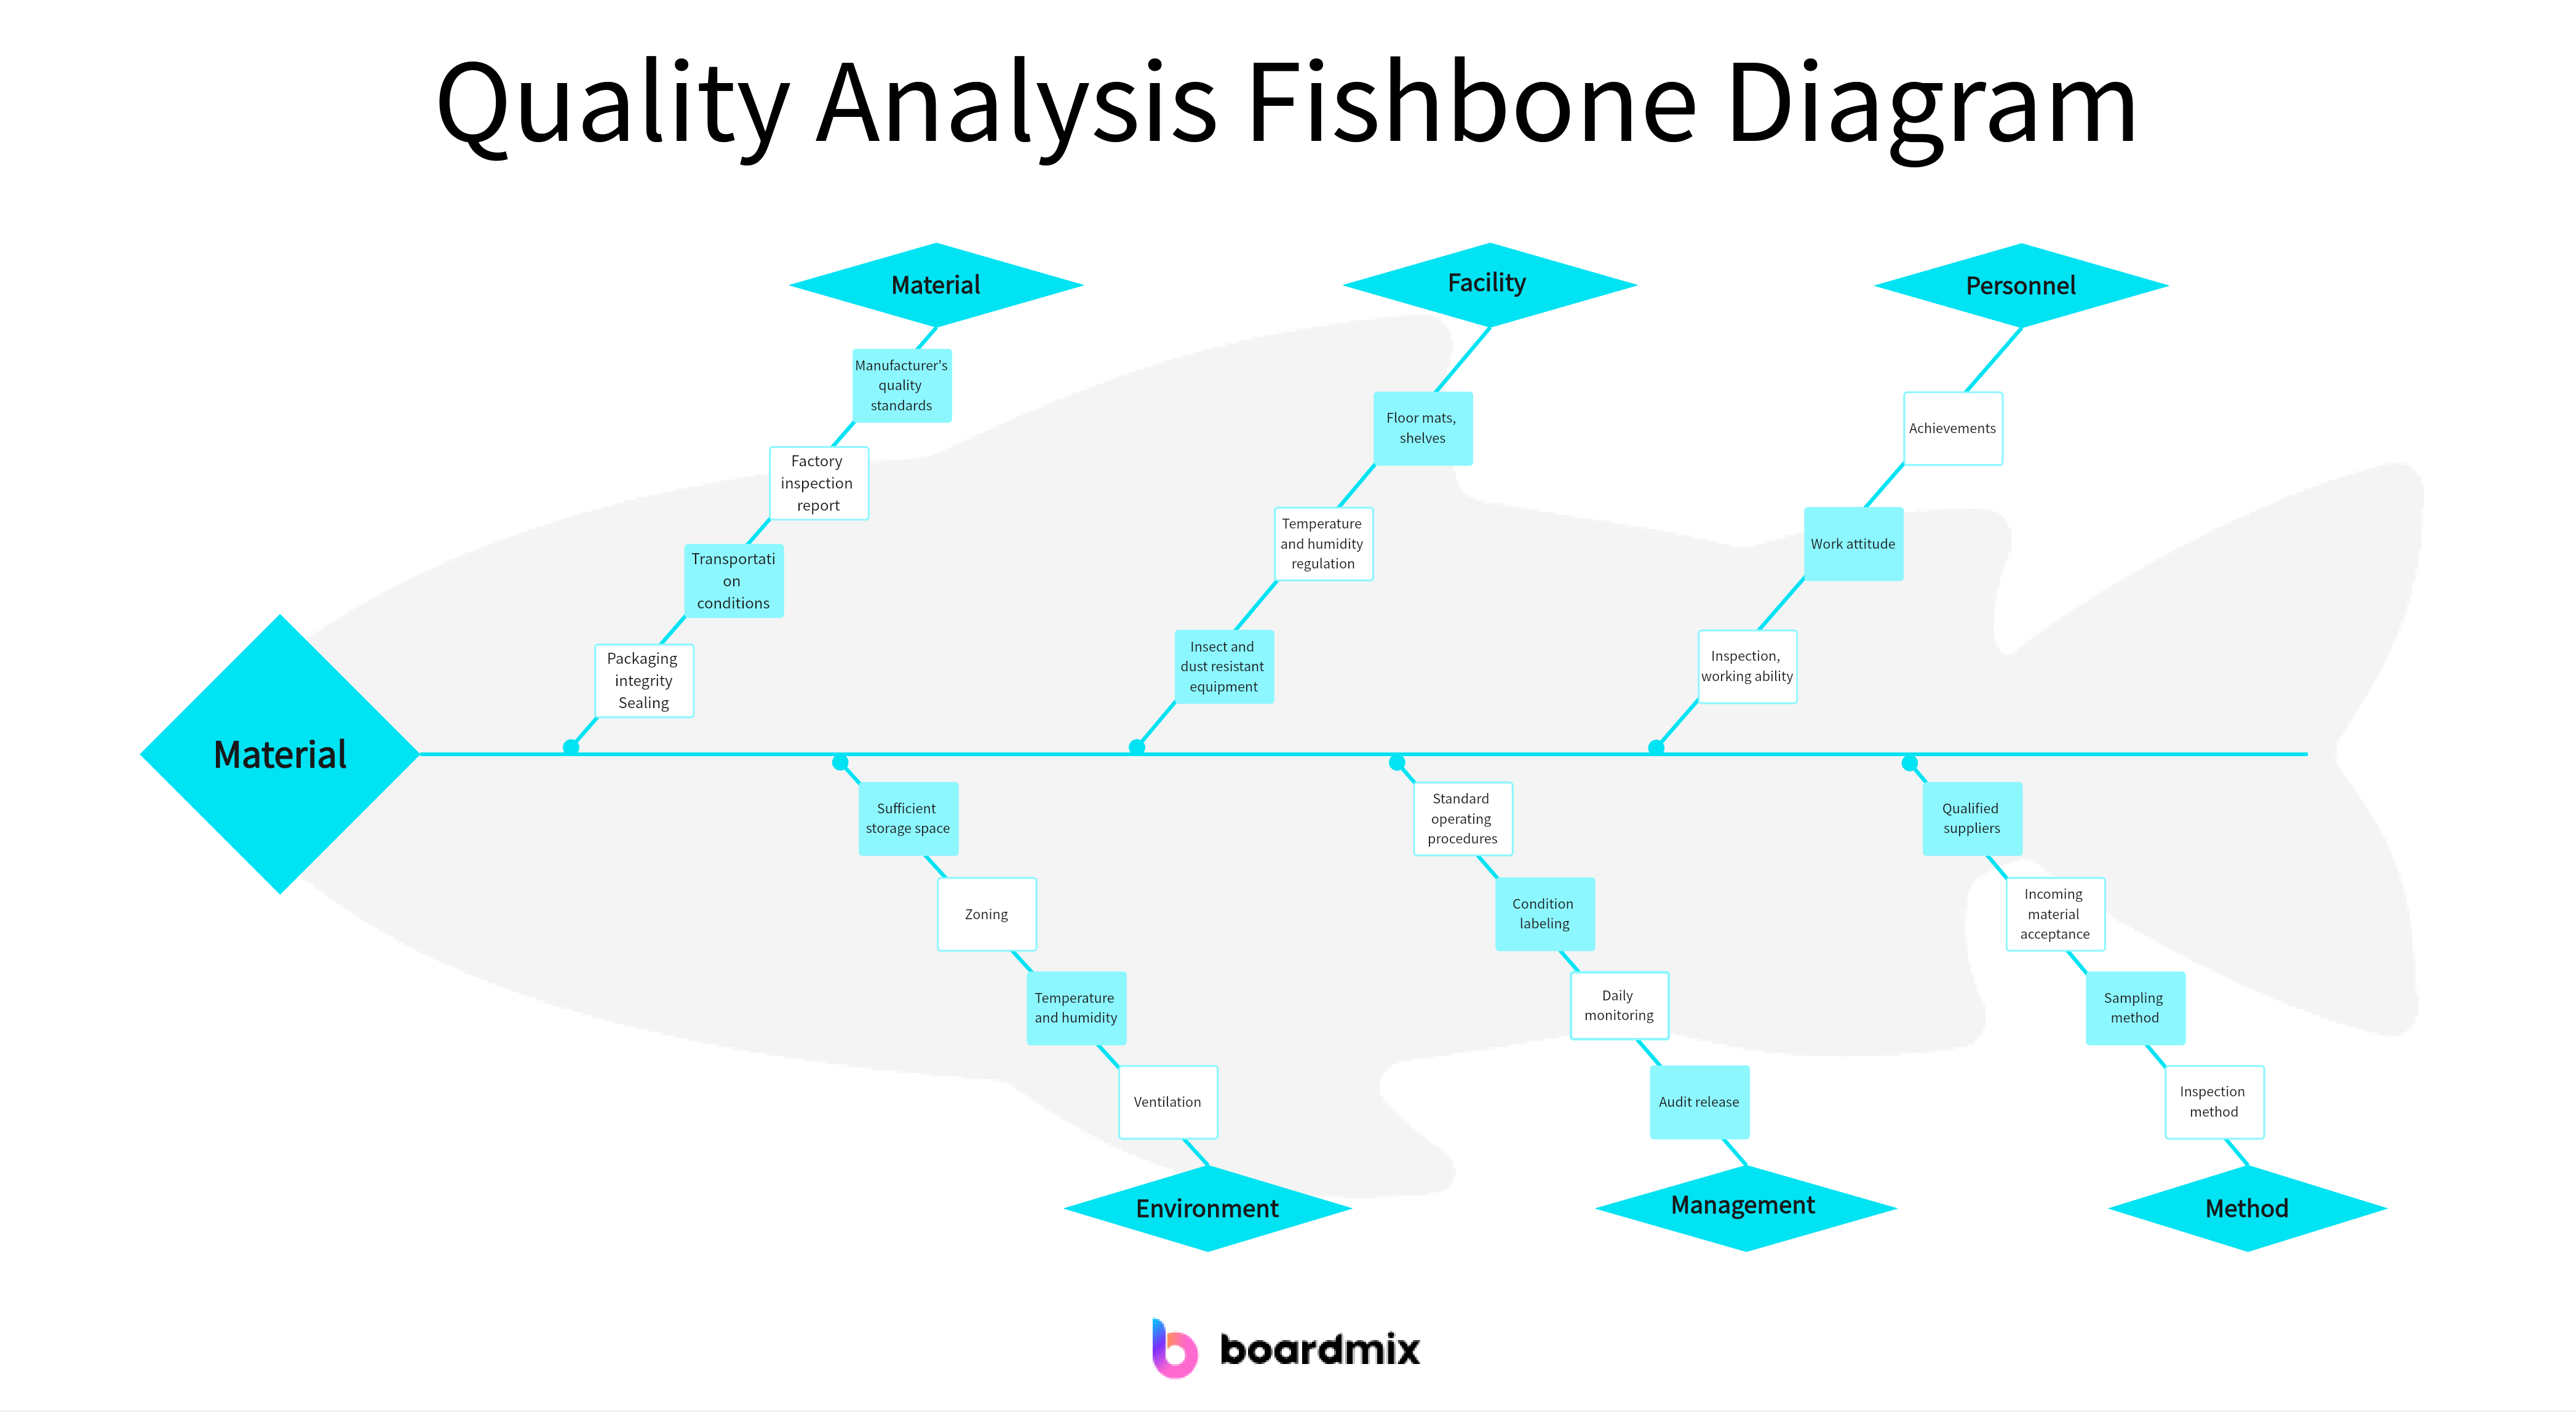
- Quality Issue: Start by identifying the quality issue or problem that needs to be analyzed. This could be a defect, error, or any other quality-related issue.
- Major Categories: Create the main branches of the fishbone diagram, representing the major categories of potential causes. Common categories include People, Methods, Machines, Materials, Measurements, and Environment. These categories are often referred to as the 6Ms.
- Causes: Under each major category, identify the specific causes or factors that could contribute to the quality issue. For example, under the People category, causes could include lack of training, inadequate skills, or poor communication. Under the Methods category, causes could include incorrect procedures, lack of standardization, or outdated processes.
- Sub-causes: For each cause identified, you can further break it down into sub-causes or contributing factors. This helps to identify the root causes of the quality issue. For example, if the cause is lack of training, sub-causes could include budget constraints, time constraints, or lack of access to training resources.
- Analysis: Once all the causes and sub-causes have been identified, analyze their relationships to the quality issue. Determine which causes are most likely to contribute to the problem and prioritize them for further investigation or action.
- Solutions: Based on the analysis, develop appropriate solutions or actions to address the identified causes and improve the overall quality. These solutions can be implemented to prevent future occurrences of the quality issue.
Remember, this is just one example of how a Quality Analysis Fishbone Diagram can be used. The key is to adapt the diagram to the specific quality issue and customize the categories and causes accordingly.
By applying the Fishbone Diagram to quality analysis, organizations can gain a better understanding of the root causes of quality issues and take proactive measures to improve their processes and products.
Part4: Tips for Fishbone Diagrams to Uncover Core Issues
When creating cause-and-effect fishbone diagrams to uncover core issues, here are some additional tips to consider:
- Dig deeper into the problem statement: Make sure your problem statement is specific and clear. This will help you uncover the underlying core issues more effectively.
- Use a collaborative approach: Engage a diverse group of stakeholders or subject matter experts to brainstorm causes and potential core issues. Different perspectives can lead to a more comprehensive analysis.
- Consider the external environment: Explore external factors that may be contributing to the quality issue. This can include economic, social, or political influences that may have an impact on your organization or industry.
- Look for patterns and trends: Analyze the causes and their relationships on the fishbone diagram to identify patterns or trends. This can help you pinpoint the core issues that are most critical to address.
- Prioritize core issues: Once you have identified the core issues, prioritize them based on their significance and potential impact on the overall quality. This will guide your problem-solving efforts and ensure that resources are allocated effectively.
- Validate core issues: Validate the identified core issues through data analysis, customer feedback, or other reliable sources of information. This will provide evidence to support your analysis and ensure that you are addressing the right problems.
- Develop targeted solutions: Develop solutions or actions that specifically address the core issues. These solutions should be focused and tailored to effectively resolve the underlying problems.
- Monitor progress and adjust: Implement the solutions and regularly monitor their progress. Evaluate whether the core issues have been effectively resolved or if further adjustments are needed.
By following these additional tips, you can enhance your cause-and-effect fishbone diagram analysis and uncover the core issues that need to be addressed for improved quality.
Conclusion
In the pursuit of comprehensive analysis and effective problem-solving, uncovering core issues stands as a pivotal step, in guiding organizations toward sustainable solutions. Boardmix, with its commitment to optimizing process visualization, presents an ideal platform for harnessing the power of Fishbone Diagrams. The integration of these diagrams into the Boardmix toolkit enhances the depth and precision of analyses, providing a holistic understanding of the factors influencing a given scenario. Embrace the potential within Boardmix, and let the visual prowess of Fishbone Diagrams guide your journey towards unparalleled insights and sustainable problem resolution.


