


Architecture diagrams are essential tools in the field of design and development, providing a visual representation of the structure, components, and relationships within a system. These diagrams help architects, developers, and stakeholders to understand, communicate, and make informed decisions about the design and implementation of a system. In this article, we will explore different types of architecture diagrams and discuss when to use each type.
Part 1. What Is an Architecture Diagram?
An architecture diagram is a visual representation that illustrates the structure, components, and relationships within a system or application. It provides a high-level view of the system's design and helps stakeholders, including architects, developers, and non-technical individuals, to understand the overall architecture and key components of a software solution.
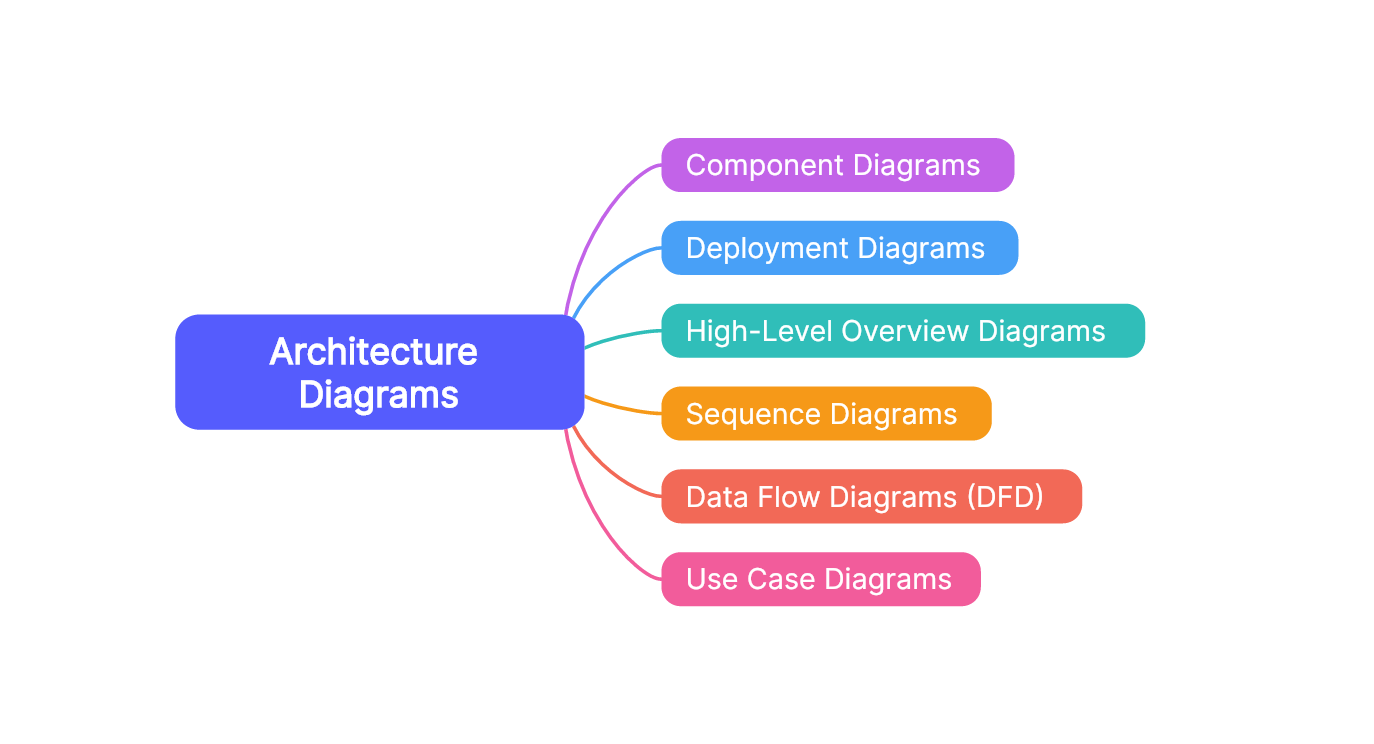
Part 2. 6 Types of Architecture Diagrams
In this part, we will deeply look into 6 different types of architecture diagrams and when to use these architecture diagrams.
1. High-Level Overview Diagrams
Description: A High-Level Overview Diagram, also known as a system context diagram, provides a comprehensive bird's-eye view of an entire system. It outlines the system's scope, boundaries, and external interactions with other entities or systems. This type of architecture diagram is often used at the initial stages of a project to communicate the fundamental components and their relationships. High-Level Overview Diagrams are instrumental in obtaining stakeholder buy-in, defining system boundaries, and establishing a clear understanding of the system's context within its environment.
When to Use: Use these diagrams during the initial stages of a project to communicate the system's scope, boundaries, and its relationships with external entities. High-level diagrams are beneficial in obtaining stakeholder buy-in and understanding system boundaries.
2. Component Diagrams
Description: A Component Diagram is a type of architecture diagram that illustrates the high-level structure of a system by depicting its modular components and their relationships. Components in this context represent modular and reusable parts of a system, such as classes, packages, or modules. The diagram uses various symbols to represent these components, including rectangles for components, interfaces, and connectors to show relationships.
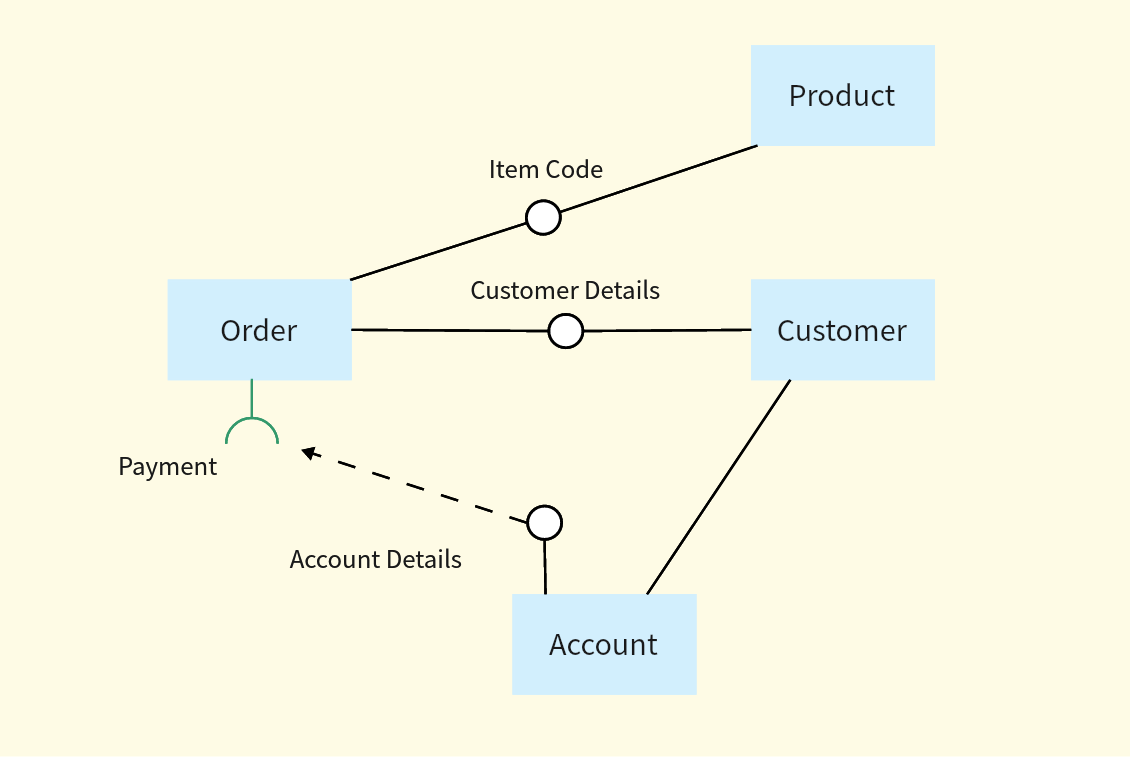
The main purpose of a Component Diagram is to provide a visual representation of the organization and dependencies between different modules or components within a software system. It helps software developers, architects, and stakeholders understand the overall structure of the system, facilitating communication and collaboration during the design and development phases of a project. Component Diagrams are particularly useful in modularizing complex systems, promoting reusability, and supporting the maintenance and scalability of software applications.
When to Use: Utilize component diagrams when you need to emphasize the organization and dependencies between various modules or components within the system. These diagrams are helpful for developers to understand the overall structure and relationships.
3. Deployment Diagrams
Description: A Deployment Diagram is a type of architecture diagram that focuses on illustrating the physical deployment of software components within a system. It provides a visual representation of how software artifacts, such as modules or components, are mapped to hardware components like servers or devices in a real-world environment. Deployment Diagrams help in understanding the distribution and configuration of software and hardware elements in a network.
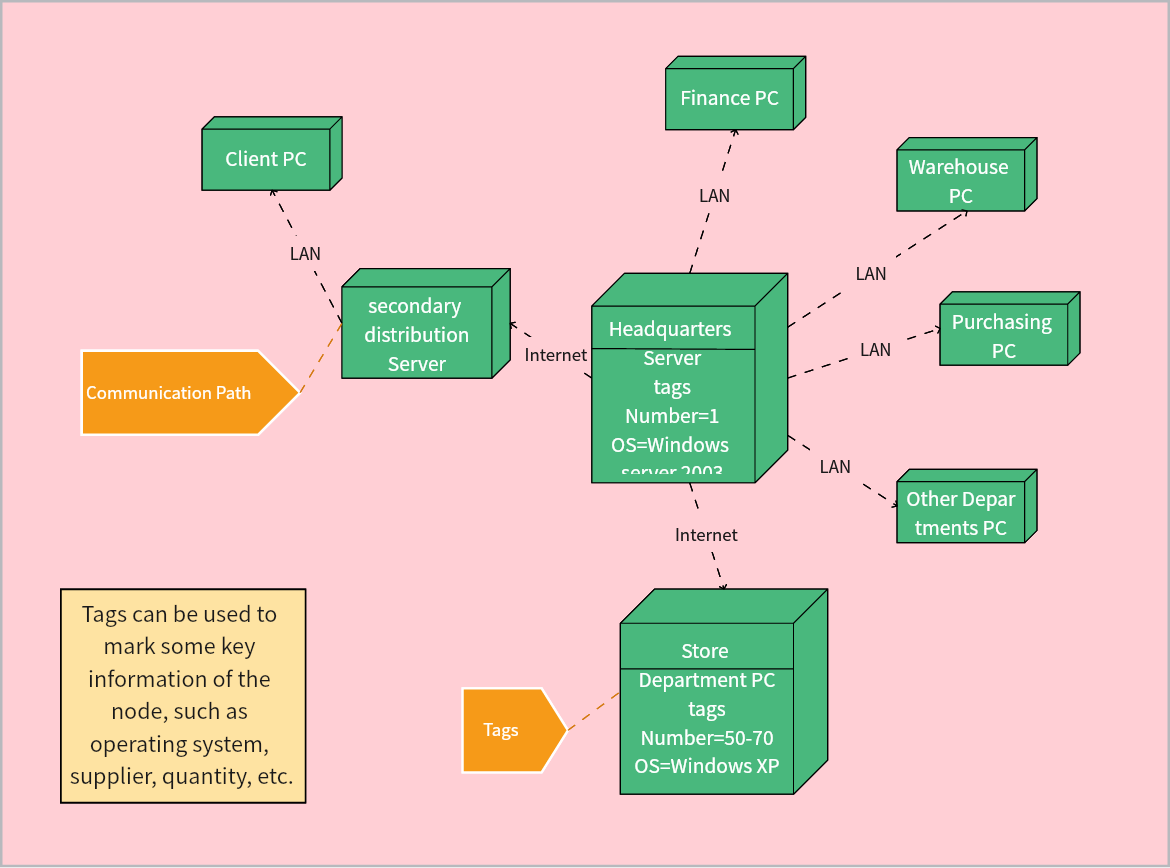
Key elements in a Deployment Diagram include nodes, which represent hardware devices or processing units, and artifacts, representing software components or modules. Deployment diagrams can also depict the relationships and dependencies between nodes and artifacts.
The primary purpose of a Deployment Diagram is to assist in planning and visualizing the physical infrastructure of a system, especially in scenarios involving distributed systems, cloud computing, or edge computing. It aids in ensuring that the deployment of software components aligns with the intended hardware architecture, facilitating efficient resource utilization and system performance. Deployment Diagrams are valuable tools for system architects, developers, and system administrators during the design and implementation phases of a project.
When to Use: Use deployment diagrams when planning the physical infrastructure for a system, especially in scenarios involving distributed systems, cloud computing, or edge computing.
4. Sequence Diagrams
Description: A Sequence Diagram is a type of interaction diagram in UML (Unified Modeling Language) that illustrates the interactions and messages exchanged between different objects or components within a system over a specific period of time. It visually represents the dynamic behavior of a system by showing the sequence of interactions among various entities.
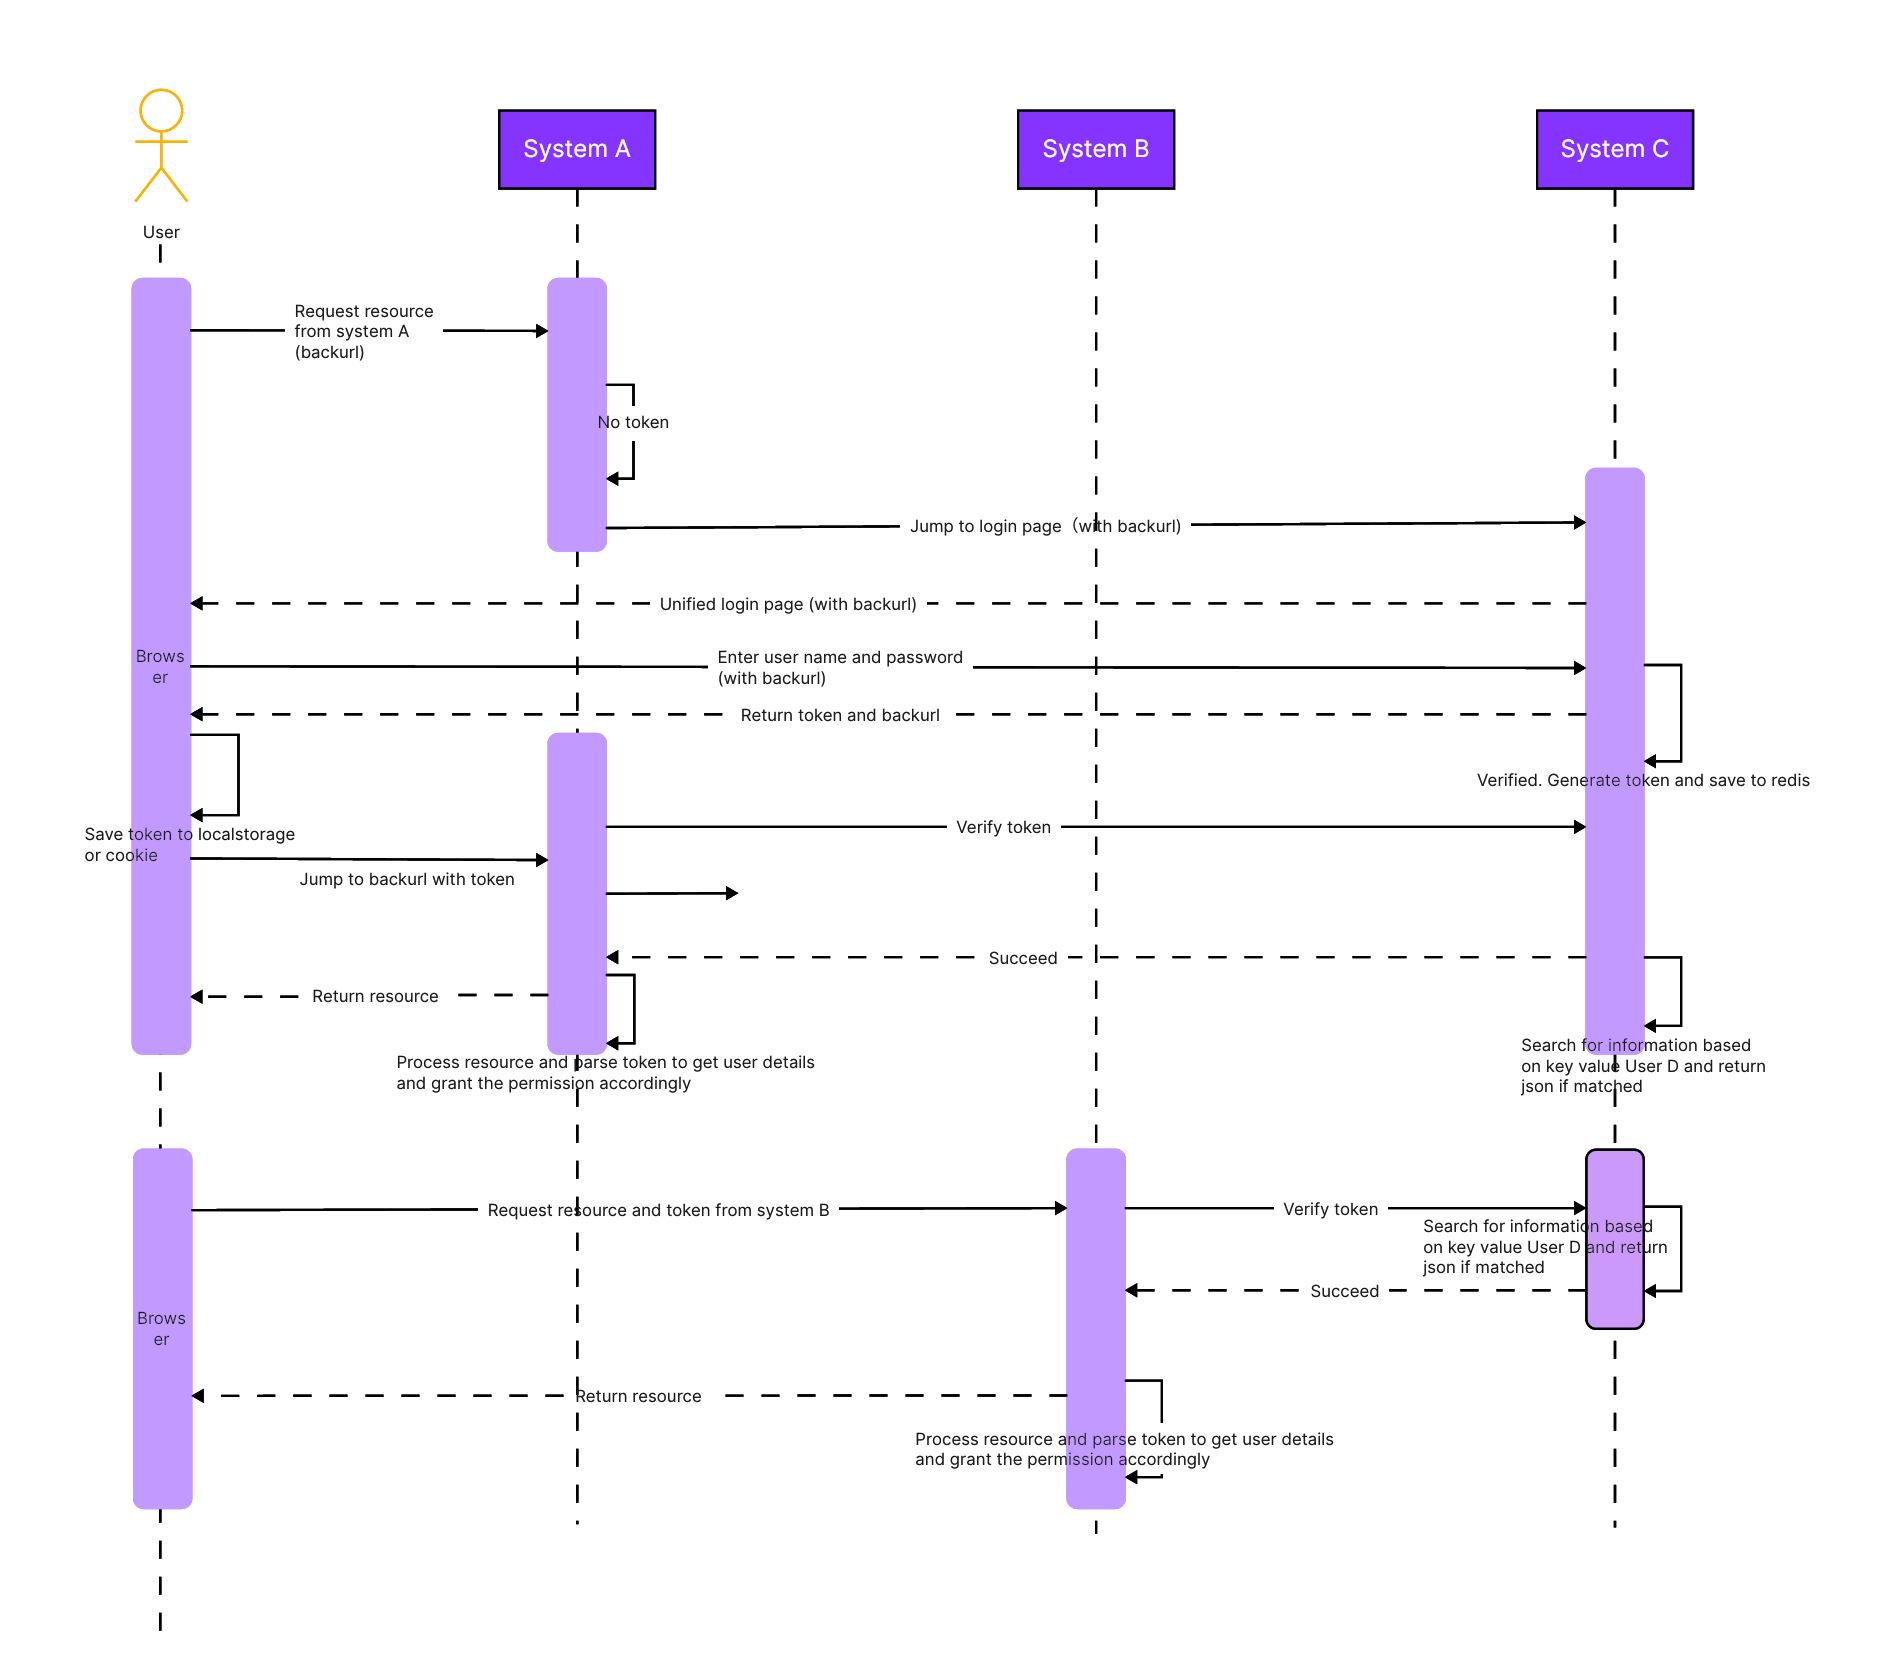
Key elements in a Sequence Diagram include:
- Objects or Participants: Represent entities or components involved in the interaction.
- Lifelines: Vertical dashed lines corresponding to the lifespan of each object or participant.
- Messages: Horizontal arrows indicating the flow of messages between objects, depicting the order and nature of interactions.
- Activation Bars: Rectangles along the lifelines representing the time during which an object is active and processing a message.
When to Use: Sequence diagrams are particularly useful during the design phase when you want to visualize and understand the dynamic aspects of how components interact in a specific scenario or use case.
5. Use Case Diagrams
Description: A Use Case Diagram is a type of behavioral diagram in UML (Unified Modeling Language) that illustrates the interactions between actors (users or external systems) and a system under various scenarios or use cases. It provides a high-level view of the functional requirements of a system and how different actors interact with it to achieve specific goals.
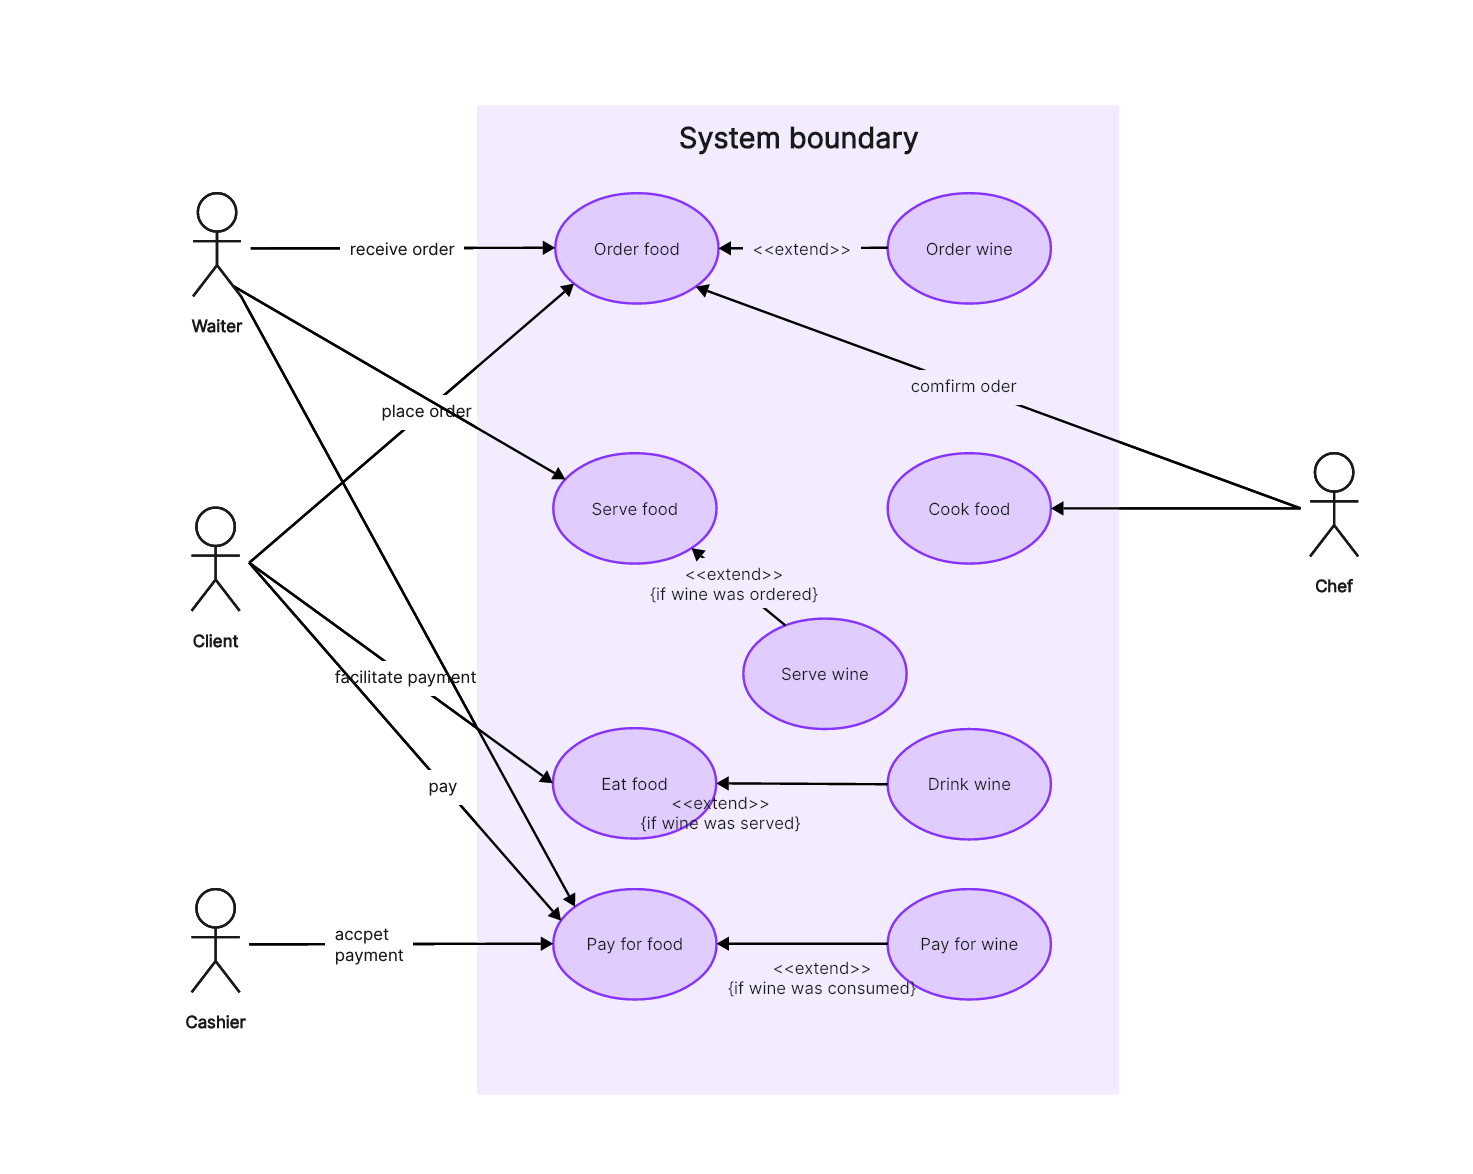
Key components of a Use Case Diagram include:
- Actors: Represent external entities, such as users or other systems, interacting with the system.
- Use Cases: Represent specific functionalities or behaviors of the system. Each use case describes a particular way the system responds to a request from an actor.
- Associations: Connect actors to the use cases they are involved in, depicting the relationships and interactions between them.
- System Boundary: A boundary box that encapsulates the system and defines its scope in relation to external actors.
When to Use: Employ use case diagrams during requirements gathering and analysis to identify and describe the different ways users interact with the system. They are beneficial for capturing high-level user requirements.
6. Data Flow Diagrams (DFD)
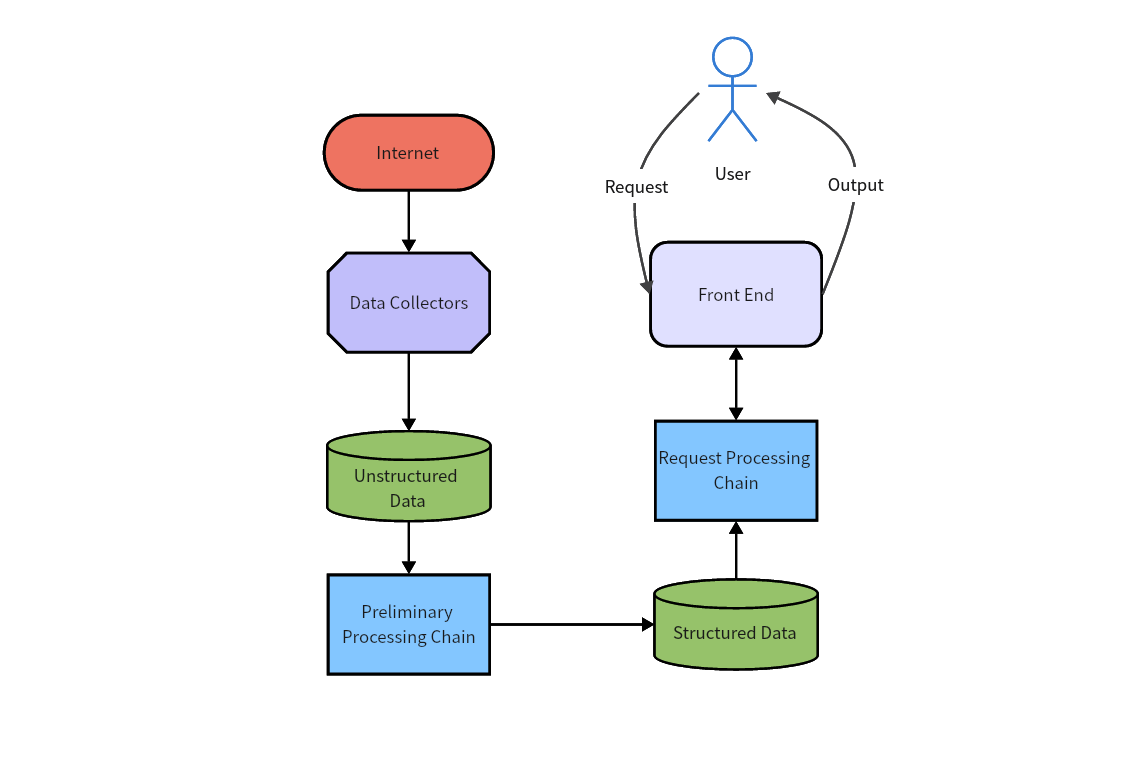
Description: A Data Flow Diagram (DFD) is a visual representation that depicts how data flows within a system. It is a type of structured analysis and design tool used in software engineering to model the processes that manipulate data, the data stores where data is held, the external entities that interact with the system, and the data flows between these components.
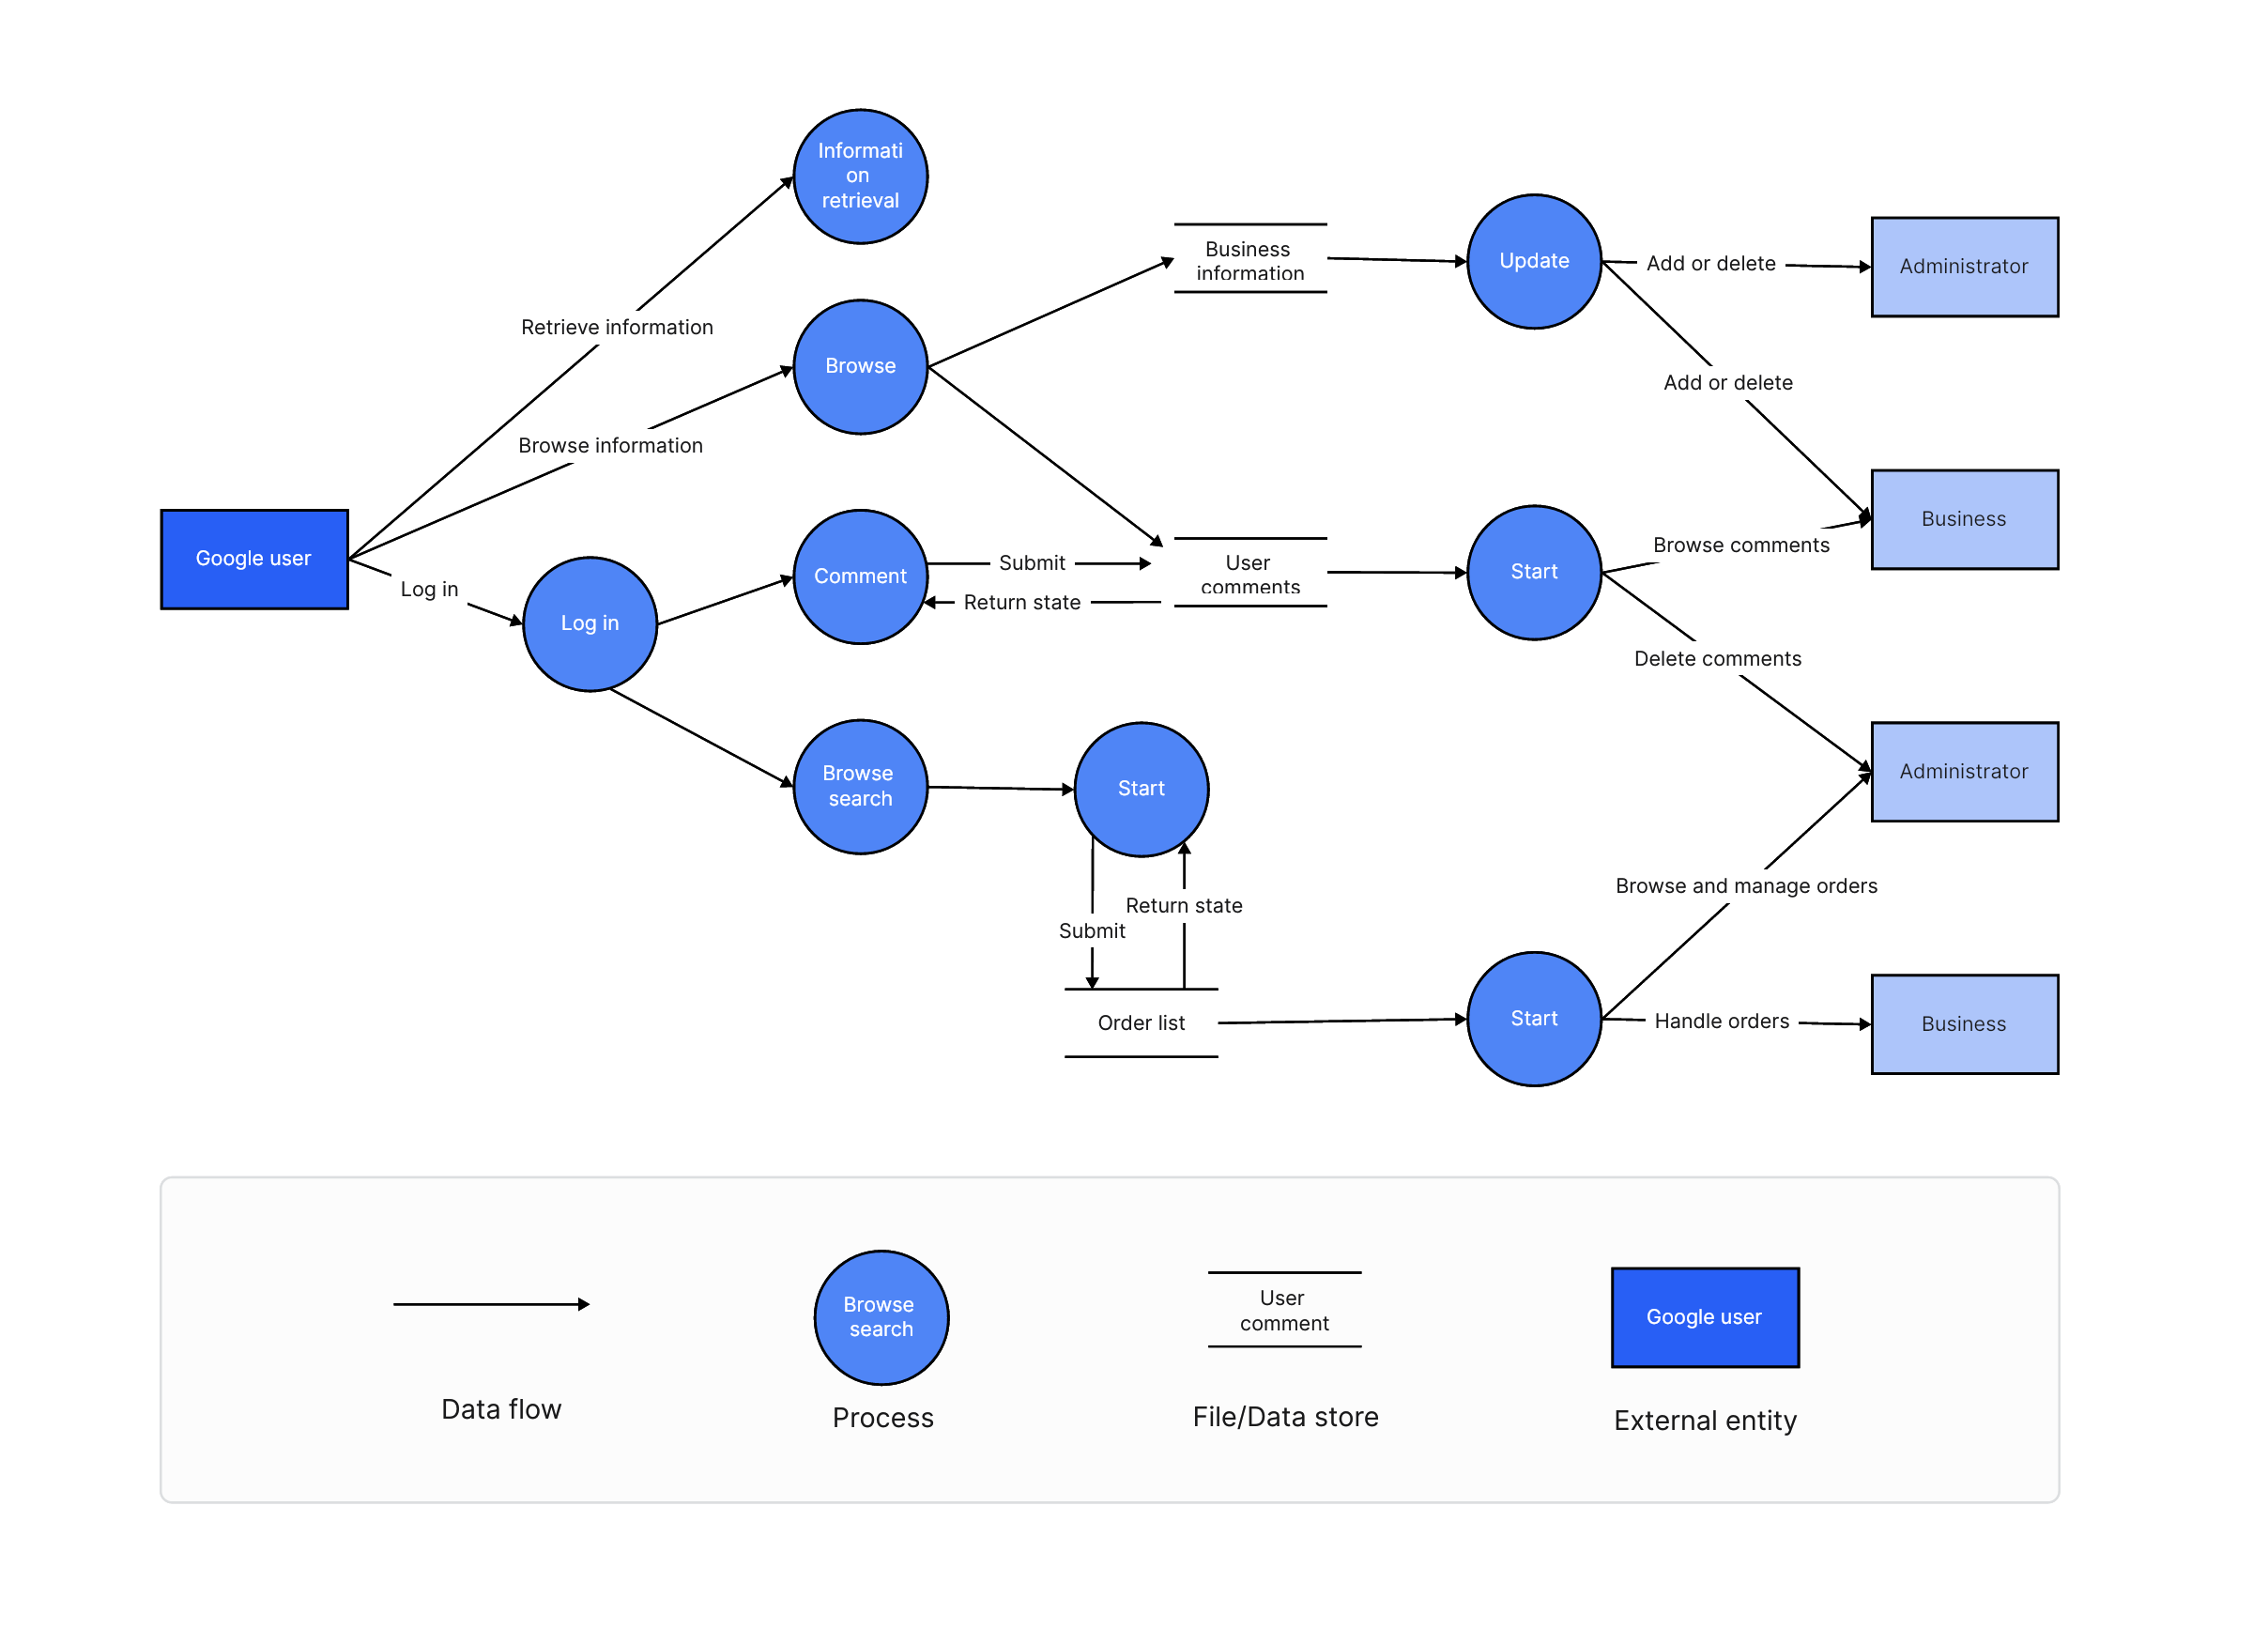
Key elements of a Data Flow Diagram include:
- Processes: Represent activities or functions within the system that manipulate data.
- Data Stores: Depict where data is stored within the system.
- Data Flows: Arrows representing the movement of data between processes, data stores, and external entities.
- External Entities: Represent external systems, users, or sources/sinks of data that interact with the system.
Data Flow Diagrams help in visualizing and understanding how data moves through a system, making them particularly useful during the analysis phase of system development. They are effective tools for capturing the data requirements of a system, identifying processes that act on the data, and illustrating the relationships between different components.
DFDs come in different levels of detail, ranging from a high-level overview to detailed diagrams that provide a deeper understanding of the system's data flow.
When to Use: Use DFDs during the analysis phase to model data flow within the system. They are particularly useful for understanding data processing and identifying potential bottlenecks.
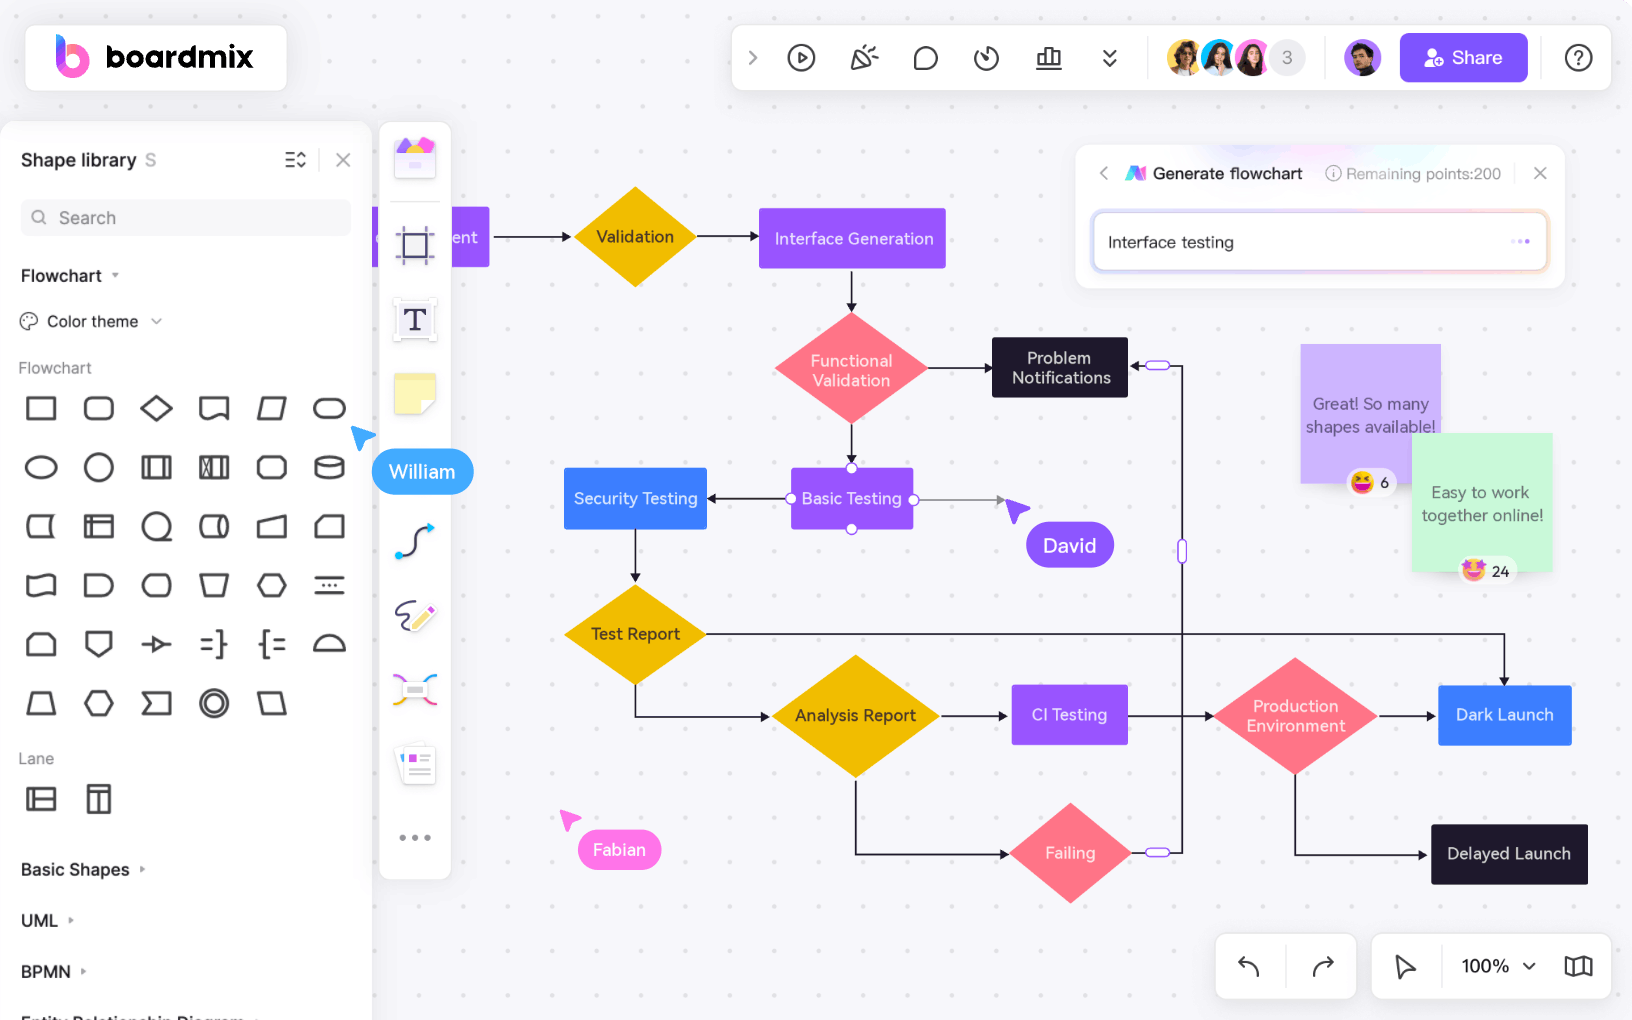
Part 3. Streamline Your Architecture Diagram Creating with Boardmix
Boardmix is a cutting-edge online whiteboard solution designed to revolutionize the way you create architecture diagrams. With an extensive library of customizable templates, Boardmix makes it easy for architects, engineers, and project managers to visualize complex architectural concepts, streamline collaboration, and accelerate decision-making processes. Unlike traditional methods, Boardmix allows you to create detailed architecture diagrams in real-time, enabling teams to work together seamlessly regardless of their geographical location. Whether you're designing a residential building or planning a large-scale urban development project, Boardmix provides the tools you need to bring your ideas to life.
FAQs on Types of Architecture Diagrams
1. What is a conceptual architecture diagram?
A conceptual architecture diagram is a type of architecture diagram that provides a high-level and abstract representation of the overall structure and key concepts of a system. It focuses on the fundamental ideas, principles, and relationships between major components without delving into specific details of implementation.
2. What is functional architecture diagram?
A functional architecture diagram, also known as a functional block diagram, is a type of architecture diagram that focuses on illustrating the high-level functionalities and their interrelationships within a system. It provides a visual representation of the major functions or capabilities of the system and how they are organized to achieve the overall objectives.
3. What is a physical architecture diagram?
A physical architecture diagram is a type of architecture diagram that provides a visual representation of the physical structure and organization of a system. It focuses on illustrating the hardware components, their interconnections, and the deployment of software components on these physical entities. Physical architecture diagrams are essential for understanding how a system is implemented in terms of the actual hardware infrastructure.
Conclusion
Choosing the right type of architecture diagram depends on the specific goals of the project and the information you want to convey. Each type serves a unique purpose, offering insights into different aspects of the system. By selecting and using the appropriate architecture diagram at each stage of development, you can effectively communicate ideas, facilitate collaboration, and make informed decisions throughout the software development life cycle.
And when comes to creating an architecture diagram, Boardmix will be the best choice for diagramming tool. Its various pre-set templates and poweful AI assistant will be surely helpful. Start with the free trial right now!


