

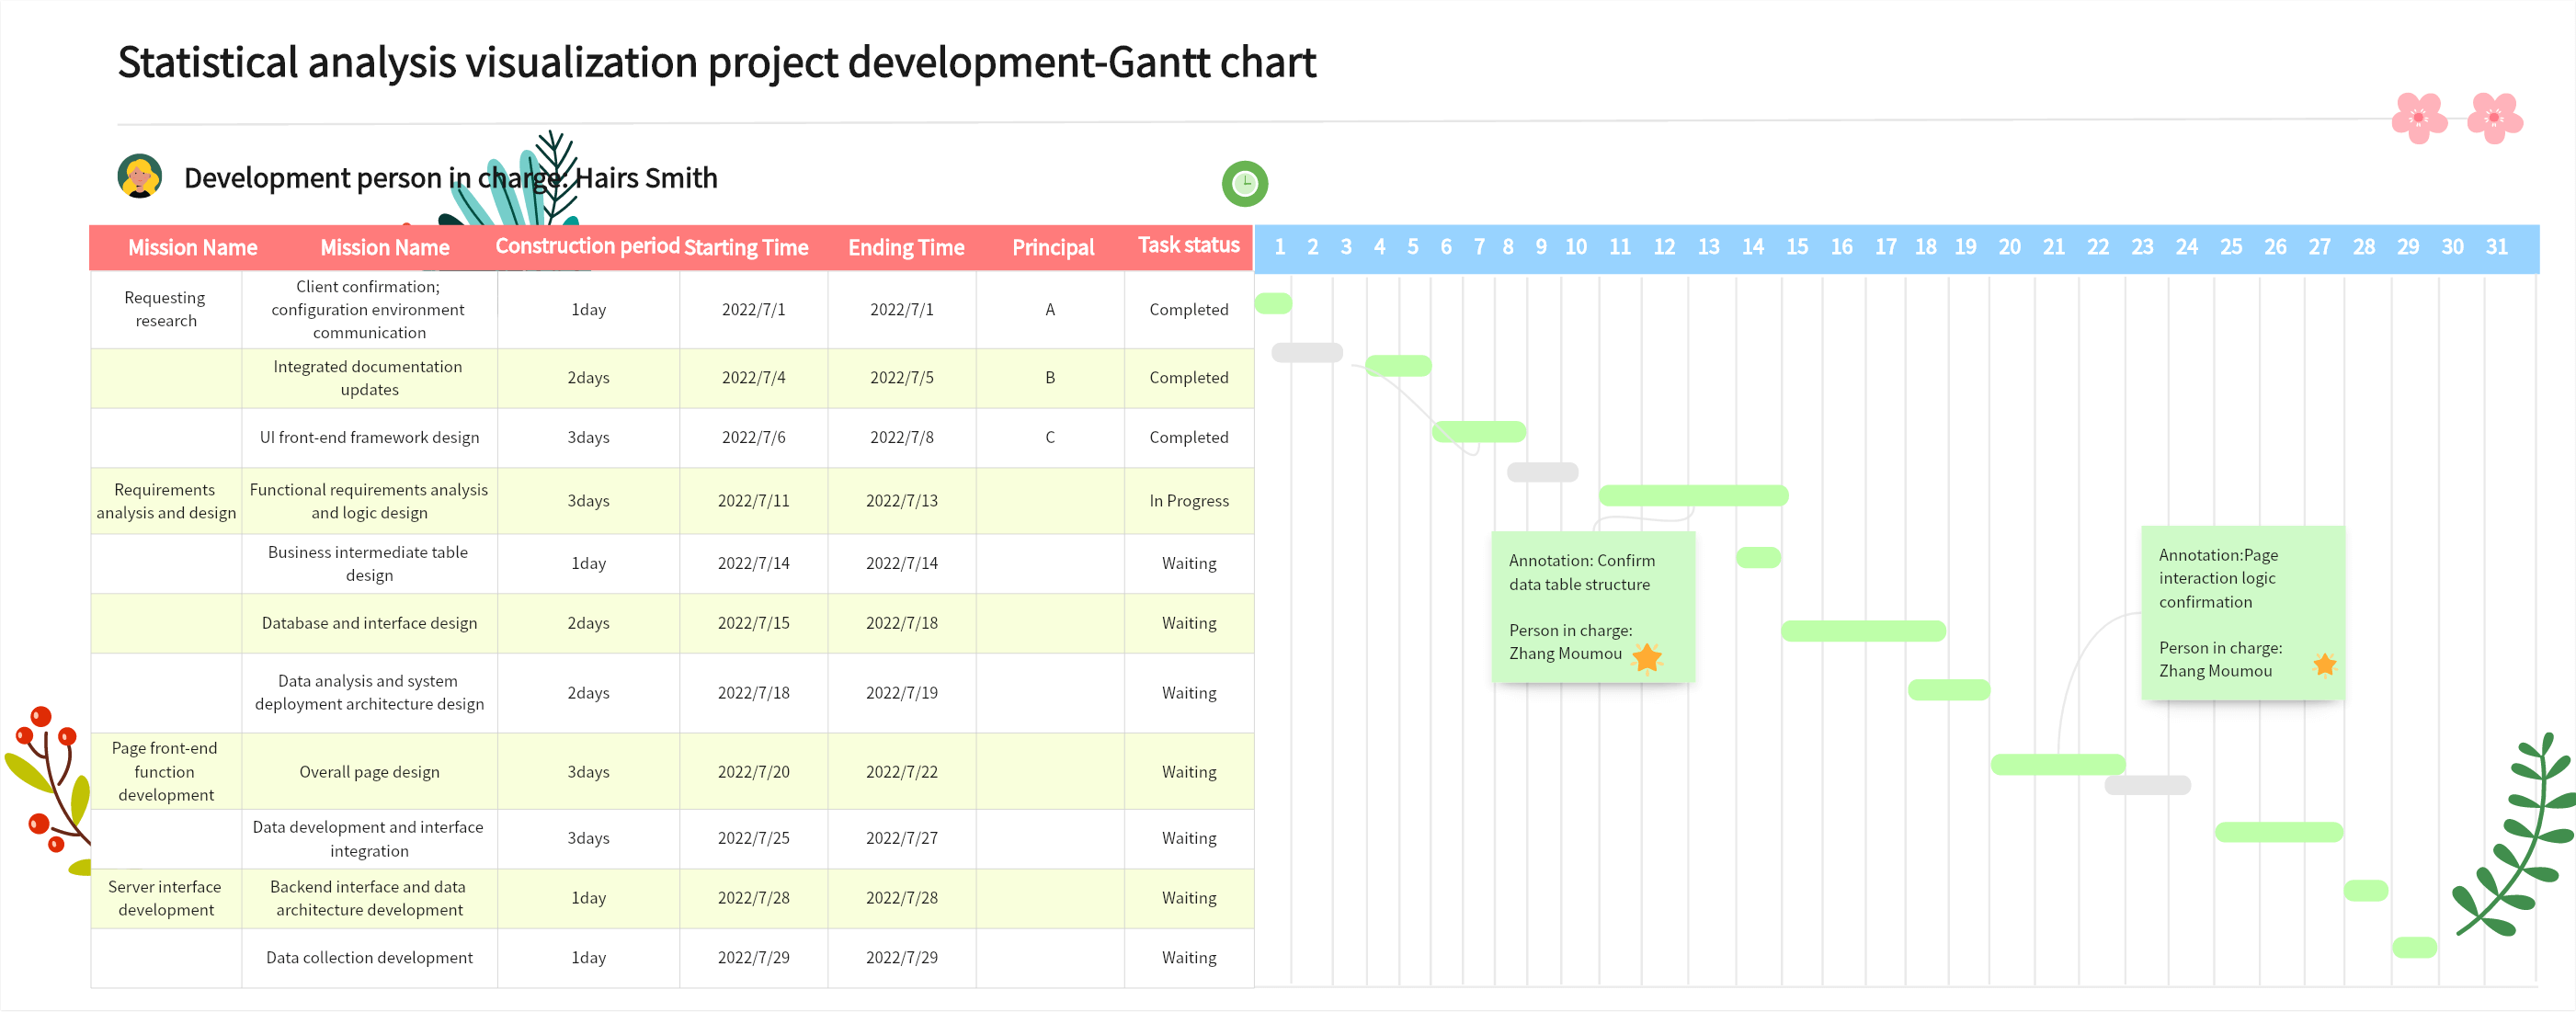
A Gantt chart, also known as a bar chart, is named after its creator, Henry L. Gantt. It graphically represents the sequence and duration of activities for any specific project through a list of activities and a time scale. The horizontal axis represents time, the vertical axis represents activities (projects), and the bars represent the planned and actual progress of these activities over the entire period.
Gantt charts intuitively show when tasks are planned to occur and compare actual progress against the plan. Through Gantt charts, project managers or business administrators can see the current stage of task completion, and the unfinished work, and assess the work progress. This article will guide you on how to draw a Gantt chart using Boardmix for better understanding!
Application of Gantt Charts
Gantt charts are one of the earliest attempts to link activities with time-based on job sequence. They can describe the usage of resources such as work centers and overtime work.
When used for load management, Gantt charts can display the operating and idle conditions of various departments, machines, or equipment. This illustrates the workload of the system, allowing managers to understand what adjustments are appropriate. For instance, if a work center is overloaded, employees from low-load centers can temporarily transfer to increase the workforce; or, if inventory can be processed at different work centers, some tasks from high-load centers can be moved to low-load centers. Versatile equipment can also be transferred between centers.
However, it's important to note that Gantt load charts have limitations and cannot explain production variations such as unexpected machine failures or rework due to human error. Therefore, Gantt scheduling charts are mainly used for checking work progress.
Additionally, Gantt charts are used in:
Project Management
Gantt charts are widely used in modern project management. They allow you to predict outcomes in terms of time, cost, quantity, and quality. They also help you consider manpower, resources, dates, repetitive elements, and key parts of the project. Gantt charts provide a visual representation of task progress and resource utilization.
Other Fields
Today, Gantt charts are not only used in production management but also various fields such as construction, IT software, and automotive industries, due to the development of production and project management.
Advantages of Gantt Charts
-Graphical Summary: Gantt charts provide a clear, graphical summary that is easy to understand.
-Manageable Size: Suitable for small to medium-sized projects, typically involving no more than 30 activities.
-Professional Software Support: Tools like Boardmix allow for easy creation of Gantt charts without worrying about complex calculations and analysis.
How to Create a Gantt Chart?
Creating a Gantt chart involves the following four steps, and we'll use Boardmix to demonstrate. Boardmix is a powerful, free, and user-friendly online whiteboard that supports real-time collaboration.
Step 1: Visit the Boardmix website and create a whiteboard.

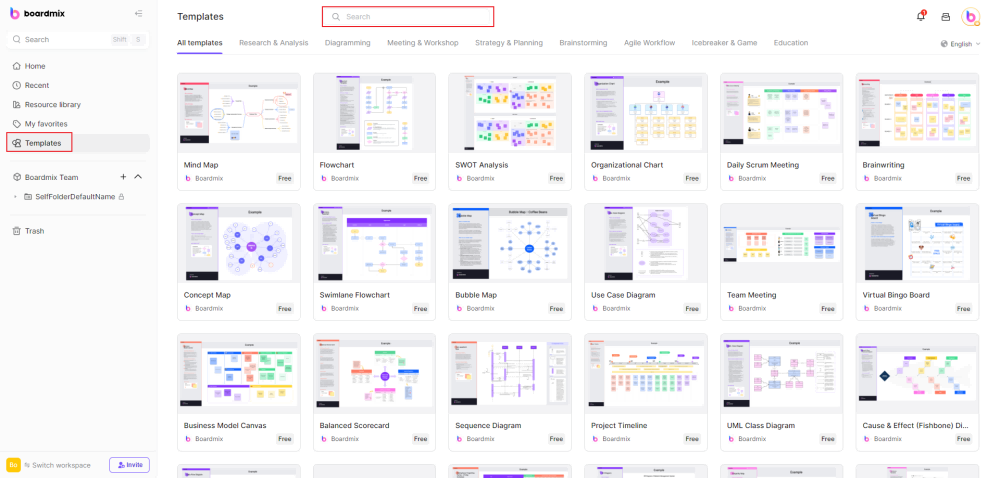
Step 2: Select a Gantt chart template for free or create a new one for easy drawing.
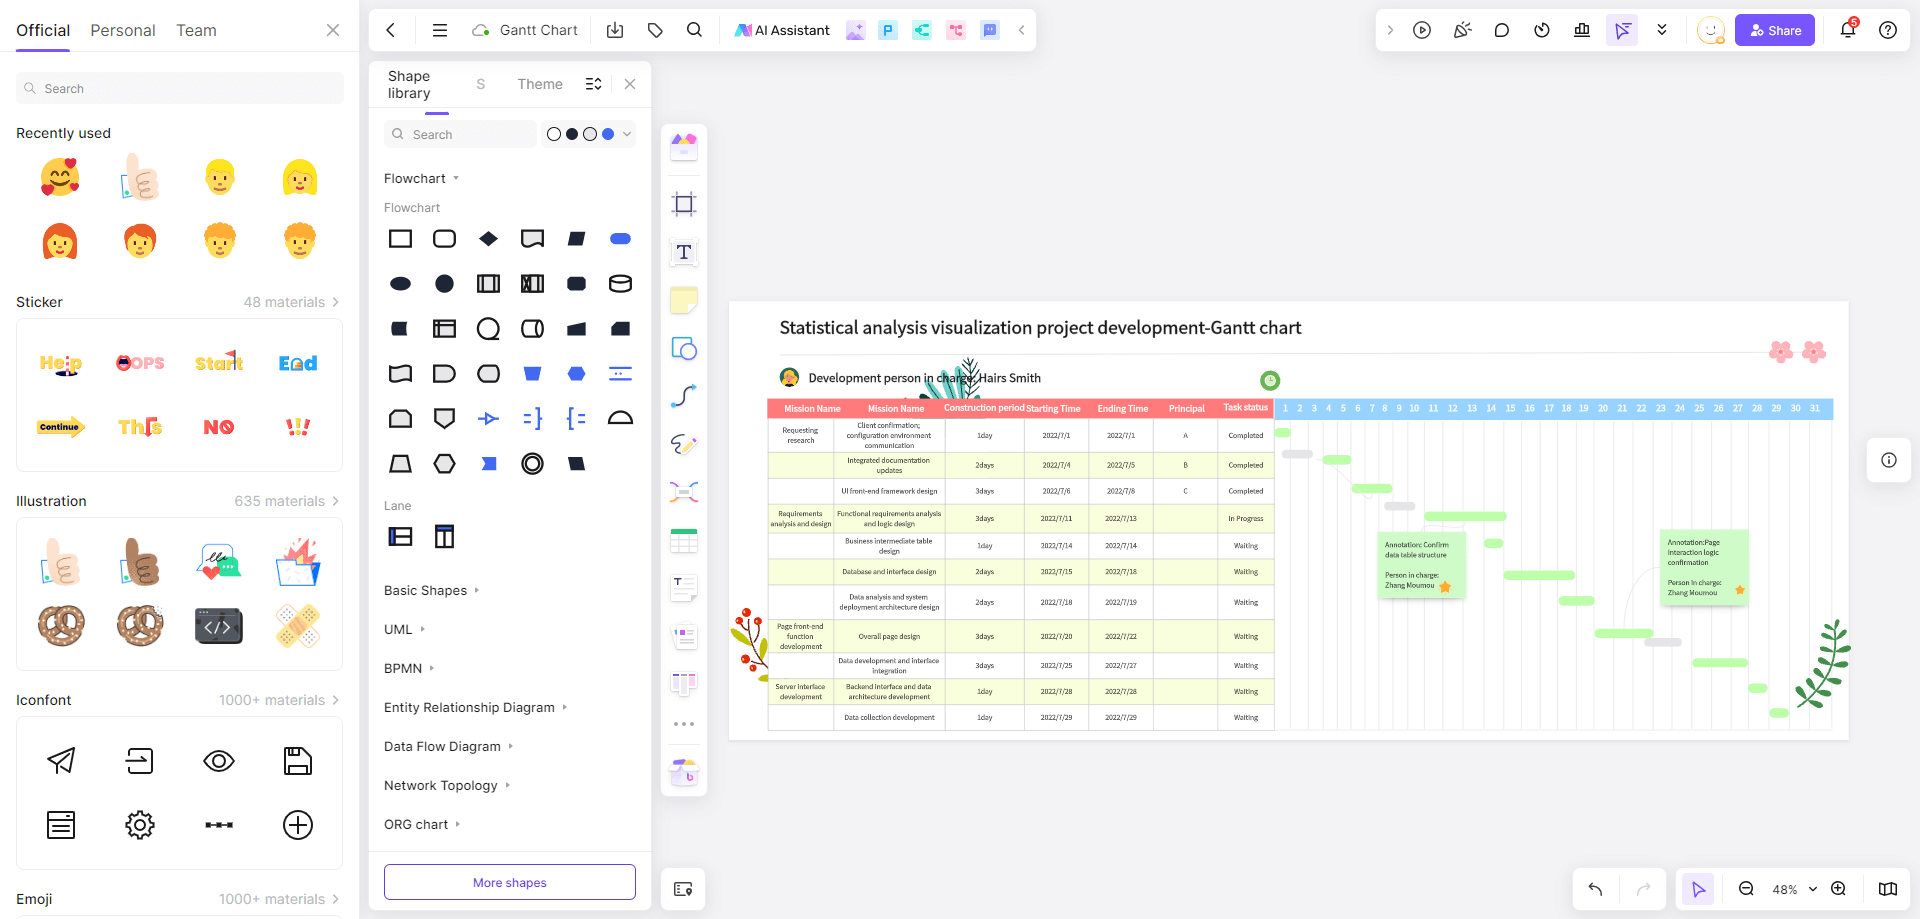
Step 3: Identify all activities involved in the project and edit them into the Gantt chart.
-Include project names (in order), start times, durations, task types (dependent/critical), and dependencies.
-Mark all projects on the Gantt chart according to start times and durations.
-Determine the dependencies and sequence of project activities.
Step 4: Share, save, or export the Gantt chart.
This is a comprehensive guide to Gantt charts. In summary, choosing the right tool can make your work much more efficient! We've provided a detailed tutorial on creating Gantt charts using Boardmix, which should help you understand how to create them. If you're eager to learn and create your own Gantt chart, head over to Boardmix and start drawing now!


