Charts simplify complex information. Whether you're planning a project or analyzing performance data, a clear chart can communicate your ideas faster than a block of text. For teams, charts are even more vital—they keep everyone aligned and on the same page.
But traditional charting tools often fall short. They’re clunky, lack collaboration features, and don’t integrate well with modern workflows. That’s where an online chart creator steps in. It offers flexibility, real-time updates, and access from anywhere. These tools are ideal for professionals and teams who need fast, intuitive, and visually appealing charts.
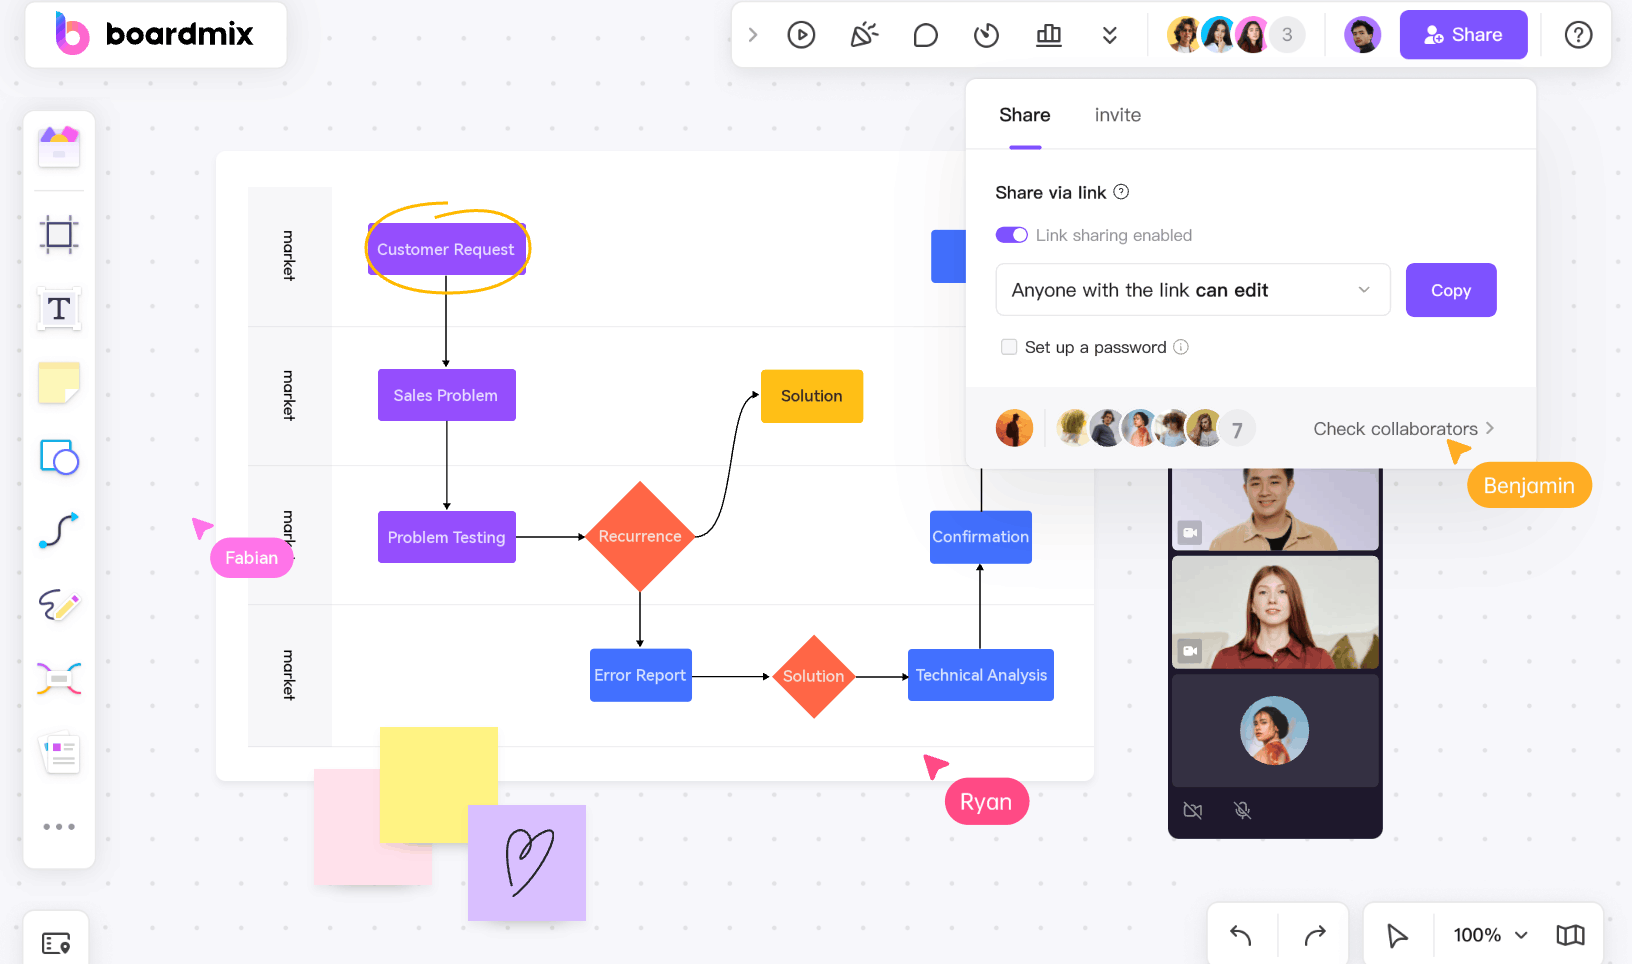
What Makes a Great Online Chart Creator?
Finding the right chart creator can make or break your productivity. But what should you look for in one? Here are the essentials:
- Ease of Use
A good chart maker doesn’t need a manual. Intuitive drag-and-drop interfaces save time, letting anyone create professional-quality visuals, no matter their technical expertise.
- Versatile Chart Options
Teams deal with varied data. Your tool should support everything from bar and pie charts to Gantt charts and mind maps. Flexibility means it adapts to your project, not the other way around.
- Collaboration Features
Charts are rarely a solo effort. Real-time editing, commenting, and version control help teams work together seamlessly, even when they're spread across different locations.
- Cloud Integration
Need access to your charts on the go? Cloud-based storage ensures your visuals are always accessible—whether on your laptop at work or your phone during a client meeting.
- Export and Sharing Capabilities
Whether it’s a presentation or a report, sharing charts in formats like PDF or PNG ensures compatibility across platforms.
Top Online Chart Creators for Professionals and Teams
Choosing the right chart creator depends on understanding the unique features of each tool and how they align with your team’s needs. Here’s a detailed look at some of the best online chart creators and what makes them ideal for different scenarios and teams.
- Boardmix
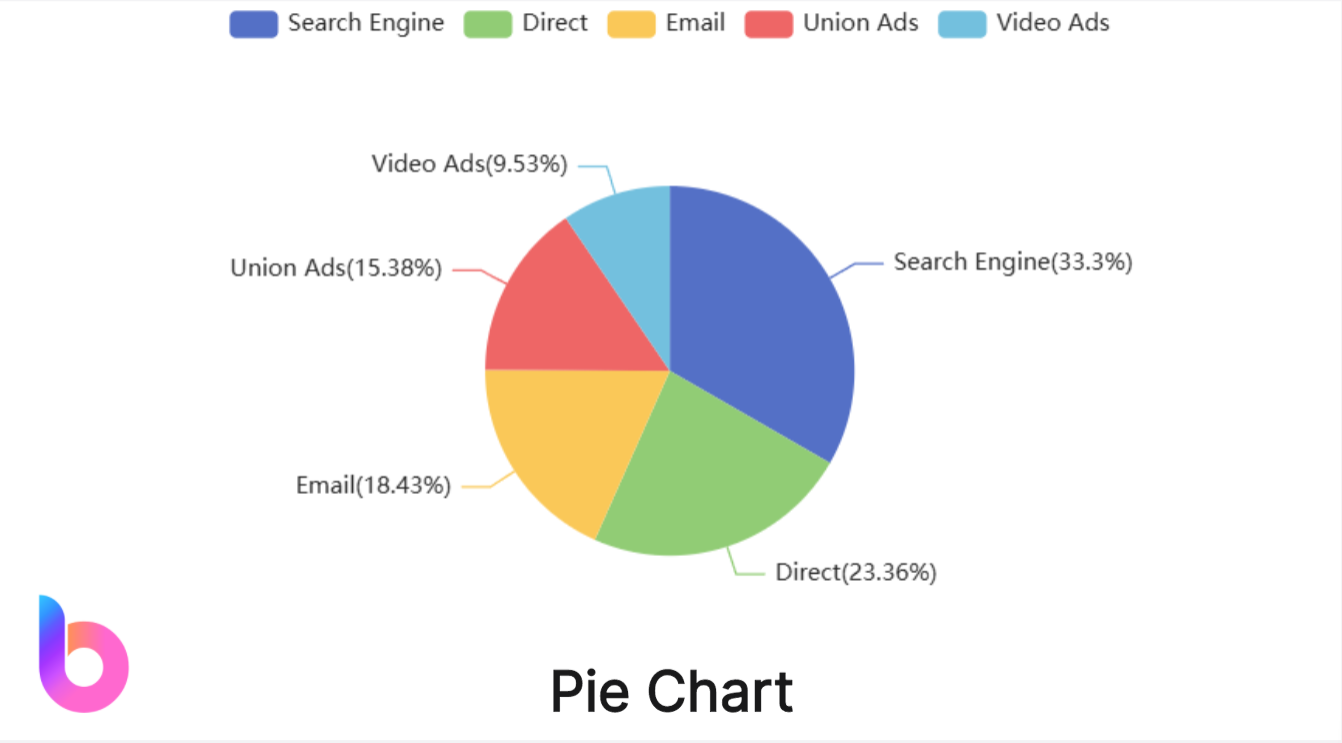
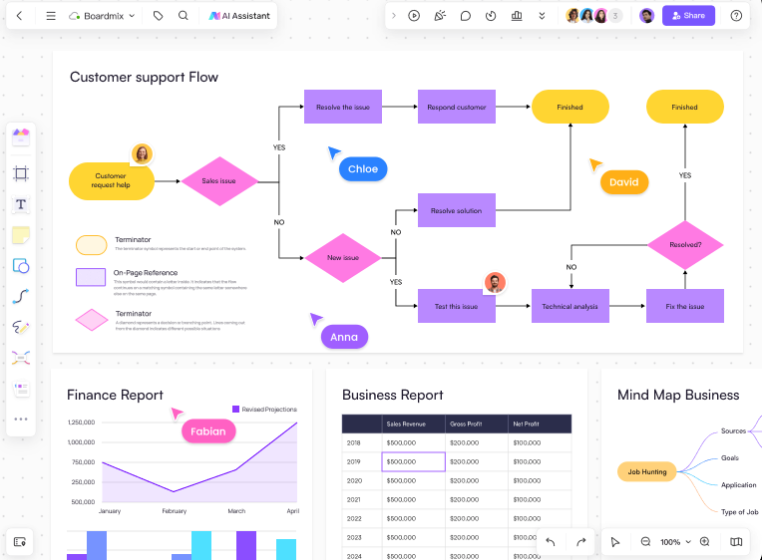
Boardmix stands out as an AI-powered chart creator designed for modern teams that prioritize collaboration and efficiency. Its feature-rich platform is suitable for professionals across industries, whether you’re a project manager, UX designer, or data analyst.
Core Features:
Boardmix offers a diverse range of charting tools, including flowcharts, Gantt charts, mind maps, and organizational charts. Its AI-powered capabilities automate chart generation, saving significant time for busy professionals. The unlimited canvas allows teams to visualize complex workflows without spatial constraints.
Collaboration at its Core:
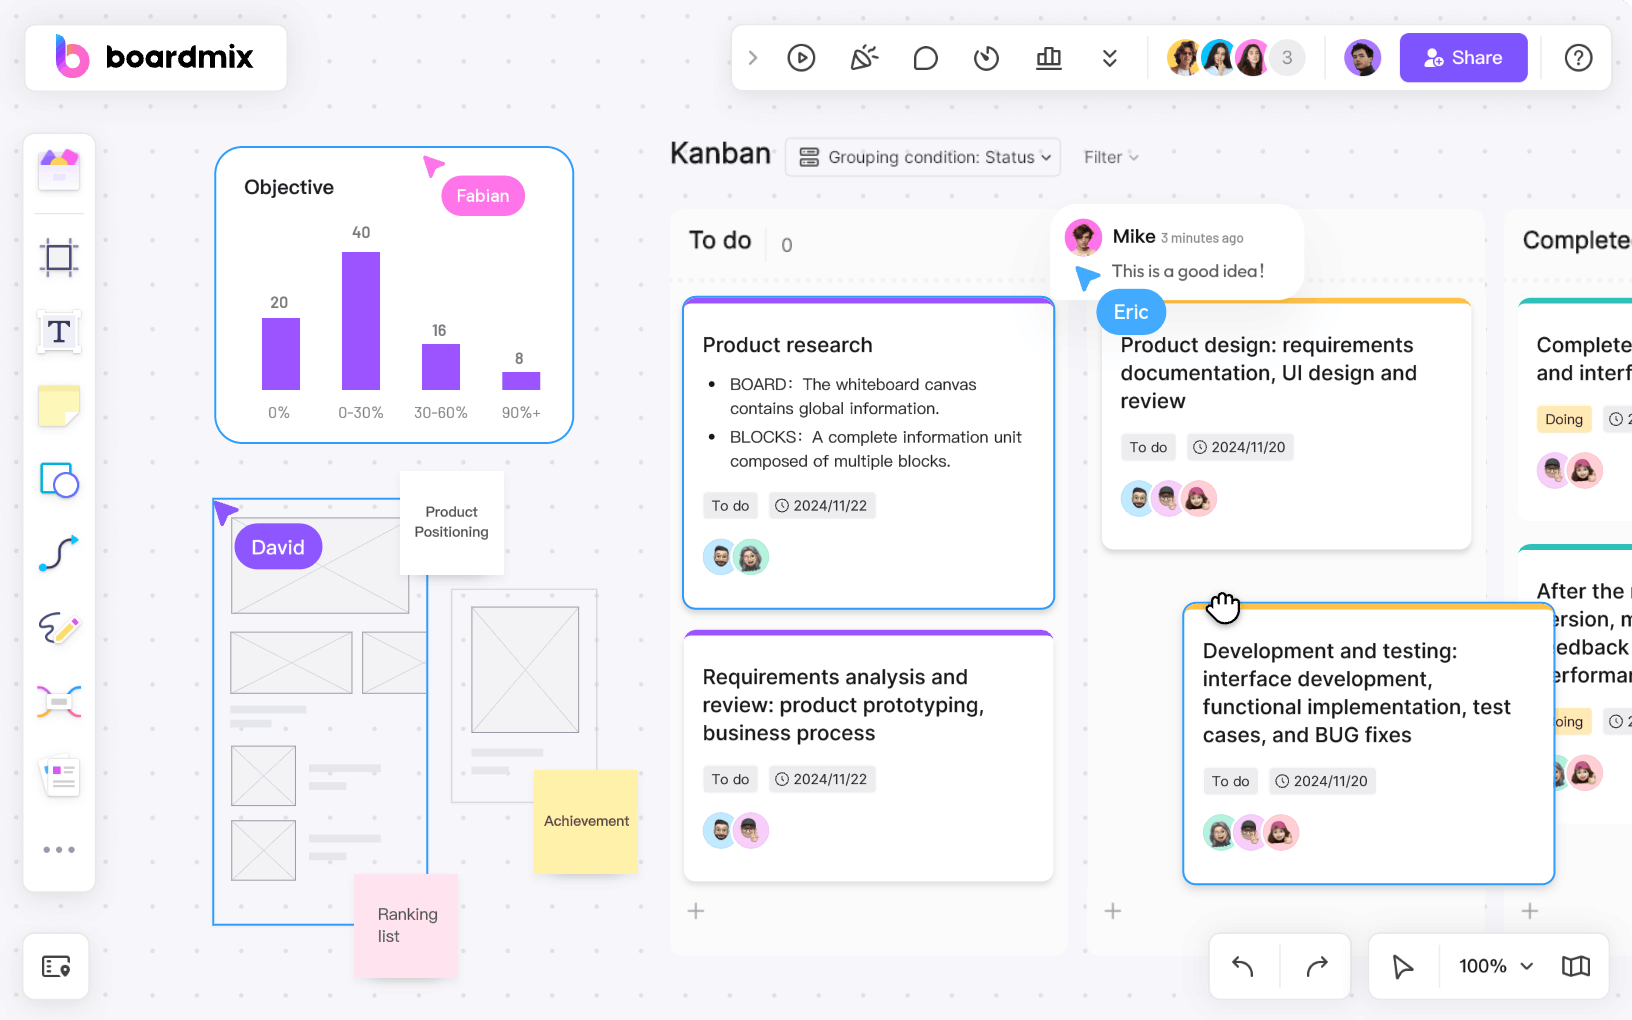
Teams can collaborate in real-time with features like live editing, commenting, and version control. This makes it perfect for distributed teams that need to brainstorm or plan projects together. Boardmix also provides cloud storage, ensuring that charts are accessible from any device, anytime.
Integration and Accessibility:
Boardmix seamlessly integrates with popular productivity tools like ZOOM, Microsoft Teams, Skype, and Google Meeting. Its intuitive interface and drag-and-drop functionality make it easy for both technical and non-technical users.
Best For:
Boardmix is ideal for teams that require a versatile, collaborative, and AI-driven tool. It’s especially suited for project management, design brainstorming, and cross-departmental planning. If you’re looking for an all-in-one charting solution that combines creativity with practicality, Boardmix is an excellent choice.
How to Create Charts online with the Online Chart Creator Boardmix
Creating charts in Boardmix is a straightforward process, designed to accommodate both beginners and experienced professionals. Here’s how you can create a chart step-by-step using Boardmix:
Step 1: Log into Your Boardmix Account
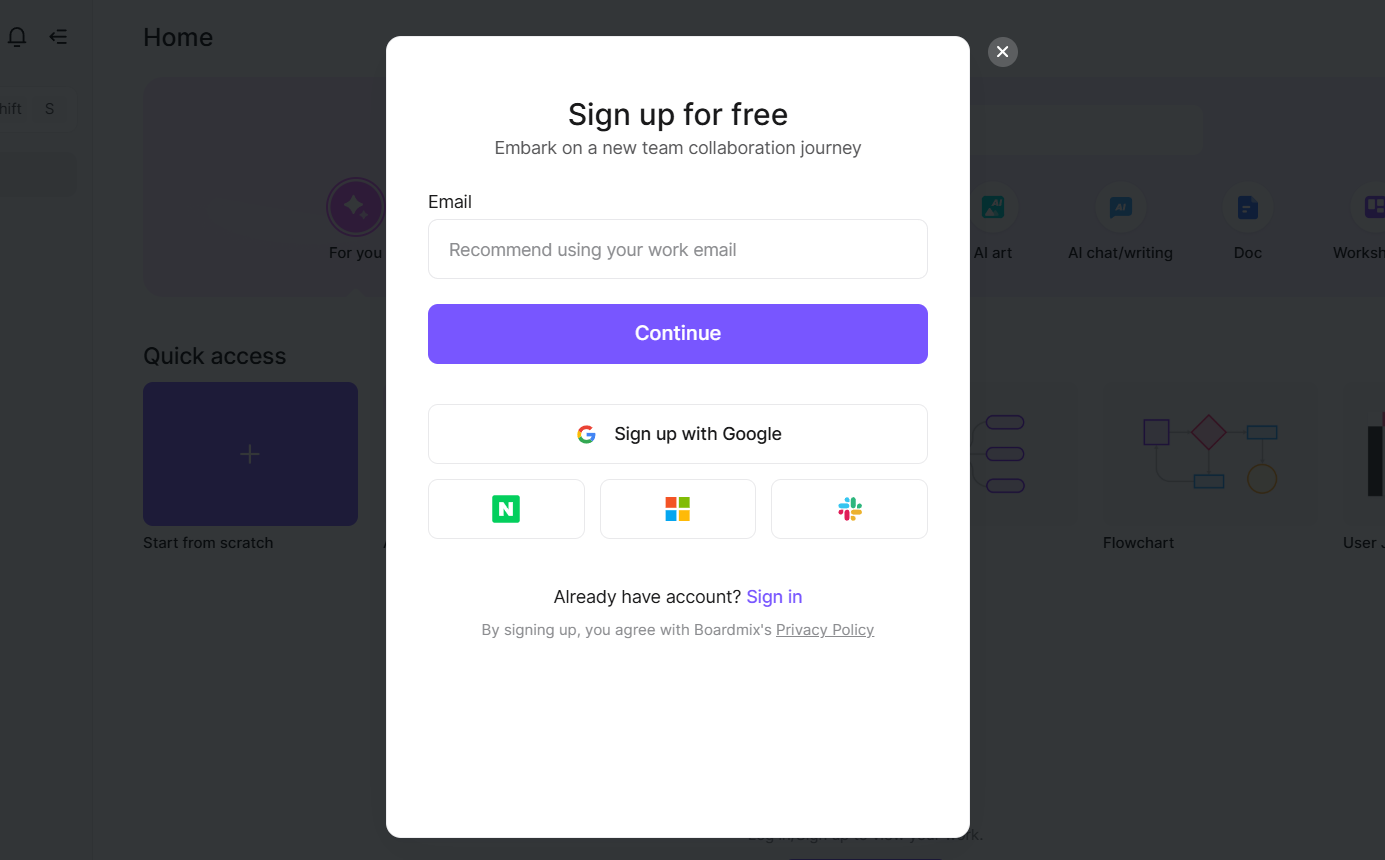
Visit the Boardmix website and log into your account.
If you don’t have an account yet, sign up for free to get started.
Step 2: Open a New or Existing Board
Create a new board by selecting the “New Board” option.
Alternatively, open an existing project where you’d like to add a chart.
Step 3: Access the Chart Tools
Navigate to the toolbar and select the chart icon.
Choose from a variety of chart options like flowcharts, Gantt charts, mind maps, or timelines.
Alternatively, start with a template by selecting from Boardmix’s extensive library to save time.
Step 4: Customize Your Chart
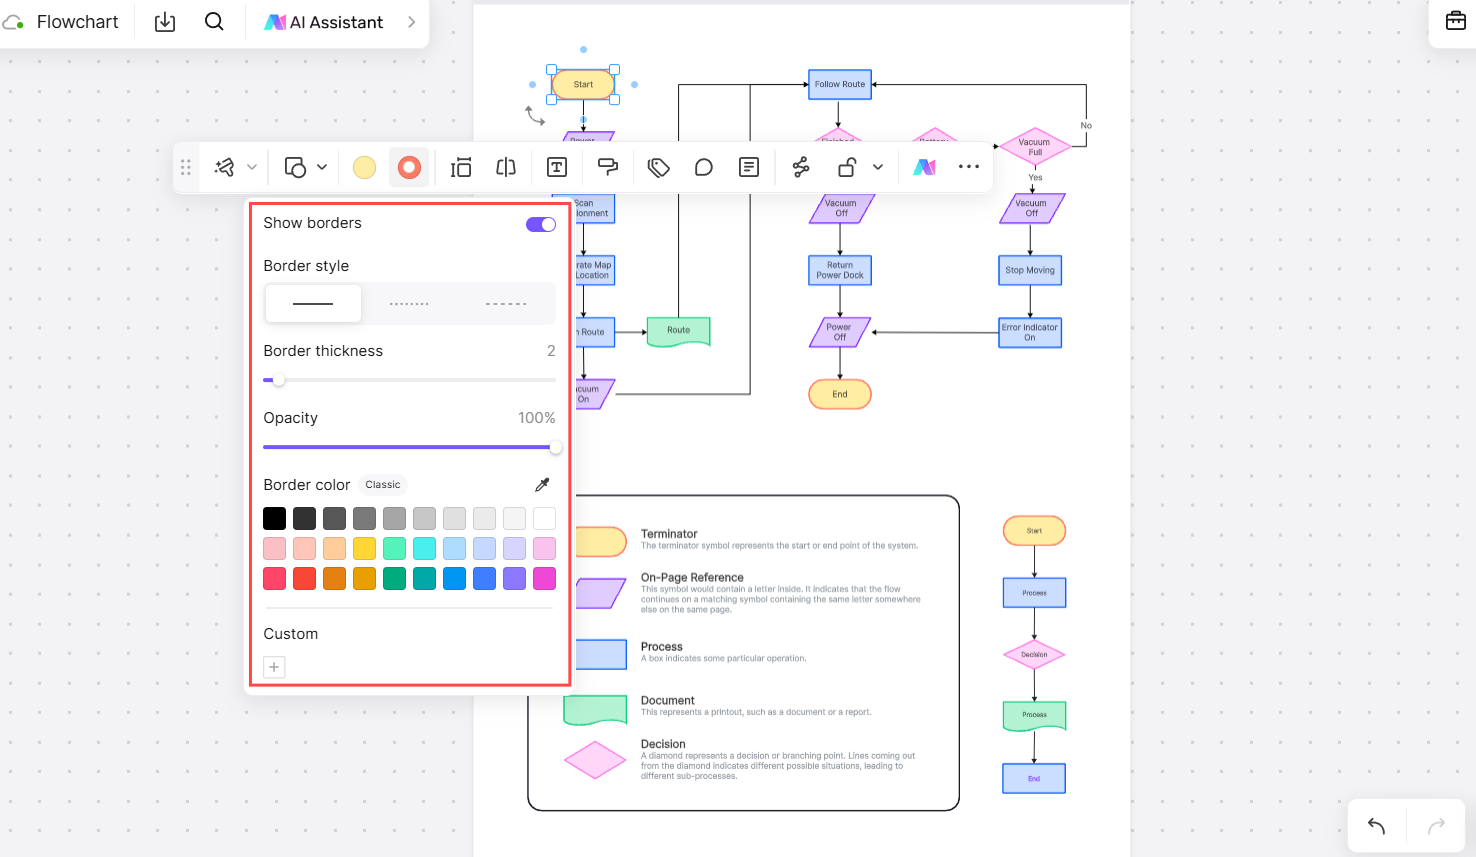
Add Data: Manually input your data or upload a dataset to generate charts automatically.
Design Elements: Customize colors, fonts, and layouts to match your brand or project style.
Drag-and-Drop Features: Rearrange elements easily to structure your chart visually.
Step 5: Collaborate in Real-Time
Invite team members to join your board for real-time collaboration.
Use comment tools to gather feedback or discuss adjustments directly on the chart.
Step 6: Export and Share
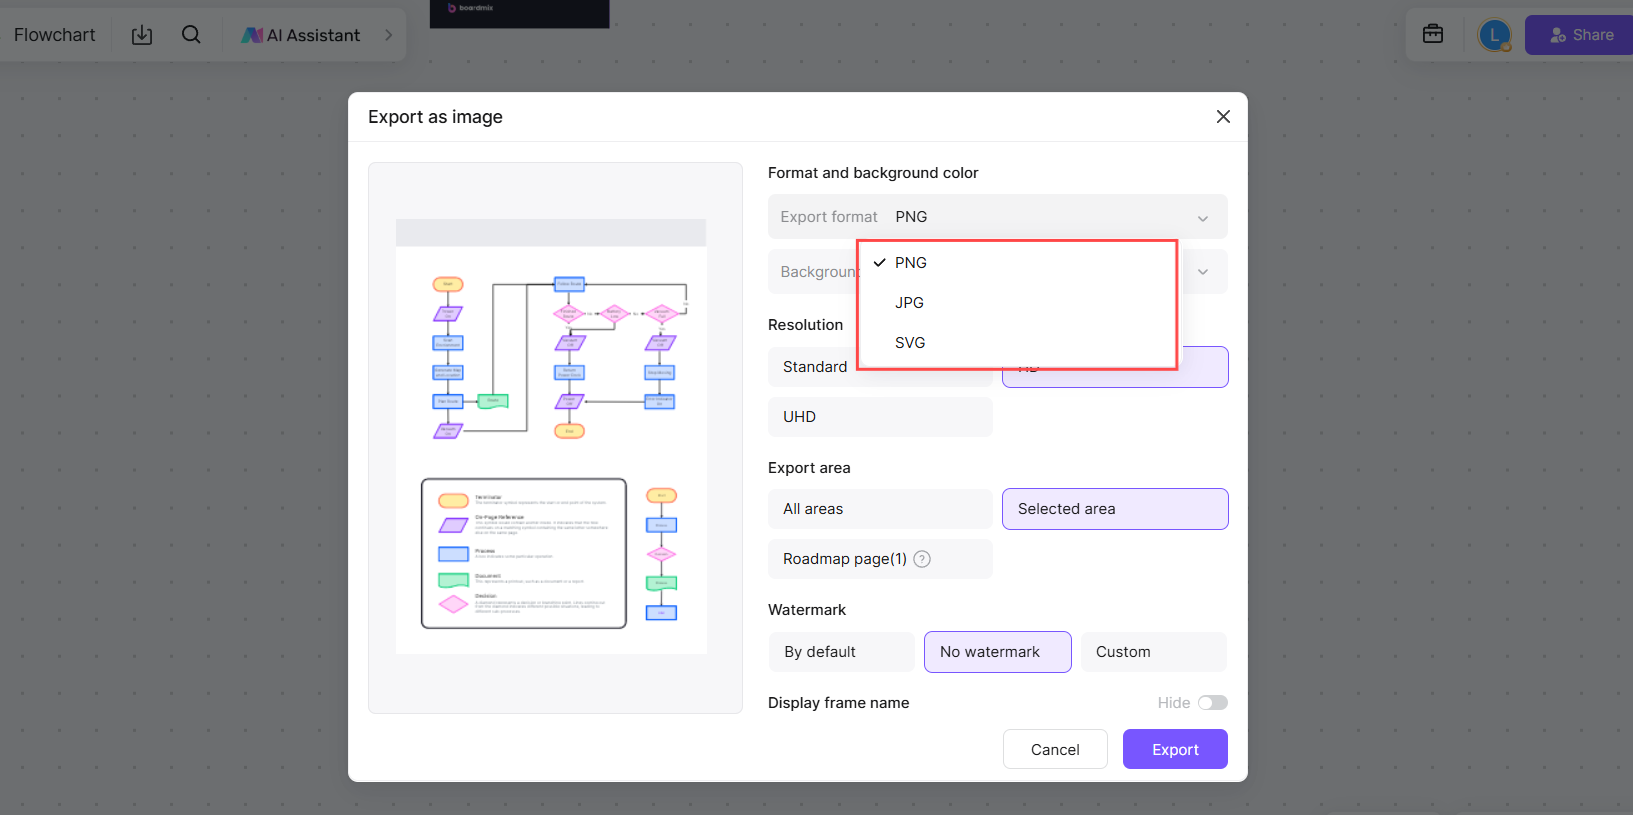
Once your chart is complete, export it in various formats like PDF, PNG, or a sharable link.
Seamlessly share your charts via integrations with tools like ZOOM, Microsoft Teams, Skype, and Google Meeting.
With Boardmix, creating charts is an efficient and collaborative experience. Whether you're organizing a project timeline or visualizing complex data, the process is designed to be seamless and impactful.
- Canva
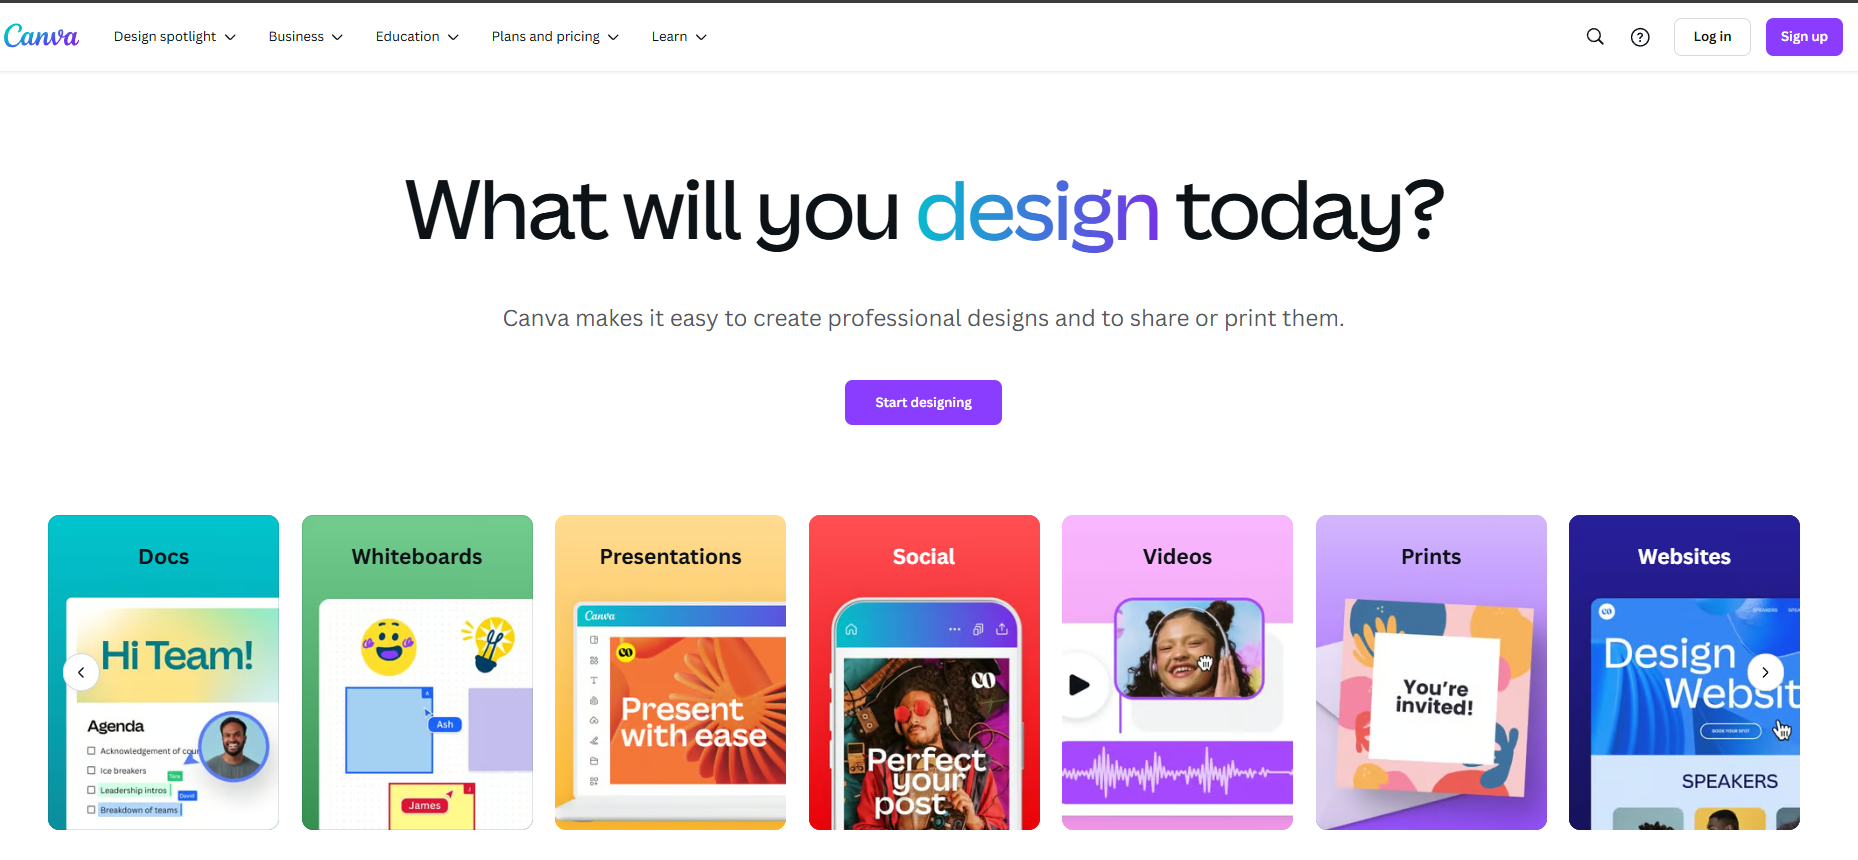
Canva is widely recognized for its user-friendly interface and stunning design templates, making it a favorite among marketers, educators, and small business owners.
Core Features:
Canva excels in providing visually appealing templates for bar charts, pie charts, and infographics. It simplifies the design process with drag-and-drop tools, allowing users to customize fonts, colors, and styles to align with their branding. The platform also offers extensive stock images and icons to enhance charts further.
Simplicity and Accessibility:
With its straightforward interface, Canva is perfect for users with no design background. Charts can be created and shared in just a few clicks, making it a go-to tool for quick presentations or reports.
Integration and Sharing:
Canva supports seamless sharing options, including direct links, social media posts, or downloadable files in formats like PNG and PDF. It integrates well with platforms like Google Drive and Dropbox for easy access and collaboration.
Best For:
Canva is best suited for individuals or small teams that need quick, visually striking charts for presentations, social media, or educational content. It’s less ideal for complex charting needs but perfect for creating charts that stand out.
- Lucidchart
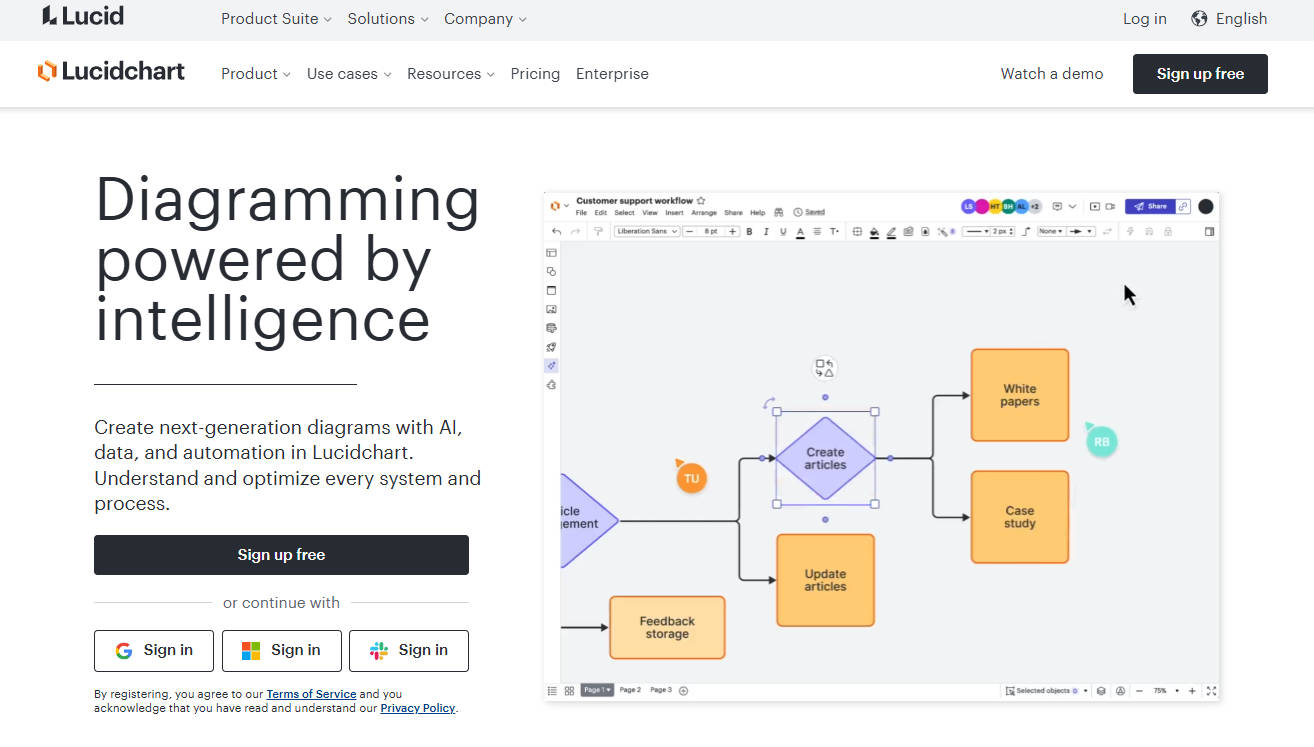
Lucidchart is a powerhouse for advanced diagramming and is often the top choice for engineering, IT, and business teams that deal with complex systems and workflows.
Core Features:
Lucidchart offers a wide variety of charts and diagrams, including UML diagrams, network maps, and process flows. Its advanced functionality includes conditional formatting, automated data linking, and dynamic updates, making it a robust choice for technical users.
Collaboration and Integration:
Like Boardmix, Lucidchart supports real-time collaboration with multiple users editing and commenting simultaneously. It integrates with tools like Microsoft Teams, Atlassian Jira, and Salesforce, making it highly versatile for enterprise environments.
Best For:
Lucidchart is ideal for technical teams, such as software developers and business analysts, who need precision and advanced capabilities in their diagrams. It’s a tool for those who value functionality over aesthetic appeal.
- Visme
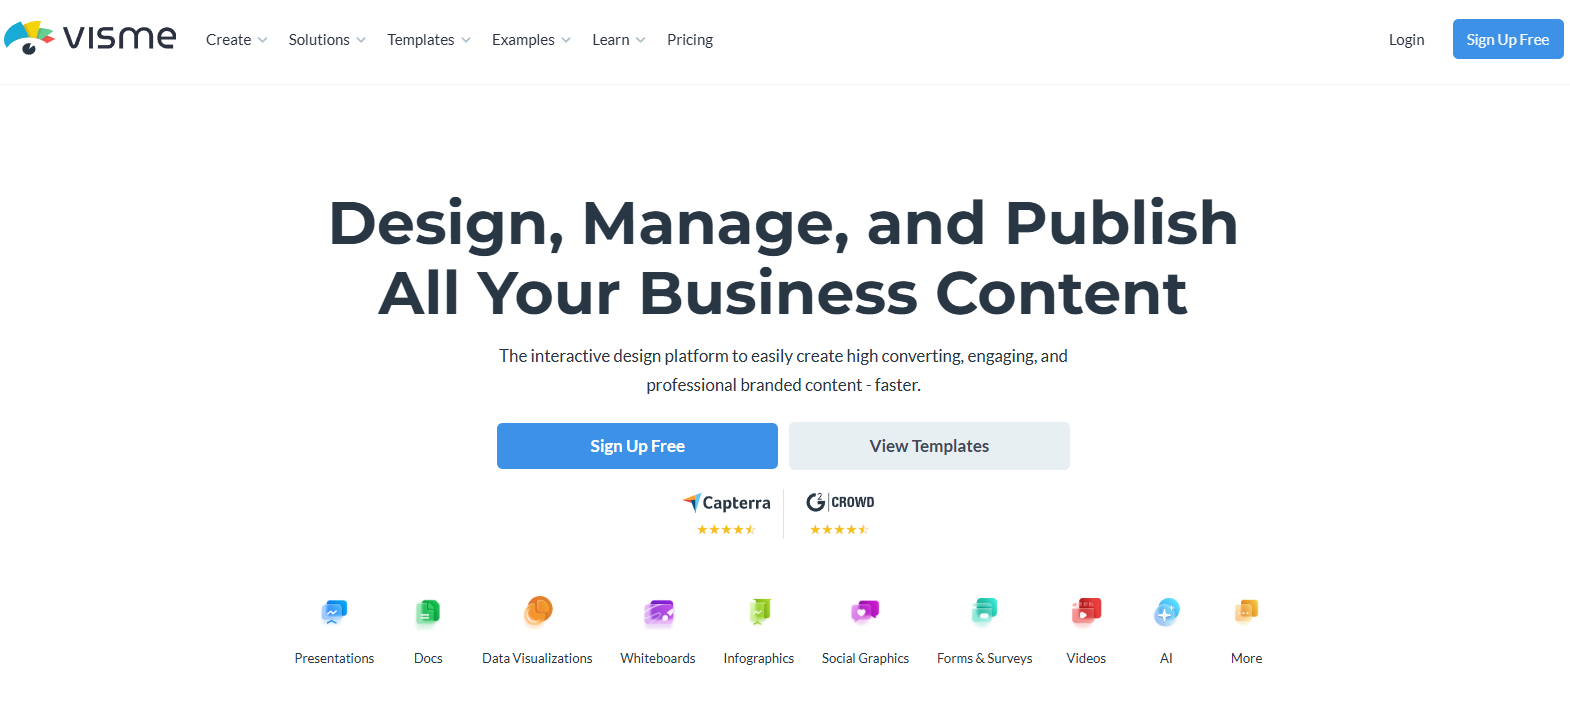
Visme is an excellent choice for teams looking to combine data visualization with storytelling. It’s particularly popular among marketing and content teams.
Core Features:
Visme offers dynamic templates for charts, infographics, and reports. Users can incorporate animations, videos, and interactive elements to make their charts more engaging.
Ease of Use:
The platform’s intuitive design tools ensure that even non-designers can create professional-quality visuals. It also offers tools for team collaboration, such as shared folders and real-time feedback.
Best For:
Visme is perfect for teams that want to turn raw data into compelling visual stories. It’s best suited for marketing, education, and creative professionals who need to present data in an impactful way.
- Creately
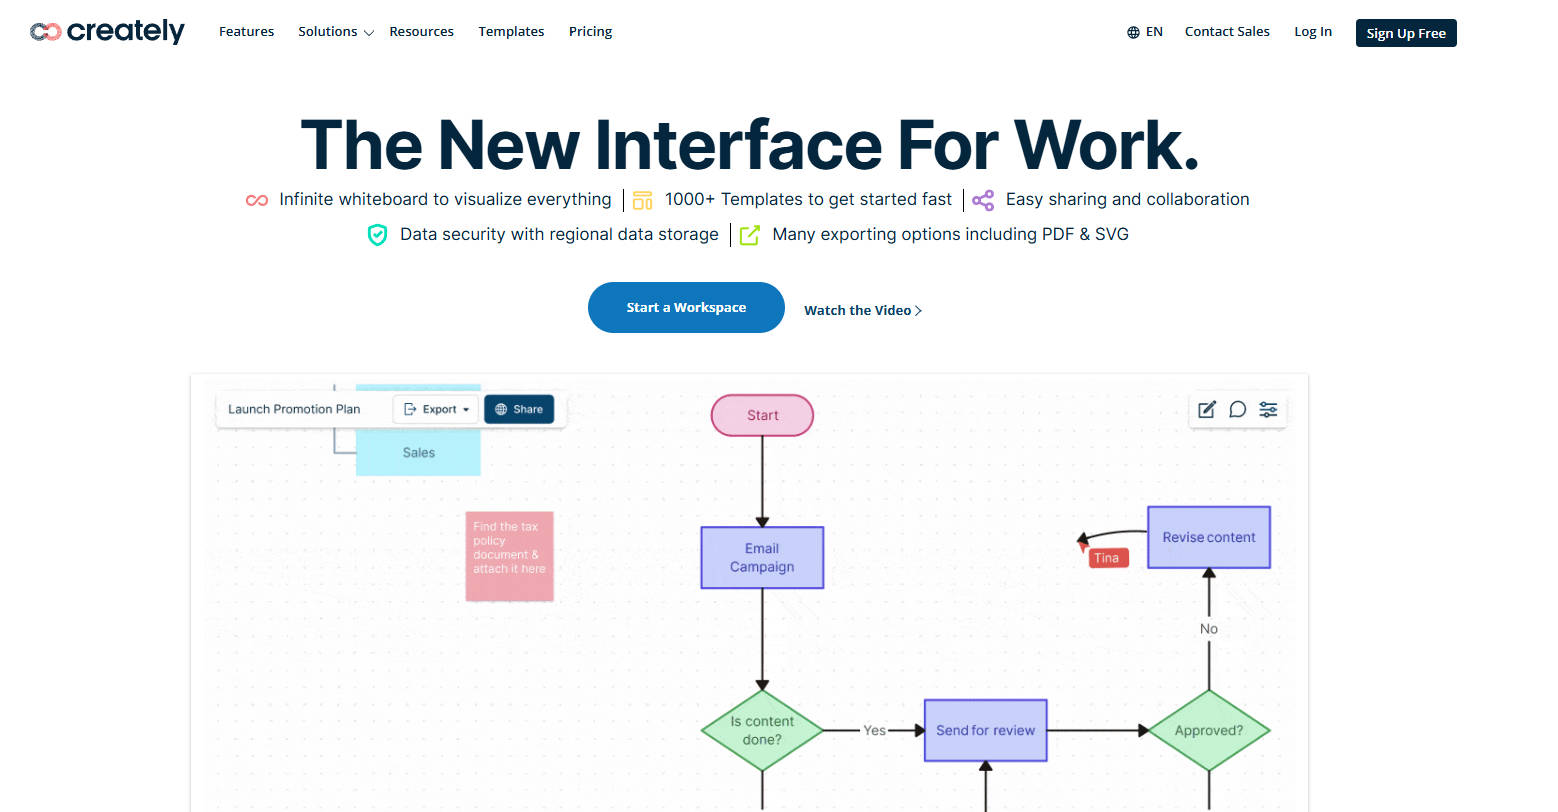
Creately is a versatile diagramming tool tailored for brainstorming, process mapping, and charting.
Core Features:
Creately provides pre-designed templates for organizational charts, mind maps, and workflow diagrams. It also supports advanced features like data linking and shape customization, giving users greater flexibility in their designs.
Collaboration and Usability:
The tool supports real-time collaboration and is accessible on both desktop and mobile devices. Creately also integrates with project management tools like Asana and Slack, making it easy to embed charts into workflows.
Best For:
Creately is ideal for teams engaged in brainstorming, strategic planning, or detailed process mapping. It’s a great fit for HR teams, educators, and consultants who need a straightforward yet powerful chart creator.
- SmartDraw
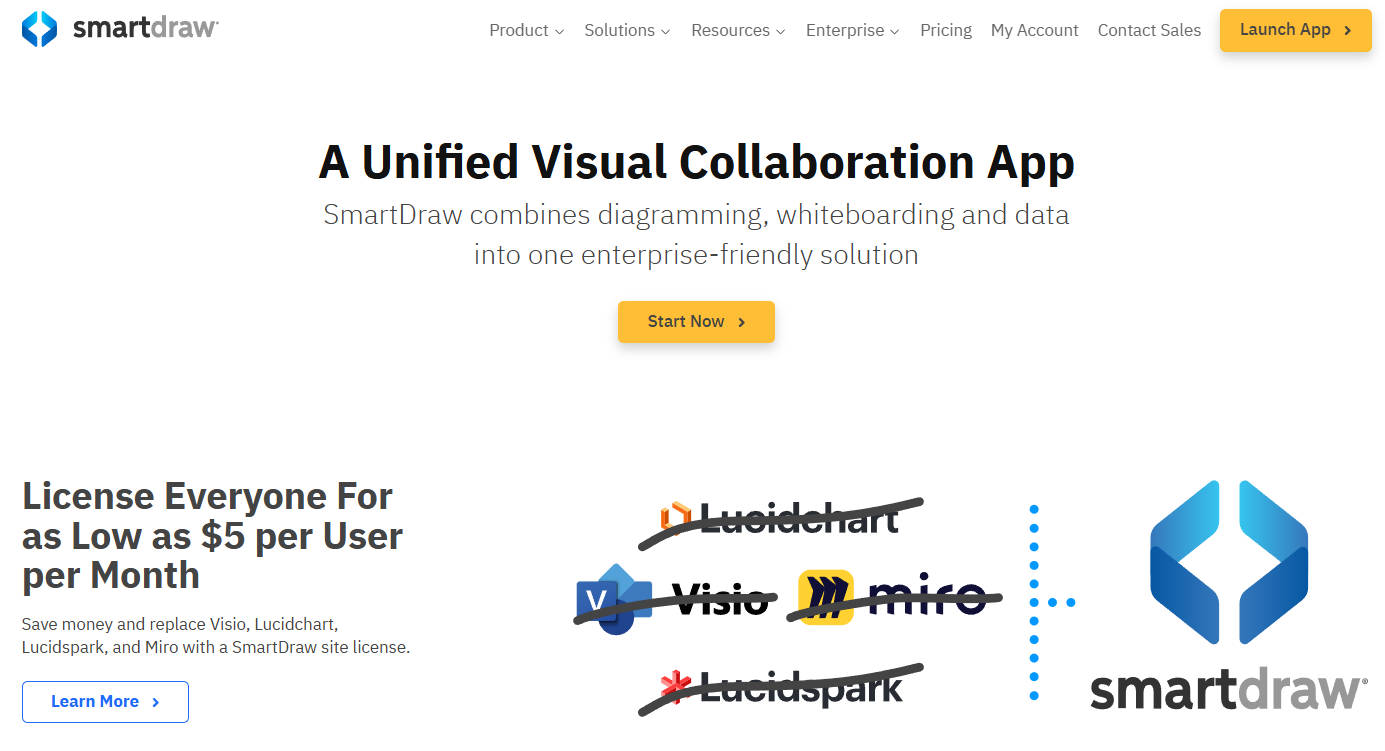
SmartDraw is known for its extensive library of diagram templates and automatic alignment features, making it a reliable choice for technical and non-technical users alike.
Core Features:
This platform offers over 4,500 templates for flowcharts, floor plans, and engineering diagrams. Its automatic formatting ensures that charts are always neat and professional-looking.
Best For:
martDraw is suitable for technical teams in industries like architecture, engineering, and manufacturing. It’s ideal for creating detailed, professional diagrams with minimal effort.
Each of these tools has unique strengths, making them suitable for various teams and scenarios. Whether you’re managing a project, designing a process, or presenting data, the right chart creator can significantly enhance your productivity and effectiveness.
Choosing the Right Chart Creator for Your Needs
Not every chart creator will fit your team’s needs, and finding the right one involves considering various aspects of your workflow, goals, and resources. Here’s how to make an informed choice:
Assess Your Team’s Requirements
Start with a clear understanding of what your team needs from a charting tool. Consider these factors:
- Primary Use Case: Are you managing projects, creating presentations, or visualizing data for analysis? For instance, Gantt charts are perfect for project timelines, while flowcharts may suit process mapping.
- Team Size: Smaller teams may prioritize simplicity and ease of use, while larger teams might require advanced features like access controls or version history.
- Collaboration Needs: Do your team members need to work on charts simultaneously? Real-time editing and commenting features can enhance productivity.
Test Usability and Features
Hands-on experience is essential to understanding whether a tool fits your needs.
- Free Trials and Demos: Use these to explore the interface and features. Pay attention to how easy it is to create the chart types you use most often.
- Interface Intuitiveness: Look for drag-and-drop functionality, pre-built templates, and tooltips. A tool that’s easy to learn saves time and minimizes onboarding efforts.
- Customization Options: Check if the tool allows you to adjust chart styles, colors, and layouts to match your branding or presentation style.
Consider Pricing and Scalability
Budget and scalability play a crucial role, especially if your needs evolve over time.
- Cost-Effectiveness: Compare pricing tiers and evaluate whether the features justify the cost. Some tools offer free plans for basic use, while others cater to professional needs with premium packages.
- Scalability: Choose a tool that grows with your organization. For instance, a small team might not need advanced integrations today but could benefit from them as they expand.
- Hidden Costs: Be mindful of potential add-ons, such as additional storage, premium templates, or integrations that might increase overall expenses.
Integration Capabilities
Seamless integration with your existing tools can significantly boost productivity.
- Third-Party Apps: Check for compatibility with platforms like Google Workspace, Microsoft Office, Slack, or project management tools like Asana or Trello.
- File Format Flexibility: Ensure the chart creator supports multiple export formats like PNG, PDF, or SVG for easy sharing and reporting.
- API Access: Some teams may require custom integrations with in-house tools.
Security and Data Privacy
If your charts contain sensitive data, the security features of the tool are critical.
- Data Encryption: Ensure the tool uses encryption protocols to keep your data safe.
- Access Controls: Look for role-based permissions and secure sharing options to restrict access to authorized users.
- Compliance: Check if the tool complies with industry standards like GDPR or ISO certifications.
Customer Support and Community
Reliable support can make or break your experience with a chart creator.
- Support Channels: Does the provider offer live chat, email, or phone support? Look for 24/7 availability if your team works across time zones.
- Documentation and Tutorials: A robust knowledge base with tutorials and FAQs can help resolve issues quickly.
- User Community: Active user forums or communities can provide tips, templates, and troubleshooting advice.
By analyzing these dimensions—team needs, usability, cost, integration, security, and support—you’ll be better equipped to choose a chart creator that aligns with your goals. Making the right decision ensures your team can create impactful visuals efficiently, collaborate effectively, and scale seamlessly as your projects grow.
The Bottom Line
Online chart creators are game-changers for professionals and teams. They simplify workflows, enhance collaboration, and ensure your data is presented clearly. Among these tools, Boardmix stands out with its AI-powered features, vast charting options, and seamless collaboration capabilities. Choosing the right chart creator depends on your team’s unique needs, but tools like Boardmix make it easy to turn ideas into impactful visuals.
Whether you’re managing projects, analyzing daasta, or presenting to clients, an online chart creator can help you achieve your goals faster and with less effort. Start exploring the options today and empower your team with better visuals.


