


What is the GE-McKinsey Matrix?
The GE-McKinsey Matrix is a strategic planning tool that assists businesses in making investment decisions and managing a diverse product portfolio. It's a nine-cell grid that plots a company's "business unit strength" against the "industry attractiveness". In simpler terms, the business unit strength refers to how well a specific business or product line of your company is performing in comparison to competitors. This could be measured by factors like market share, brand recognition, or operational efficiency.
On the other hand, industry attractiveness gauges the overall appeal of the market where your business operates. Factors such as growth rate, profitability, barriers to entry, and technological development can influence this.
When you plot your business units on this matrix, it helps you determine where to invest, disinvest or maintain your current level of investment. It's a powerful tool for strategic management because it provides a visual representation of where your resources might be best allocated to maximize returns.
What is the GE-McKinsey Matrix used for?
Here are the key uses of the GE-McKinsey Matrix.
Strategic Portfolio Analysis
The GE-McKinsey Matrix serves as a framework for performing a strategic portfolio analysis. It allows companies to assess their different business units or product lines based on two critical dimensions - Market Attractiveness and Business Unit Strength.
Resource Allocation
The matrix aids in resource allocation decisions. By understanding the positioning of each business unit, companies can make informed decisions about where to allocate resources. Business units that lie in the high market attractiveness and high business strength quadrant are often prioritized.
Investment Decisions
Another important application of the GE-McKinsey Matrix is guiding investment decisions. The matrix provides insights on which business units warrant further investment, which ones should be maintained, and which ones could potentially be divested.
Risk Management
The GE-McKinsey Matrix can also support risk management efforts. By highlighting the relative strengths and weaknesses of different business units and their respective market attractiveness, it helps companies spread their risks across a diversified portfolio.
The GE-McKinsey Matrix is a practical tool used in strategic planning to analyze a company's portfolio, make informed investment and resource allocation decisions, and manage risks effectively. However, the successful application of this matrix requires accurate data and objective assessment.
Utilizing the GE Matrix in Strategic Management
Step 1: Identify and Understand the Factors
The first step involves identifying and understanding the factors under the two main dimensions:
Business Unit Strength: Several factors determine business unit strength. These could include market share, brand equity, profitability, product quality, manufacturing capability, and management caliber, among others.
Market Attractiveness: This refers to factors such as the size of the market, the growth potential, competitive dynamics, profitability prospects, and technological evolution.
Step 2: Rate Your Business Units
Rate each of your company's business units or products on a scale of 1-10 (or any other appropriate scale) for each of the identified factors. One represents weak performance, while ten signifies strong performance.
Step 3: Weight the Factors
Assign a relative weight to each factor based on its importance in achieving your company's objectives. The weights should sum up to 1 (or 100% if using percentage).
Step 4: Calculate Scores for Each Business Unit
Multiply each factor’s rating by its weight to get the weighted score. Then sum up the weighted scores to get an overall score for each business unit on both dimensions: Market Attractiveness and Business Unit Strength.
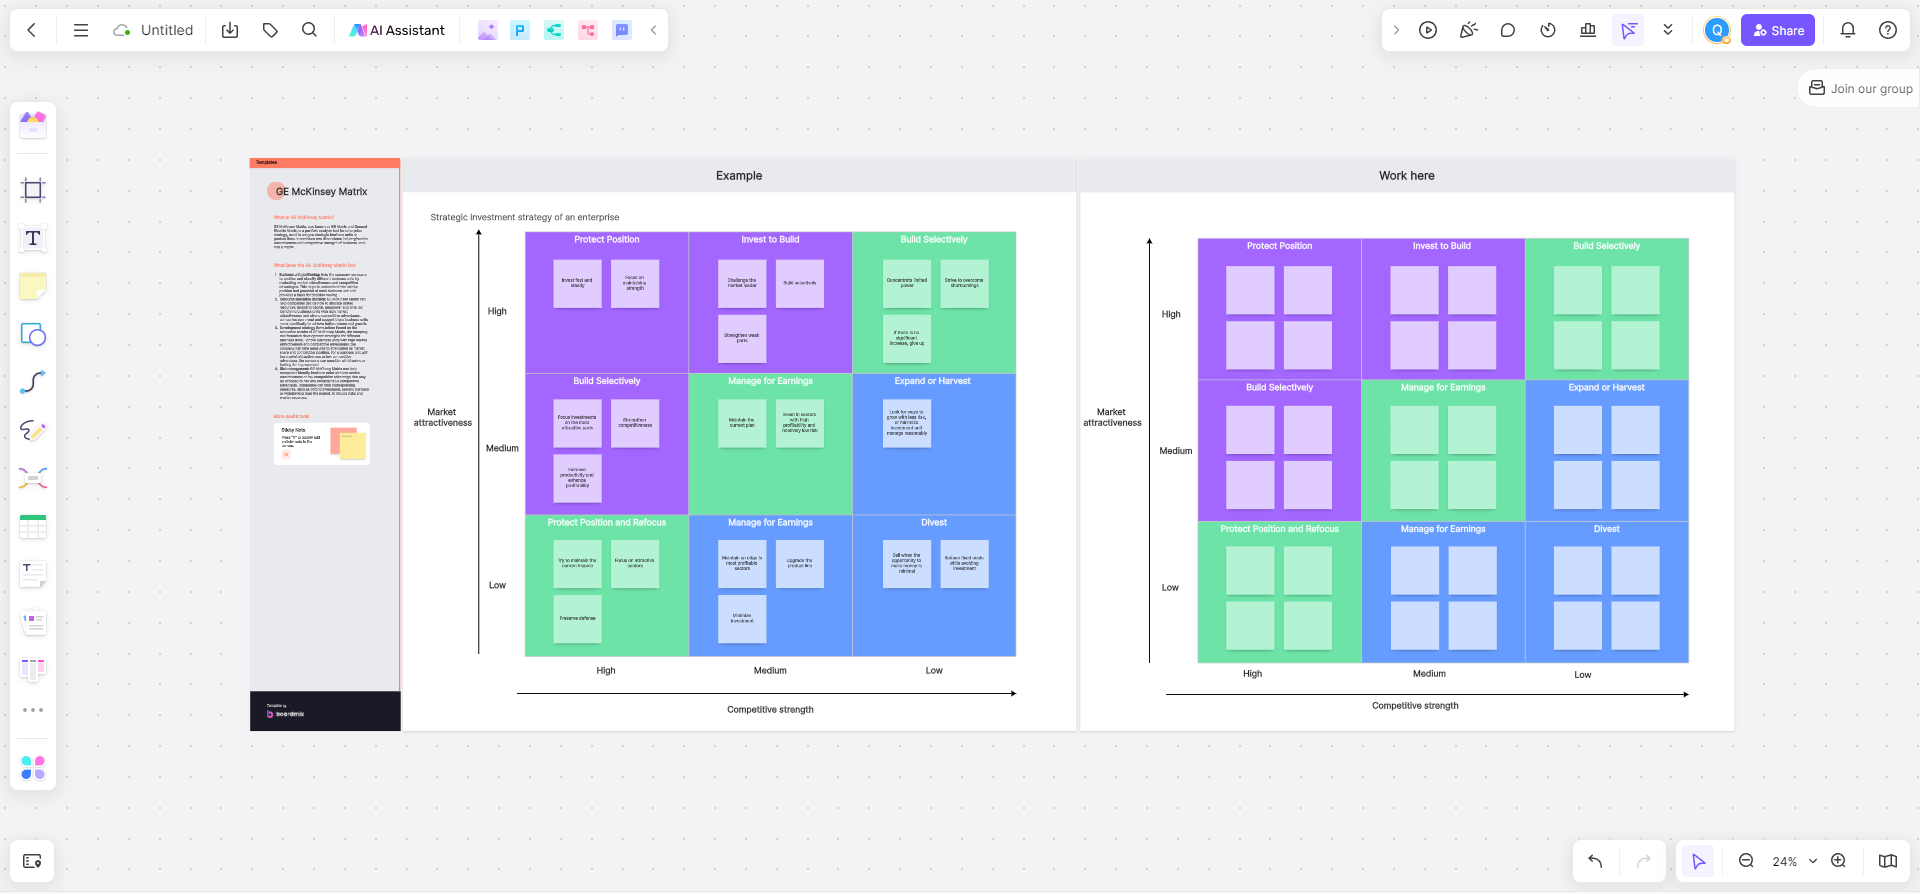
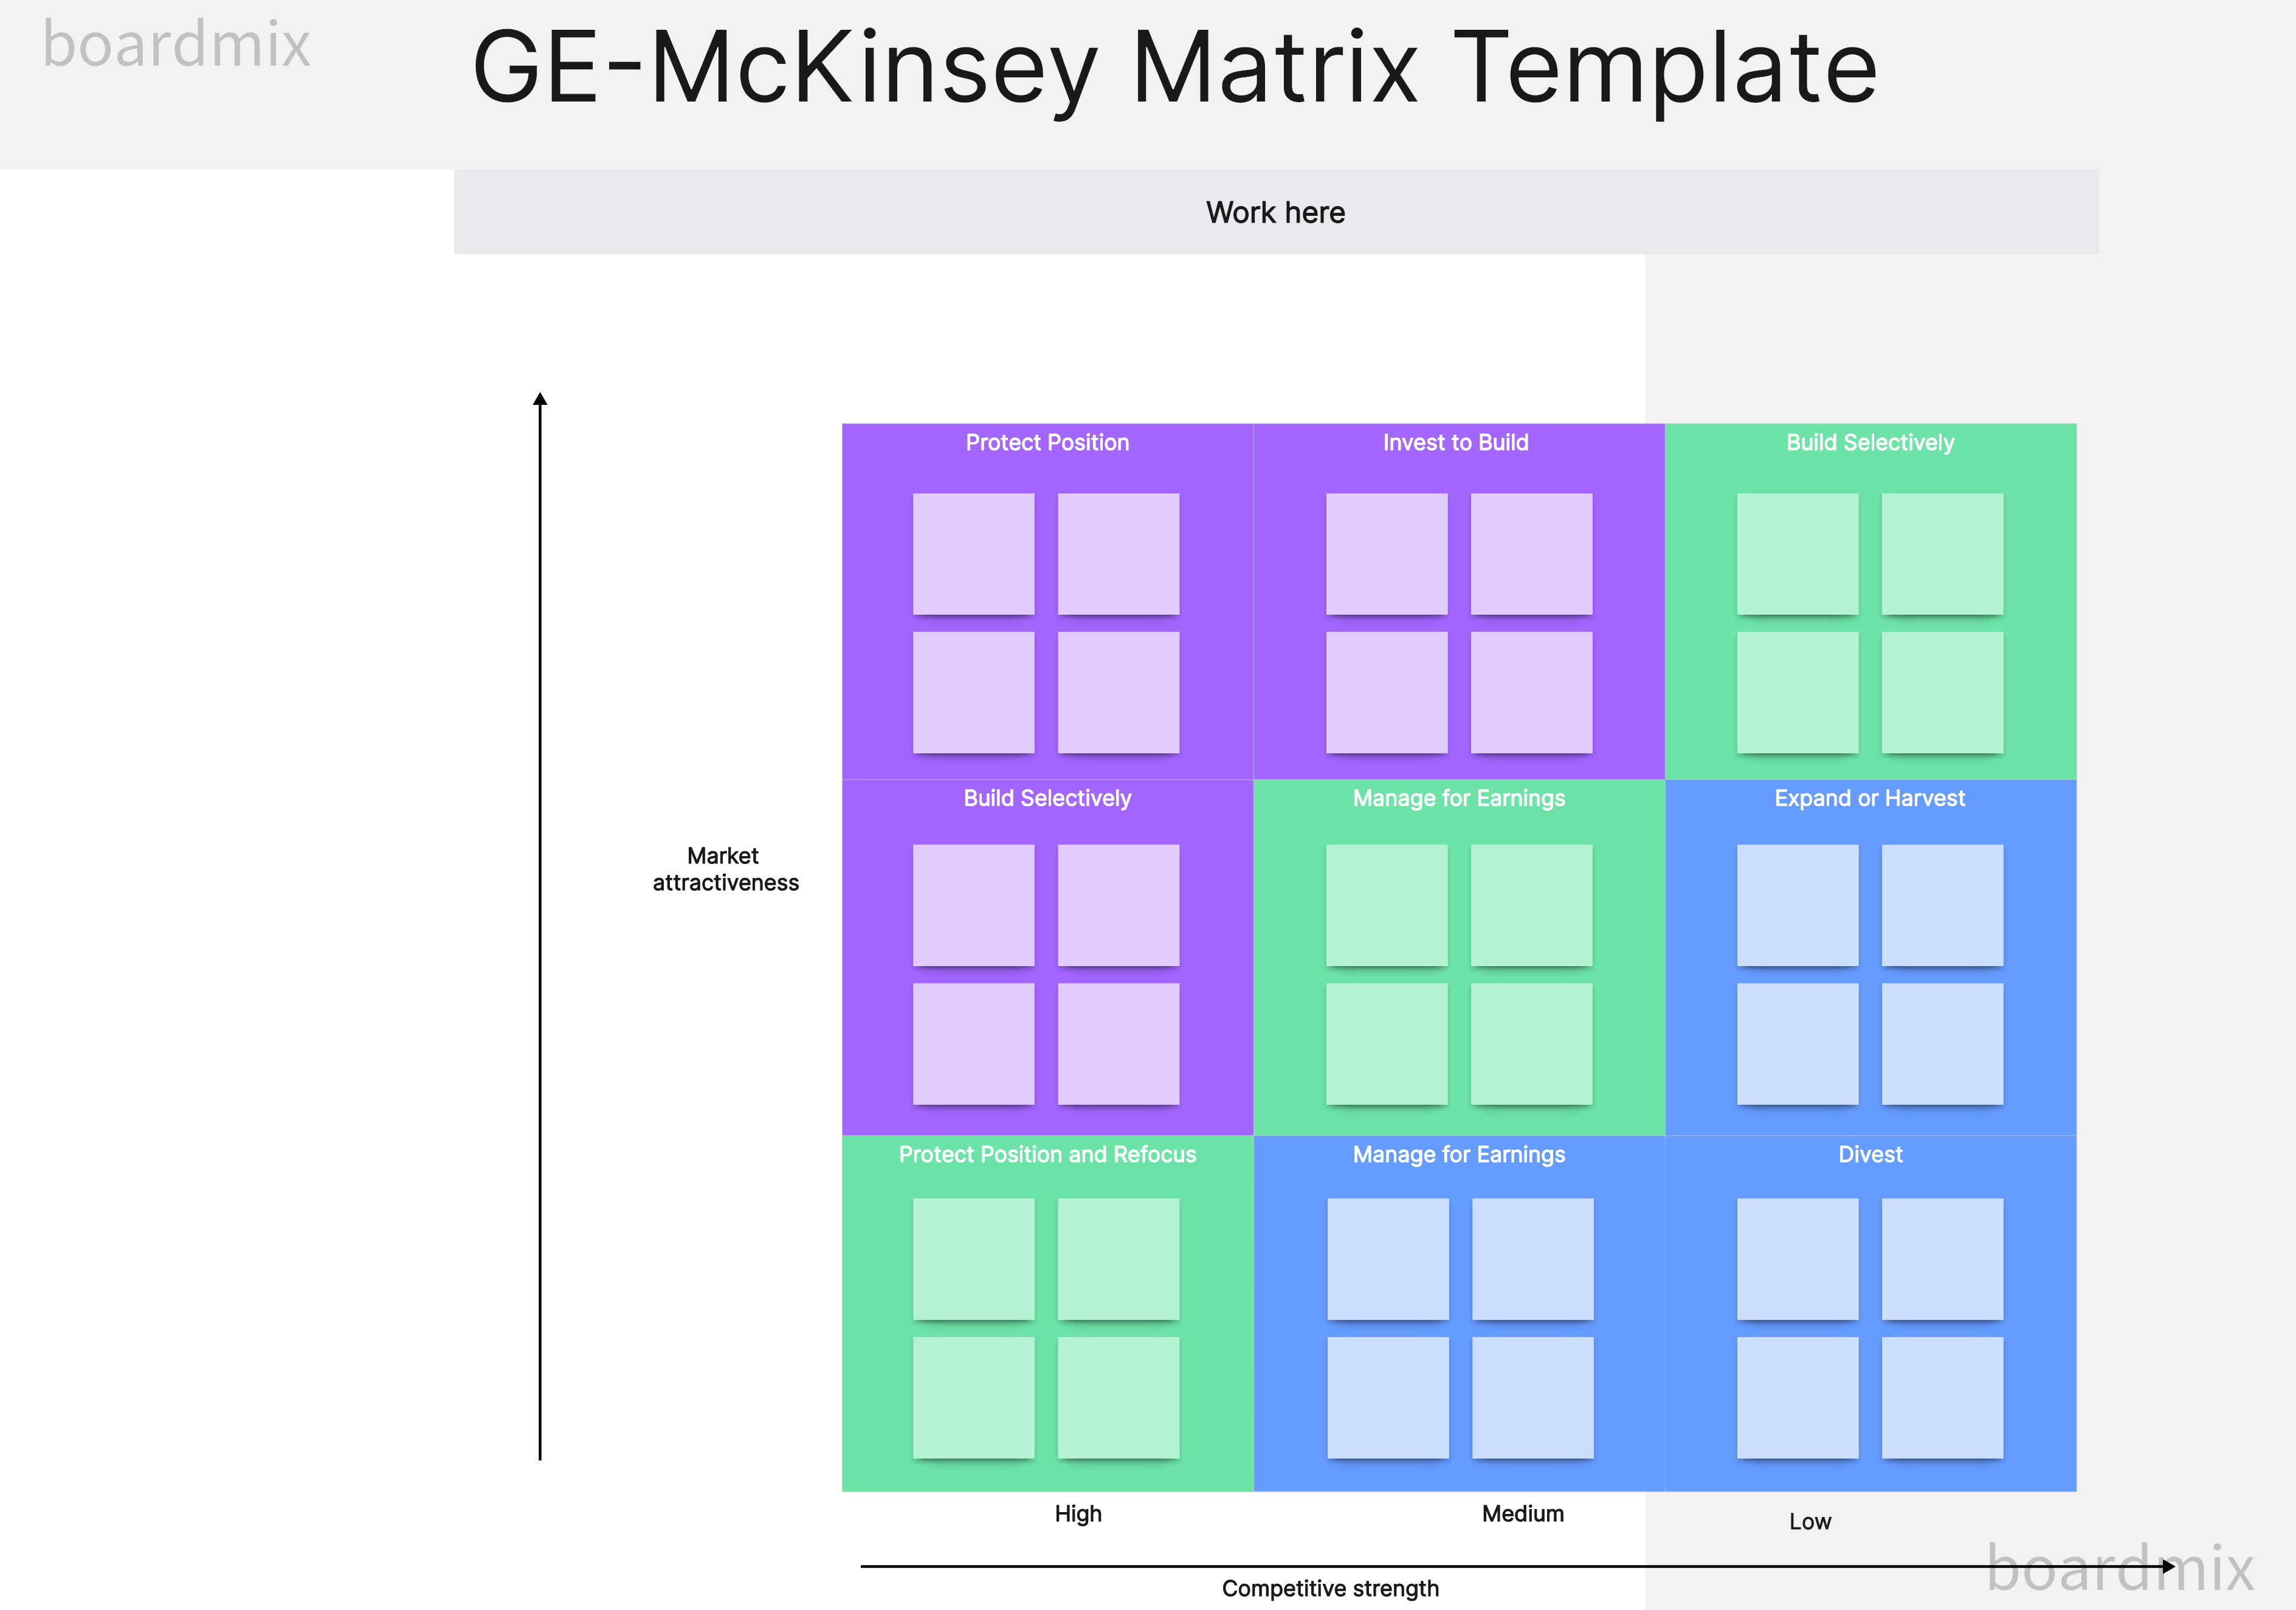
Step 5: Plot Your Business Units on the Matrix
Plot your business units on the 3x3 grid of the GE-McKinsey Matrix using their overall scores. The horizontal axis shows business unit strength, and the vertical axis shows market attractiveness.
Step 6: Determine Strategic Actions
Each cell on the grid indicates a different strategic direction:
High Attractiveness/High Strength (top right cells): Business units in these cells are strong in attractive markets. Consider investing in these units to support their continued success and market leadership.
Medium Attractiveness/Medium Strength (middle cells): Units in these cells are moderate performers. Maintain select investments to sustain their market position, with an eye for potential growth opportunities.
Low Attractiveness/Low Strength (bottom left cells): These units are weak in less attractive markets. Unless they hold some strategic importance, consider divesting or discontinuing these units.
The GE Matrix in Strategic Management: Pros and Cons
The GE-McKinsey Matrix is a popular tool for strategic portfolio management, allowing businesses to plot their different units or products based on market attractiveness and business strength. Like any strategic tool, it has its advantages and limitations.
Pros of the GE-McKinsey Matrix
Comprehensive Analysis: The matrix provides a more detailed analysis compared to similar tools, considering multiple factors under business unit strength and market attractiveness.
Informed Decision-Making: By plotting business units on the matrix, companies get a visual representation of where they stand. This can guide decisions on where to invest, maintain or divest.
Risk Diversification: With a clear view of the performance and potential of different business units, companies can diversify risk by balancing their investments across a range of units and markets.
Strategic Planning: The matrix assists in strategic planning, helping businesses identify potential growth areas, units that need attention, and areas where resources can be better allocated.
Cons of the GE-McKinsey Matrix
Complexity: The GE-McKinsey Matrix's comprehensive nature also adds complexity. The analysis includes multiple factors, each needing accurate data for rating and weighting, which can be resource-intensive.
Subjectivity: There can be subjectivity in defining factors, assigning ratings and weights, which can affect the accuracy of the analysis. Therefore, it requires a significant level of expertise and judgment.
Dynamic Market Conditions: The matrix represents a snapshot at a particular time point. It may not account for future changes in market conditions or internal business dynamics.
Overemphasis on Market Attractiveness: Some critics argue that the matrix places too much emphasis on market attractiveness and may undervalue the potential of business units in currently less attractive markets.
While the GE-McKinsey Matrix provides detailed insights for strategic portfolio management, businesses must understand its limitations. A company should use it as one of several tools in their strategic planning process, balancing its insights with other analysis models and business intelligence. It is also crucial to regularly update the analysis to keep up with changing market conditions and internal dynamics.
Conclusion
In summary, using the GE-McKinsey Matrix involves assessing the various factors that influence a business unit's success, rating and weighting them, plotting the results on the matrix, and deciding on strategic actions based on their position. This approach enables businesses to effectively manage their portfolios, balancing investments and resources across multiple departments.
However, it requires in-depth market analysis and honest internal assessment to be effective. This means that companies need to have an in-depth understanding of market trends, the competitive environment, their own strengths and weaknesses, and other aspects. Only in this way can the company accurately assess the strength of each business unit and formulate appropriate strategic actions based on its position in the matrix.
At the same time, the GE-McKinsey matrix also requires companies to continuously monitor and adjust. The market environment is constantly changing, and the internal situation of enterprises will also change over time. Therefore, companies need to regularly update their matrices to reflect the latest market and internal conditions.
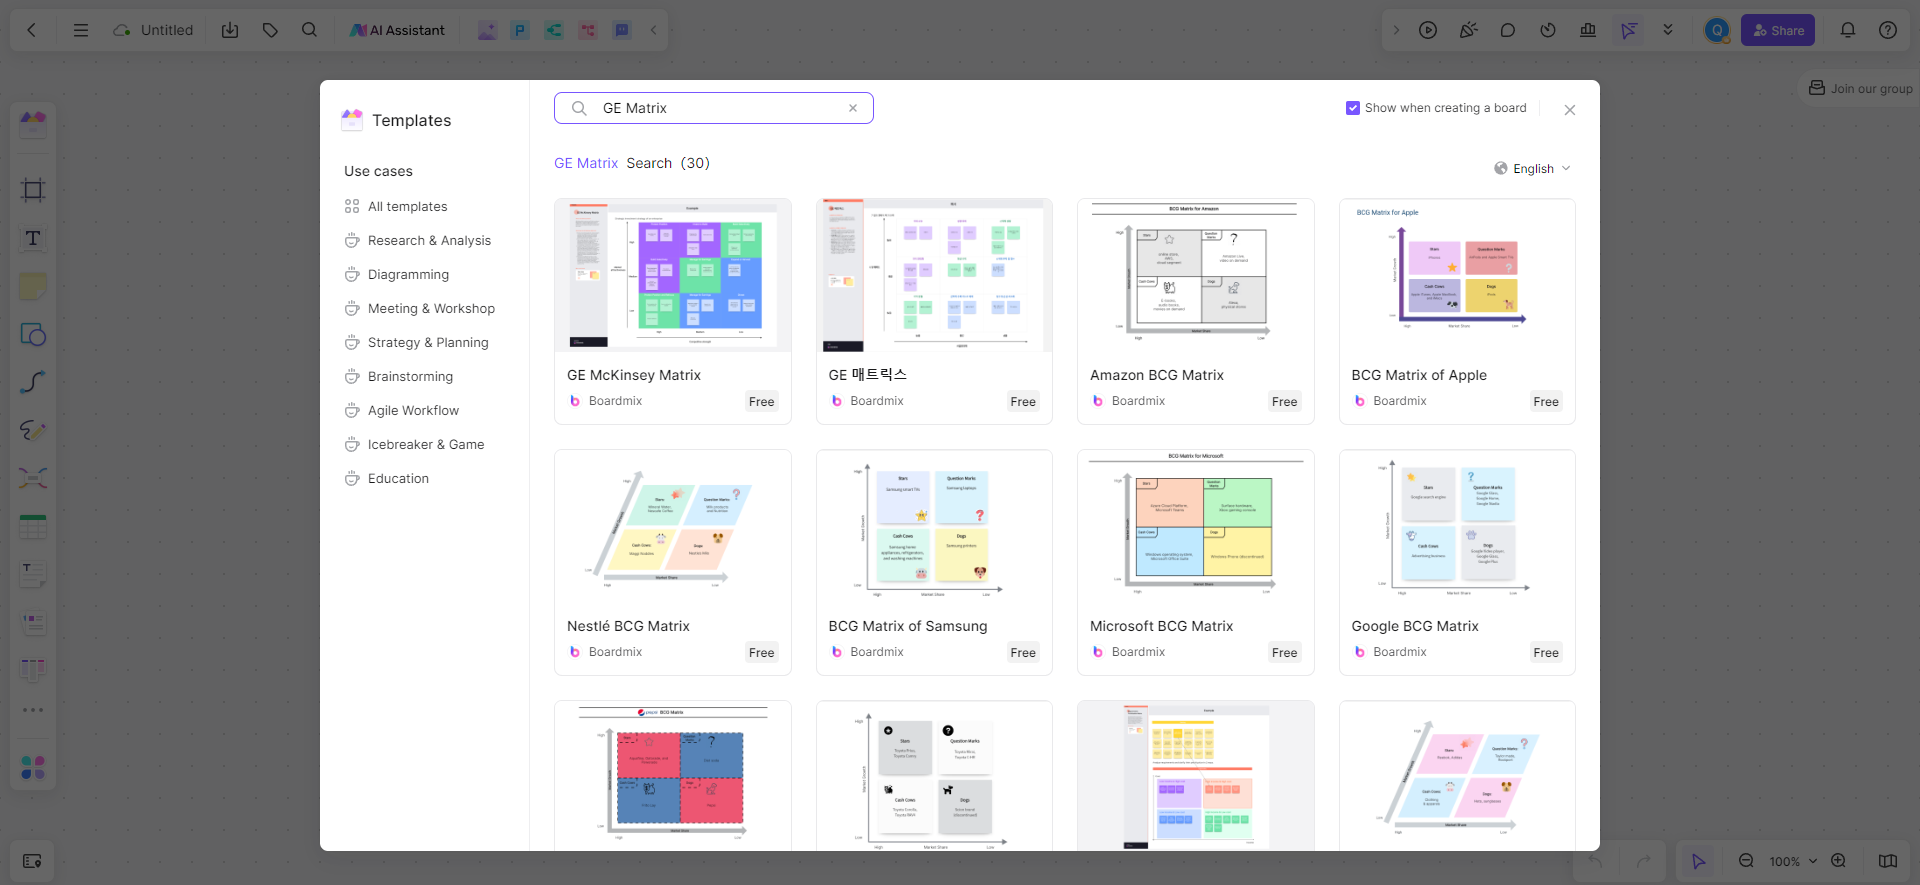
There are free GE-McKinsey matrix template provided in Boardmix. Companies can use this template to simplify the process of evaluating and drawing the matrix, thus saving time and resources. This template can also help businesses more intuitively understand the structure of their portfolios, allowing them to make more informed decisions.


