


In the realm of corporate strategy, effective strategic management models play a crucial role. The GE-McKinsey Matrix is one such model that has consistently proven its value across industries and markets worldwide. This in-depth article aims to provide an understanding of what the GE-McKinsey Matrix is and its vital purpose in shaping corporate strategy.
What is the GE-McKinsey Matrix?
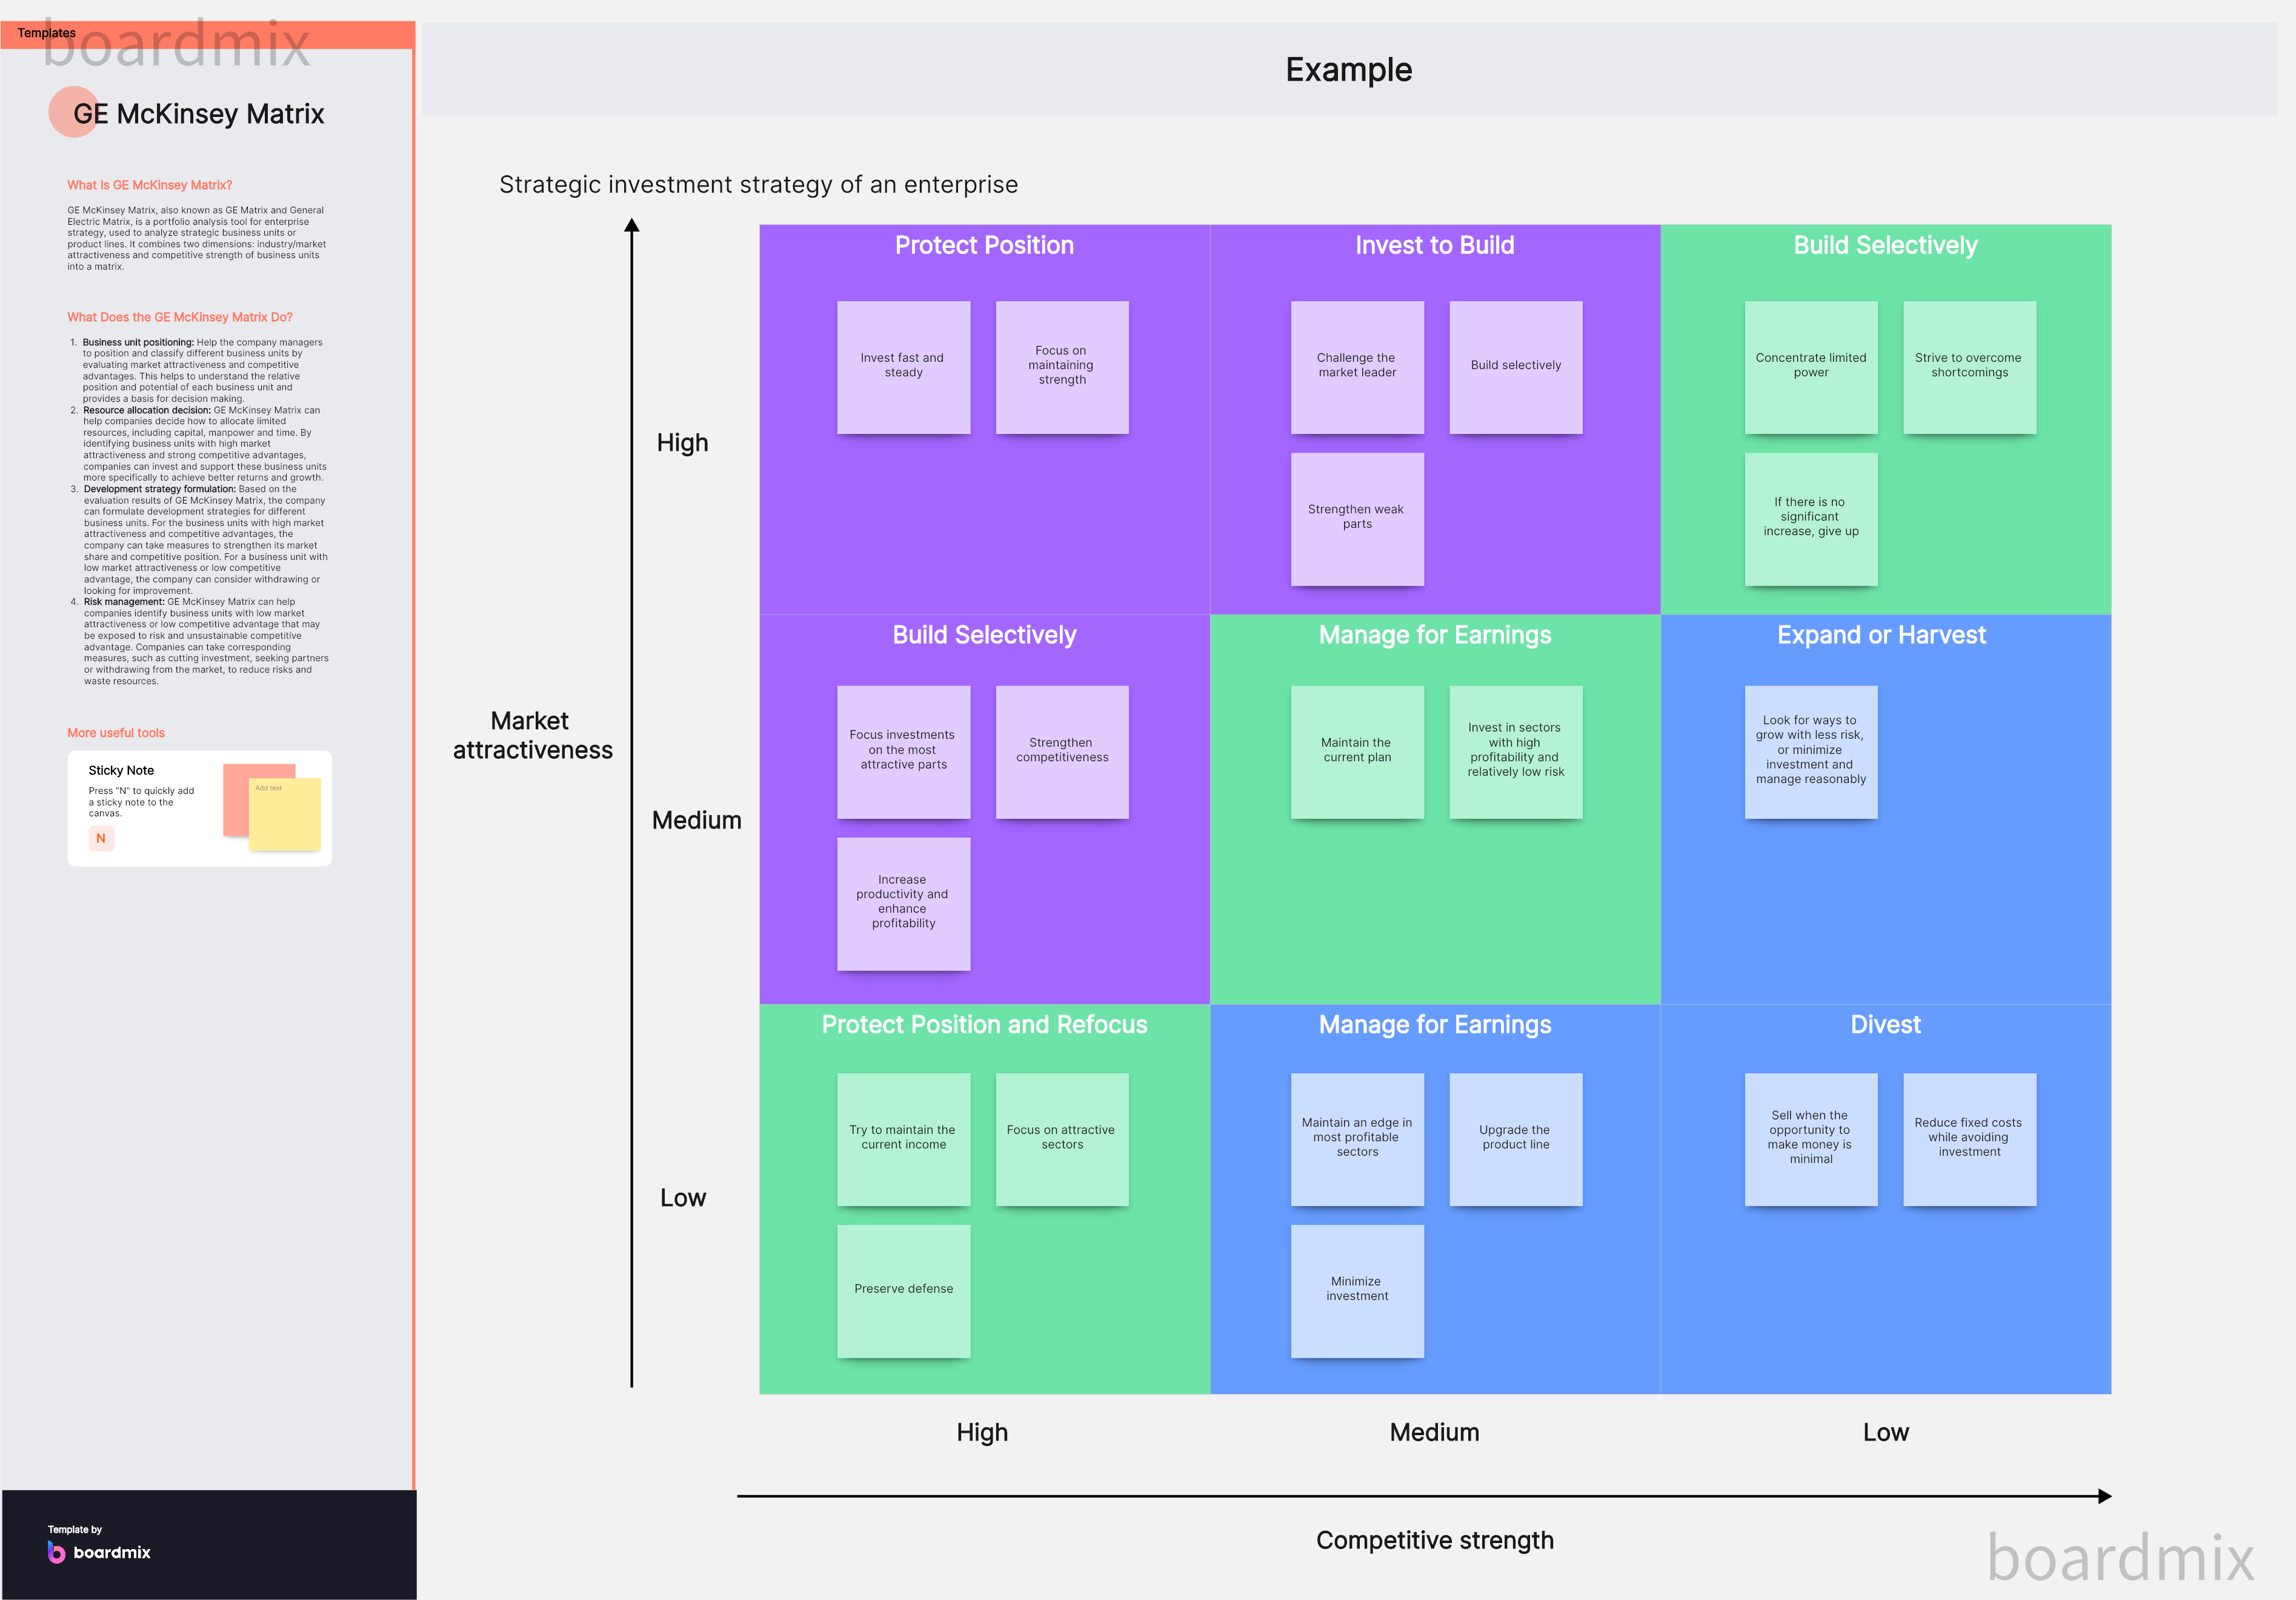
In the realm of strategic management, The GE-McKinsey Matrix, also referred to as the Nine-Box Matrix, is a powerful tool that can help corporations make informed decisions regarding their portfolio of business units. This matrix relies on two crucial parameters - Industry Attractiveness and Competitive Strength - to plot business units and determine their strategic significance.
The Nine-Box Matrix is a 3x3 grid with industry attractiveness plotted on the vertical axis and competitive strength on the horizontal axis. Each cell of the matrix represents a different level of industry attractiveness (high, medium, low) and competitive strength (strong, average, weak).
The GE-McKinsey Matrix, also referred to as the General Electric Business Screen, was first introduced in the 1970s by McKinsey & Company for General Electric. This strategic tool was intended to be an enhancement over the then popular Boston Consulting Group (BCG) Matrix.
Unlike the BCG Matrix, which primarily uses market growth and market share as evaluation parameters, the GE-McKinsey Matrix takes into account a broader range of factors. It adopts a more granular and comprehensive analysis, assessing industry attractiveness and business unit strength as its two major dimensions. This meticulous approach makes the GE-McKinsey Matrix an invaluable tool for strategic business management.
Purpose of GE-McKinsey Matrix in Corporate Strategy
The fundamental purpose of the GE-McKinsey Matrix lies in its ability to guide companies in making insightful strategic decisions, particularly regarding investment for future growth. By placing business units within the matrix based on industry attractiveness and business unit strength, organizations can discern which units to develop further, maintain as they are, or divest from.
Moreover, the matrix facilitates companies in identifying any potential gaps within their business portfolios. This could highlight the absence of businesses operating in attractive industries or the presence of strong business units stuck in unattractive industries. Once these gaps are recognized, firms can take informed measures to bridge them via strategic decisions such as making acquisitions or divestments.
In essence, the GE-McKinsey Matrix serves as a powerful instrument providing a methodical approach to portfolio management and investment strategy planning. Its consideration of business strength and industry attractiveness in a nuanced way provides it a clear edge over other strategic planning models. Whether you're a multinational conglomerate contemplating resource allocation or an emerging startup deciding on which industry to tap into, understanding and employing this matrix can significantly influence your strategic decision-making process.
How is Competitive Strength Measured in GE-McKinsey Matrix?
Competitive Strength, also referred to as Business Unit Strength, is a core axis of the GE-McKinsey Matrix. It evaluates the strength of a business unit within an industry relative to its competitors. This strength becomes a determinant in the strategic decisions concerning investment allocation.
The measurement of competitive strength involves the evaluation of several factors. Each factor is given a weight based on its importance, and then it is scored. The sum of these weighted scores forms the competitive strength score. Below are some critical factors involved in measuring competitive strength.
1. Market Share: A business unit with a larger market share often signifies a stronger position within the industry.
2. Brand Equity: Brand recognition and reputation can heavily impact a business's competitive strength. Brands with high recognition often have stronger bargaining power and customer loyalty.
3. Product Quality: If a business unit offers high-quality products that outperform competitors, it stands to gain a stronger competitive position.
4. Management Strength: Superior management capabilities can be an excellent asset for a business unit, contributing to its overall competitive strength.
5. Cost Structure: A favorable cost structure, such as lower cost of production or operations, can provide a competitive edge to the business unit.
6. Access to Resources and Assets: Availability of and access to essential resources and assets such as proprietary technology, prime locations, patents, etc., also contribute to a unit's competitive strength.
7. Customer Loyalty: A loyal customer base is a strong indication of a robust competitive position.
The specific factors and their relative weights may vary depending on the industry and the specific circumstances of the company.
Measuring competitive strength in the GE-McKinsey Matrix involves assessing several critical factors. This comprehensive evaluation allows corporations to better understand their standing in the market landscape and to make informed strategic decisions regarding resource allocation.
How to Plot Business Units in the Nine-Box Matrix?
Each business unit is evaluated based on industry attractiveness and competitive strength and then plotted in the relevant cell within the matrix. Here's how each dimension is measured:
Industry Attractiveness: Factors such as market growth rate, industry size, profit margins, competitive structure, technology development, regulatory environment, and so on, contribute to an industry's attractiveness score.
Competitive Strength: Aspects like market share, brand equity, cost competitiveness, product quality, management capabilities, access to resources and assets, and customer loyalty are evaluated to determine a business unit's competitive strength score.
Once all business units are plotted on the matrix, they fall into one of nine strategic zones which guide investment decision-making.
How to Use GE-Mckinsey Matrix for Strategic Decision-Making?
The position of a business unit within the matrix dictates the strategic approach for that unit:
Grow/Invest (High Attractiveness/Strong Strength): These are business units operating in attractive industries where the corporation has strong competitive strength. The strategy here would be to invest more resources to expand these units.
Select/Earn (Medium Attractiveness/Average Strength): These are average units that generate steady cash flows but require selective investment.
Harvest/Divest (Low Attractiveness/Weak Strength): Units falling in this zone are operating in less attractive industries where the corporation also has a weak competitive position. These might be considered for divestiture.
To sum up, by using the GE-Makinsey Matrix to plot business units based on industry attractiveness and competitive strength, corporations can gain significant insights into their portfolio structure. This understanding can then guide them in strategic decision-making and resource allocation to drive growth and profitability.
How to Use GE-McKinsey Matrix for Portfolio Analysis?
Here is a step-by-step process on how to use this matrix for portfolio analysis:
Determine Industry Attractiveness: Evaluate each business unit's industry based on factors such as market growth rate, competitive intensity, market profitability, and technological advancements.
Assess Business Unit Strength: For each unit, assess factors like market share, brand strength, product quality, and customer loyalty to determine its competitive strength within the industry.
Plot Business Units on the Matrix: Based on these evaluations, plot each business unit in the appropriate cell within the matrix.
Analyze the Portfolio Structure: Once all units are plotted, analyze the overall portfolio structure. It can provide insights into how well your company is balanced across high-growth and low-growth industries and where your strengths lie.
How to Prioritize Investments with the GE-McKinsey Matrix?
Once the portfolio structure is analyzed using the matrix, corporations can strategically decide where to allocate resources:
High Attractiveness/Strong Strength Quadrant: Business units that fall into this quadrant have both high industry attractiveness and strong competitive positions. Corporations should prioritize investments in these units to leverage growth opportunities.
Medium Attractiveness/Average Strength Quadrant: These business units perform adequately but may need targeted investments to boost their position or to maintain their performance.
Low Attractiveness/Weak Strength Quadrant: Units that fall into this category are prime candidates for divestiture. They operate in unattractive industries where the corporation also has a weak competitive position.
Conclusion
The GE-McKinsey Matrix plays a crucial role in investment portfolio analysis by helping businesses visualize their portfolio structure and determine investment priorities among business units. By utilizing this tool, enterprises can ensure strategic investment decisions that drive profit growth.

Boardmix offers a free GE-McKinsey Matrix template, allowing businesses to visualize their investment structure online and share it. With the free templates provided by Boardmix, companies can easily build their GE-McKinsey Matrix online without the need for cumbersome manual operations. This visualization tool significantly enhances work efficiency and facilitates communication and collaboration among team members. Businesses can share their investment structure with all relevant stakeholders, ensuring everyone has a clear understanding of the company's strategic direction.


