


Family dynamics play a crucial role in shaping an individual's behavior, values, and perceptions. Understanding these dynamics can provide insights into recurring patterns, unresolved issues, and the transmission of values and beliefs across generations. One effective tool used by therapists and social workers to visualize and analyze these patterns is the genogram. In this article, we will explore the concept of genograms, and their significance, and provide a detailed example to illustrate how they work.
What Is a Genogram
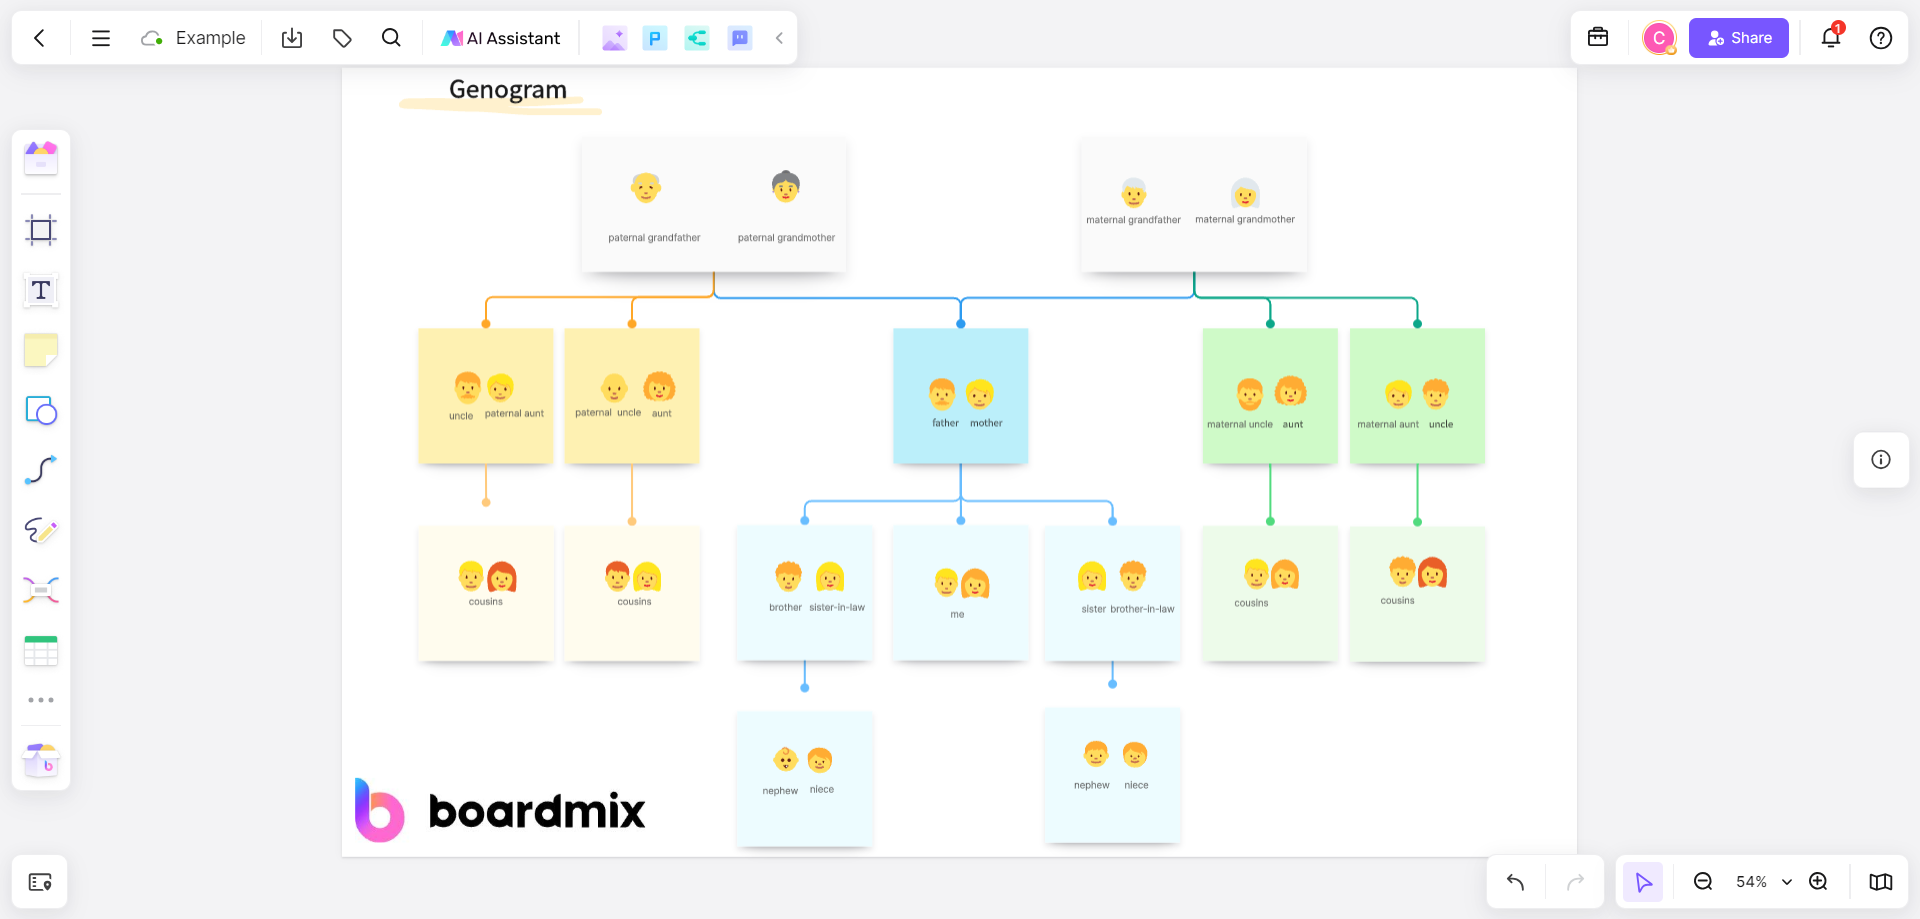
A genogram is a graphical representation of a person's family tree that includes not only the biological connections but also the emotional and relational ties among family members. It's a tool that helps identify and understand the complex web of relationships, communication patterns, and family roles that influence individual and family functioning.
Components of a Genogram
Before diving into an example, let's understand the key components that make up a genogram:
Family Members: Represented by symbols that indicate gender, age, and sometimes health status.
Relationships: Lines connecting family members indicate the nature of their relationship (e.g., marriage, divorce, adoption).
Family Subsystems: Smaller groups within the family, such as parents and children or siblings.
Boundaries: Dotted lines that show the level of closeness or distance between family members or subsystems.
Family Functions: Symbols or annotations that represent roles, alliances, and power dynamics.
The Significance of Genograms
Genograms are valuable for several reasons:
Pattern Identification: They reveal recurring themes and patterns across generations.
Communication Analysis: They help understand how family members communicate and interact.
Problem Solving: By visualizing family dynamics, genograms can assist in identifying and addressing issues.
Intergenerational Healing: They can aid in understanding and breaking negative cycles that affect family members.
Genogram Examples Explained: The Smith Family
Let's consider the Smith family as an example to illustrate the construction and interpretation of a genogram.
Generations: The Smith family consists of three generations, with Grandparents (George and Mary), Parents (John and Sarah), and Children (Emma and Max).
Marriages and Divorces: John and Sarah are married, indicated by a solid line. However, there's a diagonal line through George's symbol, indicating a past divorce.
Subsystems: John and Sarah form a nuclear family subsystem with their children. There's also an extended family subsystem that includes the grandparents.
Boundaries: A dotted line circles the nuclear family, showing a clear boundary and separation from the extended family.
Family Functions: Sarah has a double line around her symbol, indicating that she holds a significant role in the family, possibly as the primary caregiver.
Patterns and Issues of Genogram
Intergenerational Transmission: The diagonal line through George's symbol suggests a history of divorce, which might influence John's views on marriage.
Emotional Connections: The close proximity of the symbols for John and Sarah, and their children, indicates a strong emotional bond within the nuclear family.
Health Concerns: A medical symbol next to Mary indicates a health issue that might affect the family dynamics.
Interpreting and Applying Genogram Insights
Once a genogram is constructed, it can be analyzed to identify patterns and issues. Therapists might use this information to facilitate discussions about family roles, communication styles, and potential areas of conflict or stress.
In the case of the Smith family, the genogram might lead to conversations about how past experiences, such as George's divorce, impact current family dynamics. It could also prompt discussions about Sarah's role in the family and how her health might be managed to maintain family's well-being.
10 Genogram Examples of Different Family Types
Genograms are a versatile and insightful tool for visualizing the intricate dynamics within families. They offer a snapshot of relationships, roles, and patterns across generations. Here are ten diverse genogram examples that illustrate various aspects of family life, from simple nuclear families to complex blended households. To build your own genogram, go to Boardmix and start it for free.
1. The Traditional Nuclear Family
This genogram represents a typical two-parent, two-child family with no history of divorce or remarriage. The parents are married, and the children are biologically related to both.
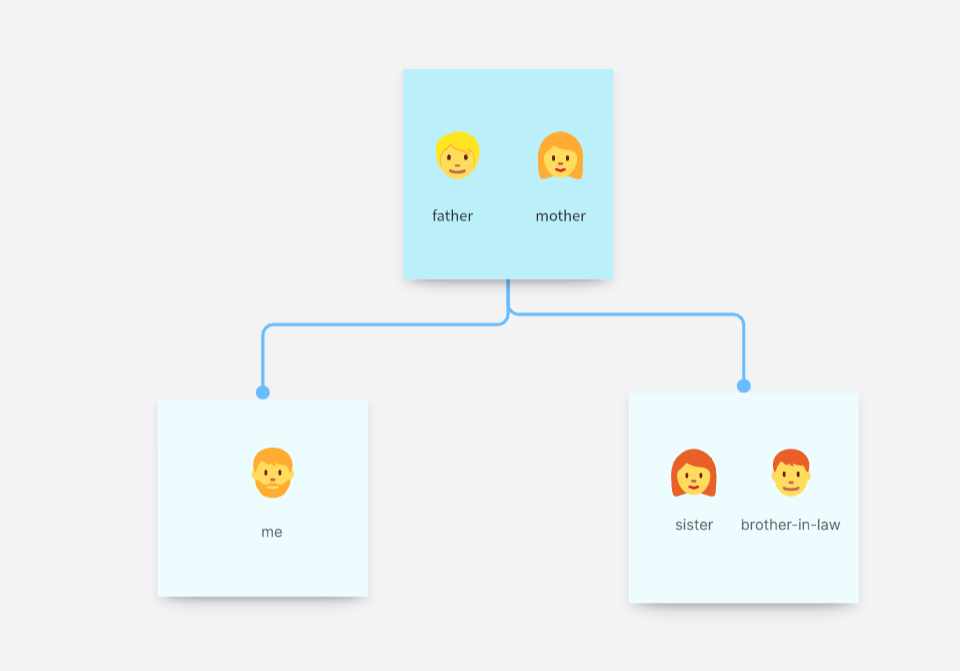
Key Features:
Clear boundaries between the family and extended family.
Equal distance between family members, indicating a balanced family system.
Solid lines connecting family members, signifying strong emotional bonds.
2. The Single-Parent Household
This example features a single mother with two children, highlighting the challenges and strengths of single-parent families.
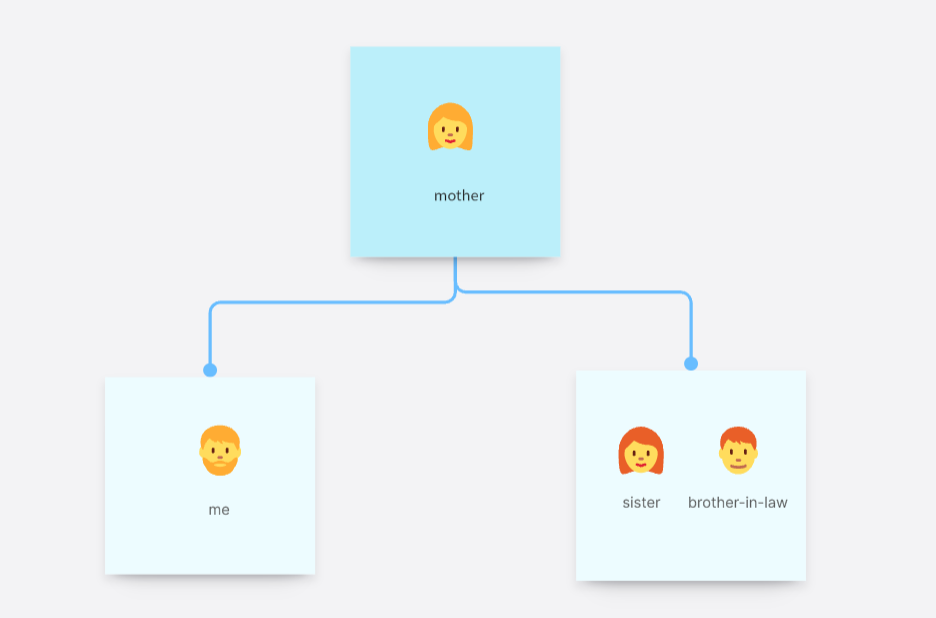
Key Features:
A clear boundary around the family subsystem.
The single parent may have a dual role, indicated by a double-lined symbol.
Potential for stronger bonds between the single parent and children.
3. The Blended Family
This genogram depicts a family formed by a second marriage, where both parents bring children from previous relationships.
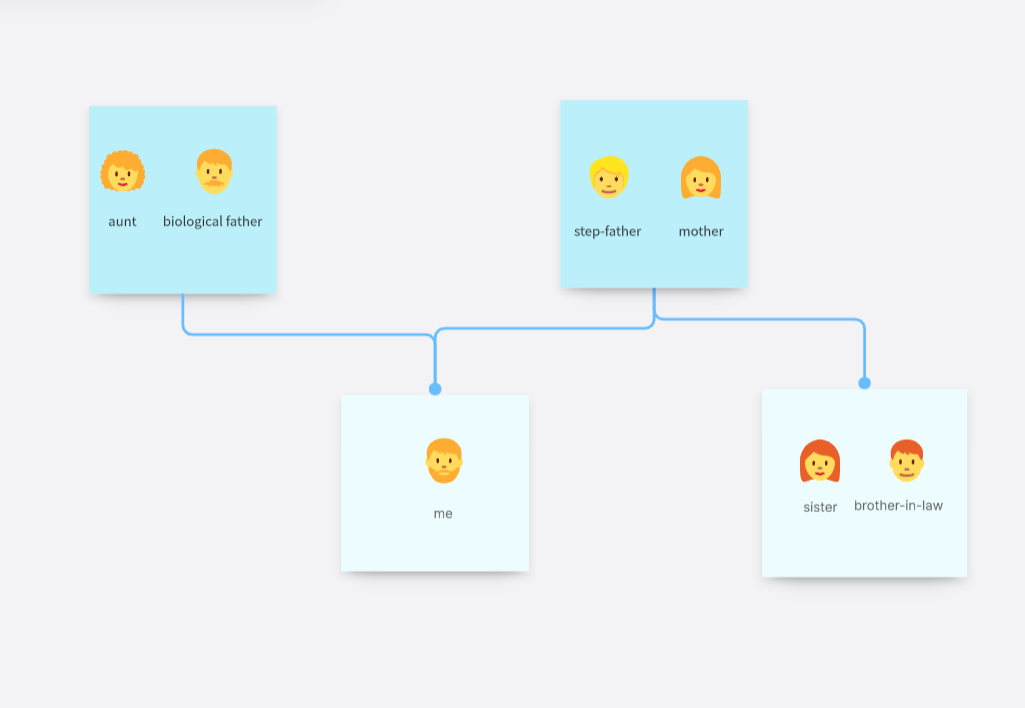
Key Features:
Differentiation between biological and step-relationships.
Dotted lines indicate the potential for more permeable boundaries.
The possibility of alliances and role confusion, especially among step-siblings.
4. The Multigenerational Family
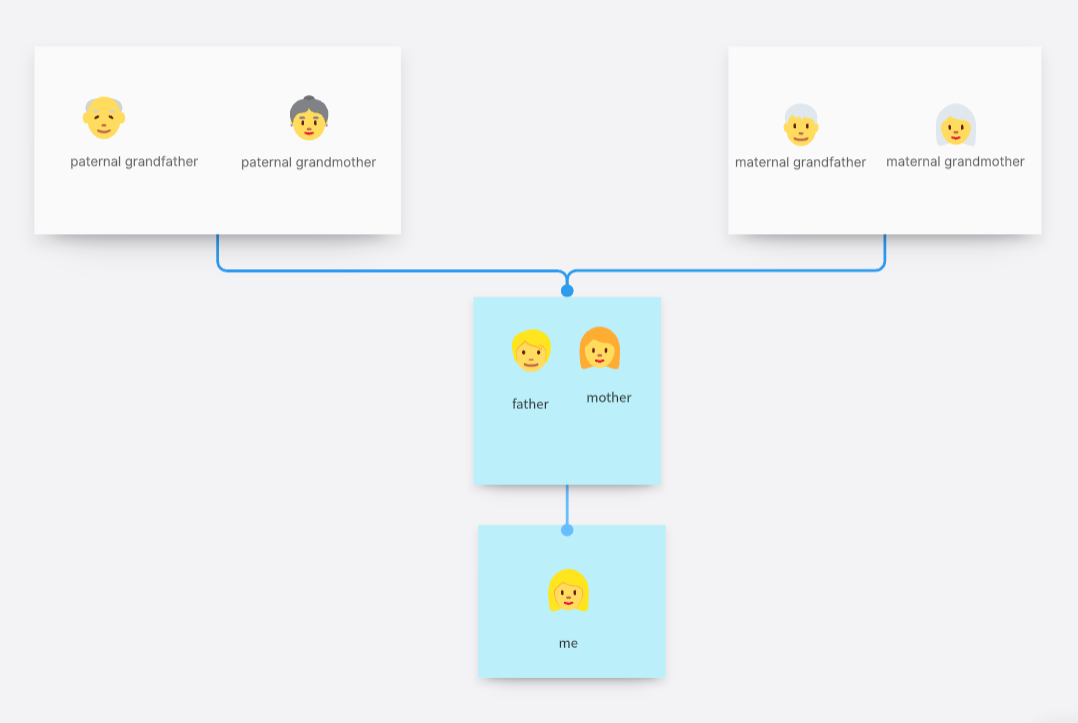
This example shows a family where grandparents live with their adult children and grandchildren, a common arrangement in many cultures.
Key Features:
Overlapping subsystems, with grandparents often involved in daily family life.
Potential for intergenerational support and learning.
The need to manage boundaries and respect for privacy.
5. The Family with Adopted Children
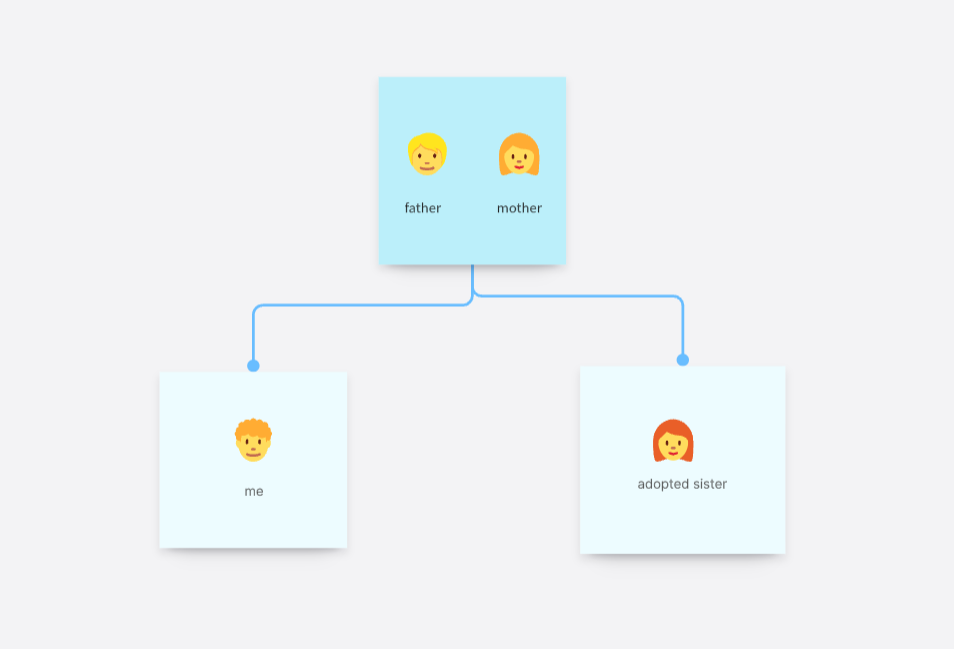
This genogram illustrates a family that has adopted two children, emphasizing the importance of chosen family bonds.
Key Features:
Adoption lines distinct from biological lines, but with equal emotional weight.
Symbols indicating the adoptive parents' commitment to their children.
The potential for unique family roles and narratives.
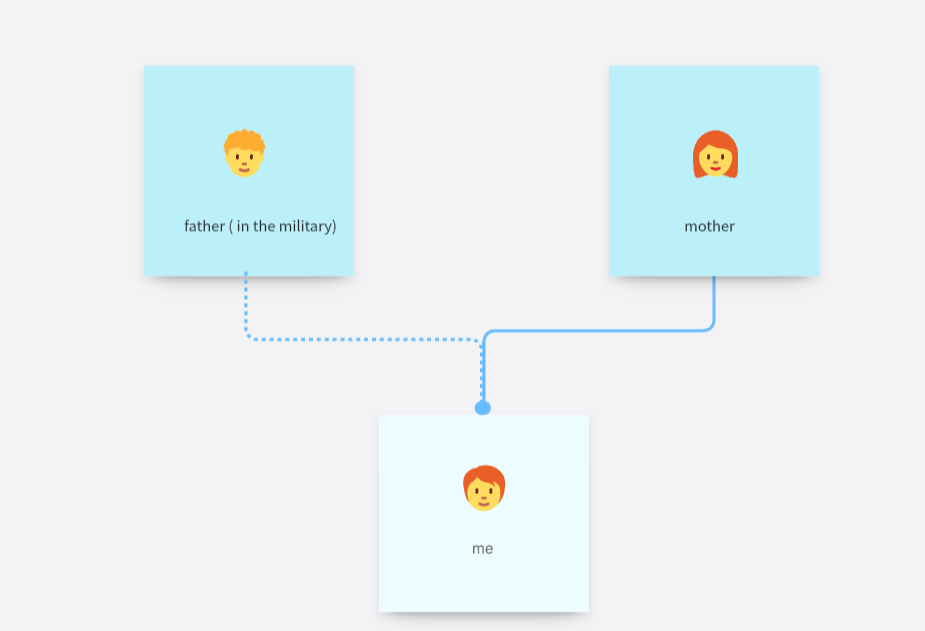
6. The Family with a Parent in the Military
This example represents a family where one parent is frequently deployed due to military service.
Key Features:
Dotted lines or broken lines represent the physical absence and the emotional presence of the deployed parent.
The central role of the remaining parent in managing family life.
The impact of deployment on family dynamics and communication.
7. The Family with a Child with Special Needs
This genogram shows a family with a child who has special needs, highlighting the family's adaptation and support systems.
Key Features:
A larger symbol or a special symbol for the child with special needs.
The potential for increased involvement and stress on parents and siblings.
The importance of external support networks, such as therapists and special education services.
8. The Family with a History of Substance Abuse
This example depicts a family with a history of substance abuse, showing the impact on family relationships and functioning.
Key Features:
Symbols indicating the family members with substance abuse issues.
Dashed lines or zigzag lines to represent the instability and chaos in relationships.
The potential for enabling or codependent behaviors.
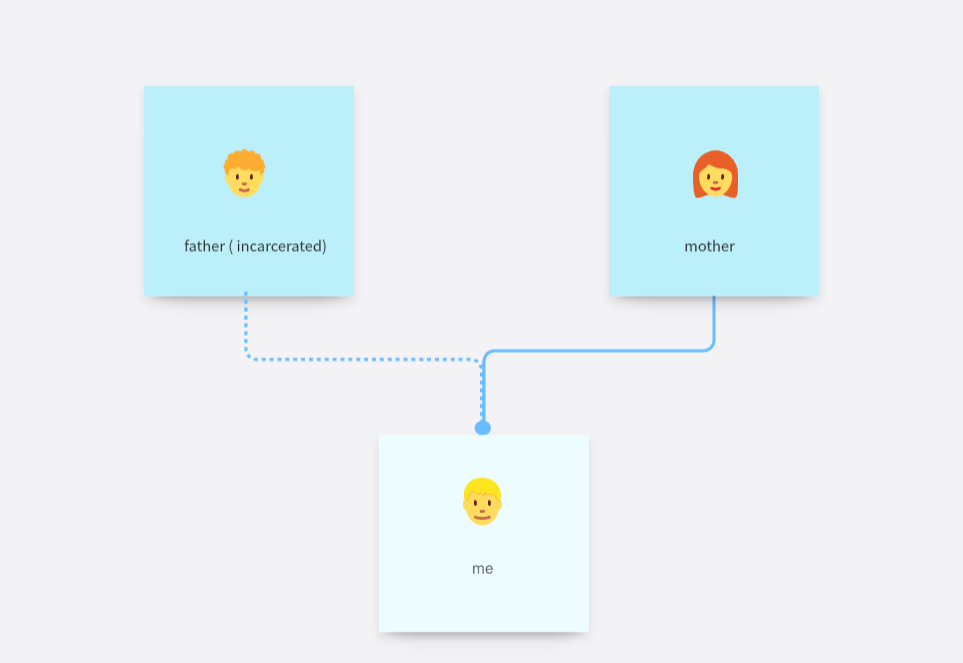
9. The Family with a Parent Who is Incarcerated
This genogram represents a family where one parent is incarcerated, illustrating the emotional and practical challenges this situation presents.
Key Features:
A broken or dashed line connecting the incarcerated parent to the rest of the family.
The potential for role reversal among children, who may take on adult responsibilities.
The importance of maintaining family connections despite the physical separation.
10. The Family with Immigrant Roots
This example shows a family with immigrant parents and second-generation children, highlighting cultural transmission and adaptation.
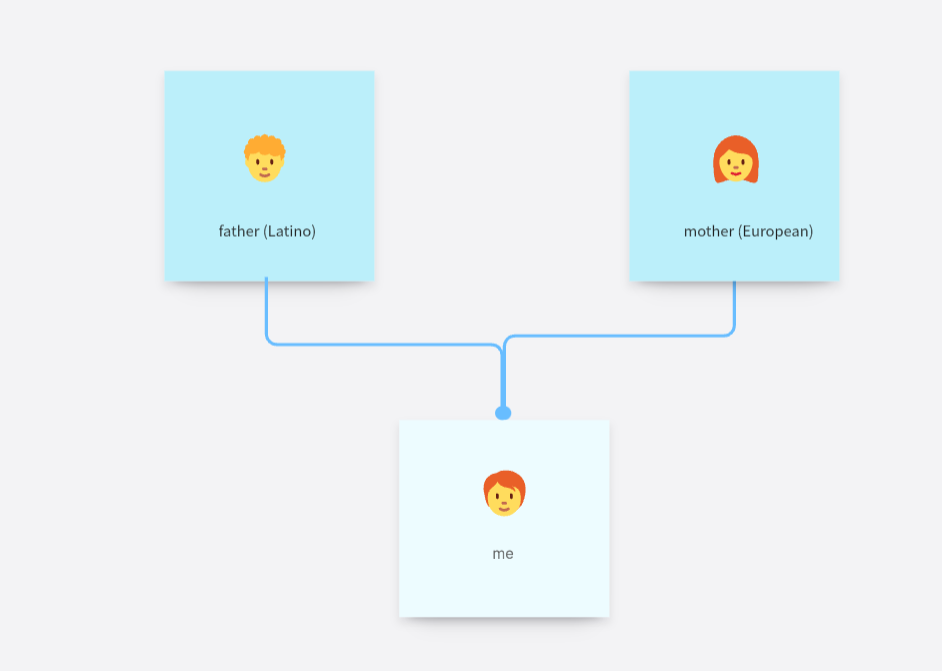
Key Features:
Symbols indicating the country of origin for the immigrant parents.
The potential for cultural conflict or enrichment between generations.
The importance of bicultural identity and maintaining family traditions.
These genogram examples provide a glimpse into the diverse shapes and structures of families. Each genogram tells a unique story, offering insights into the family's strengths, challenges, and dynamics. By understanding these visual representations, therapists, social workers, and families themselves can better navigate the complexities of family life and work towards healthier relationships.
Conclusion
Genograms are powerful tools for understanding and visualizing complex family dynamics. By identifying patterns, analyzing communication, and exploring intergenerational influences, they provide a foundation for addressing and resolving family issues. Whether used in a therapeutic setting or for personal reflection, genograms offer valuable insights into the intricate web of relationships that shape our lives. Start building your won genogram in Boardmix for free today!


