


A profound understanding of visual tools is crucial for effective communication of complex information. This article aims to shed light on one such tool, the Venn Diagram, its structure, purpose, and practical examples. Let’s get started!
Introduction to Venn Diagrams
Venn diagrams, named after British mathematician John Venn, are simple yet powerful tools used to visualize relationships between different groups of elements. These diagrams are widely used in fields such as logic, statistics, and computer science.
A Venn diagram uses overlapping circles to illustrate the mathematical or logical relationships between different groups of things. Each circle represents a group or a set. The area where the circles overlap represents the commonality between the sets.
Venn diagrams are important because they visually illustrate the relationships between concepts. They can represent complex information in a clear and straightforward way, making them a popular choice for educators, researchers, and data analysts.
Understand the Structure of a Venn Diagram
A typical Venn diagram consists of overlapping circles or other shapes, each representing a set. The number of circles corresponds to the number of sets you want to compare.
Every section in a Venn diagram has specific significance:
- The areas where the circles overlap represent the elements that the sets have in common.
- The areas inside the circles but outside the overlap represent elements that belong to one set only.
- The area outside all the circles represents elements not included in any of the sets.
The beauty of Venn diagrams lies in their simplicity and clarity, allowing us to understand complex relationships at a glance.
Venn Diagrams Types and Applications
Venn diagrams, with their simple yet impactful design, have broad applications across various fields. They can be categorized into different types based on the number of sets they represent. This article delves into the types of Venn diagrams and their real-world applications.
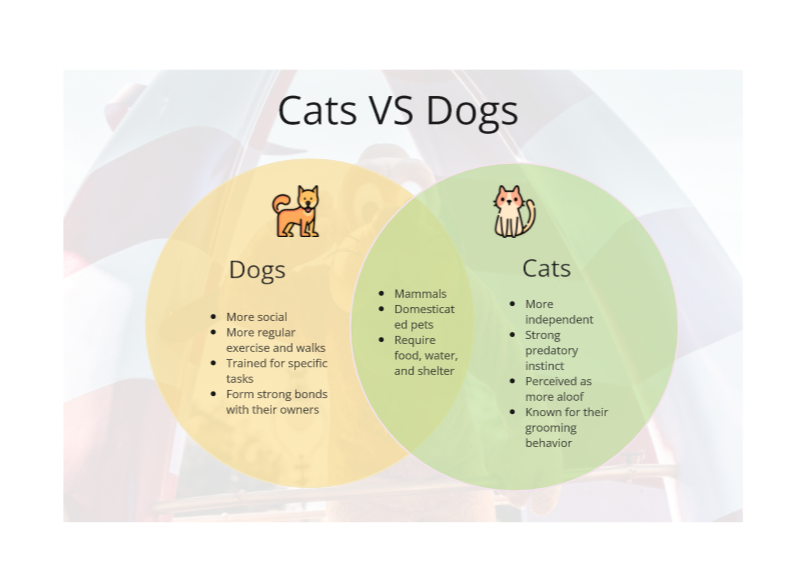
- Two-Set Venn Diagram
The most straightforward type is the two-set Venn diagram, representing two groups of items with a single area of overlap. This overlap indicates the common elements between the two sets.
Application: Two-set Venn diagrams are frequently used in primary education to teach basic logic, helping students visualize similarities and differences between two concepts or objects.
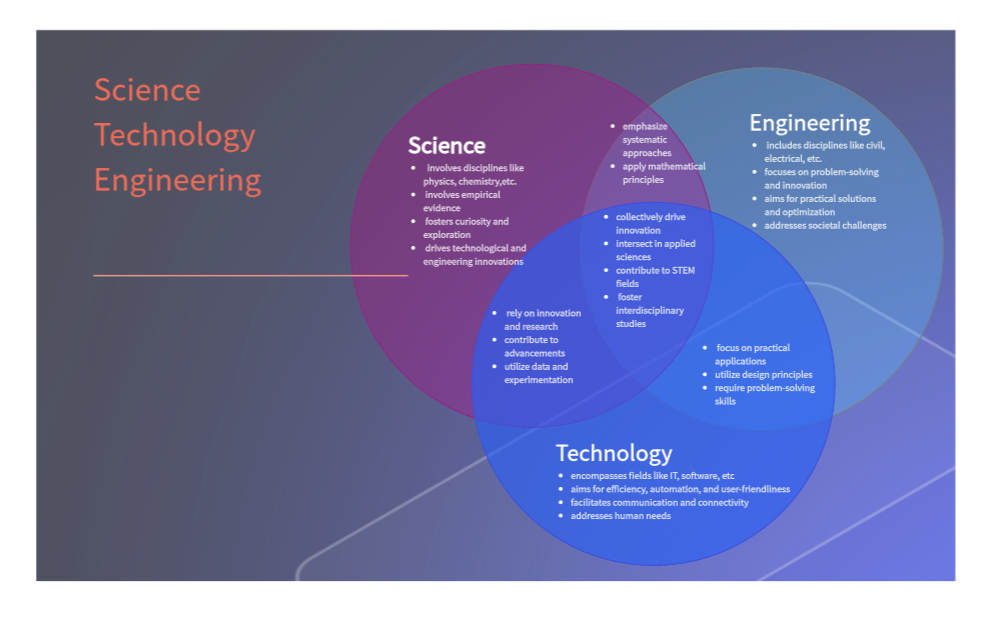
- Three-Set Venn Diagram
A three-set Venn diagram consists of three overlapping circles, representing three groups of items. This diagram type visualizes the relationships among three sets, with seven areas representing every possible intersection of these sets.
Application: These diagrams are extensively used in advanced academics and business for comparing and contrasting three different concepts or categories.
- Four-Set Venn Diagram
These diagrams consist of four overlapping circles, often arranged in a symmetrical pattern. A four-set Venn diagram provides fifteen distinct areas to represent different combinations of the four sets.
Application: Four-set Venn diagrams are beneficial in complex data analysis and decision-making processes where four different parameters need to be considered.
- Euler Diagram
While not strictly a Venn diagram, Euler diagrams are worth mentioning due to their similar structure. An Euler diagram only shows relationships that exist in the real world and might not include all possible overlaps between sets.
Application: Euler diagrams find use in information graphics, logic, and data visualization to depict actual relationships among different sets or categories.
Understanding different types of Venn diagrams is crucial for utilizing them effectively across diverse applications, from basic education to sophisticated data analysis. The beauty of these diagrams lies in their versatility and the ability to simplify complex data into visually intuitive illustrations.
10 Practical Examples of a Venn Diagram in Different Fields
From mathematics to business strategy, from computer science to social studies, this simple yet powerful tool has found its way into various domains. So, are you ready to explore the fascinating world of Venn Diagrams through these practical examples? Let's dive in!
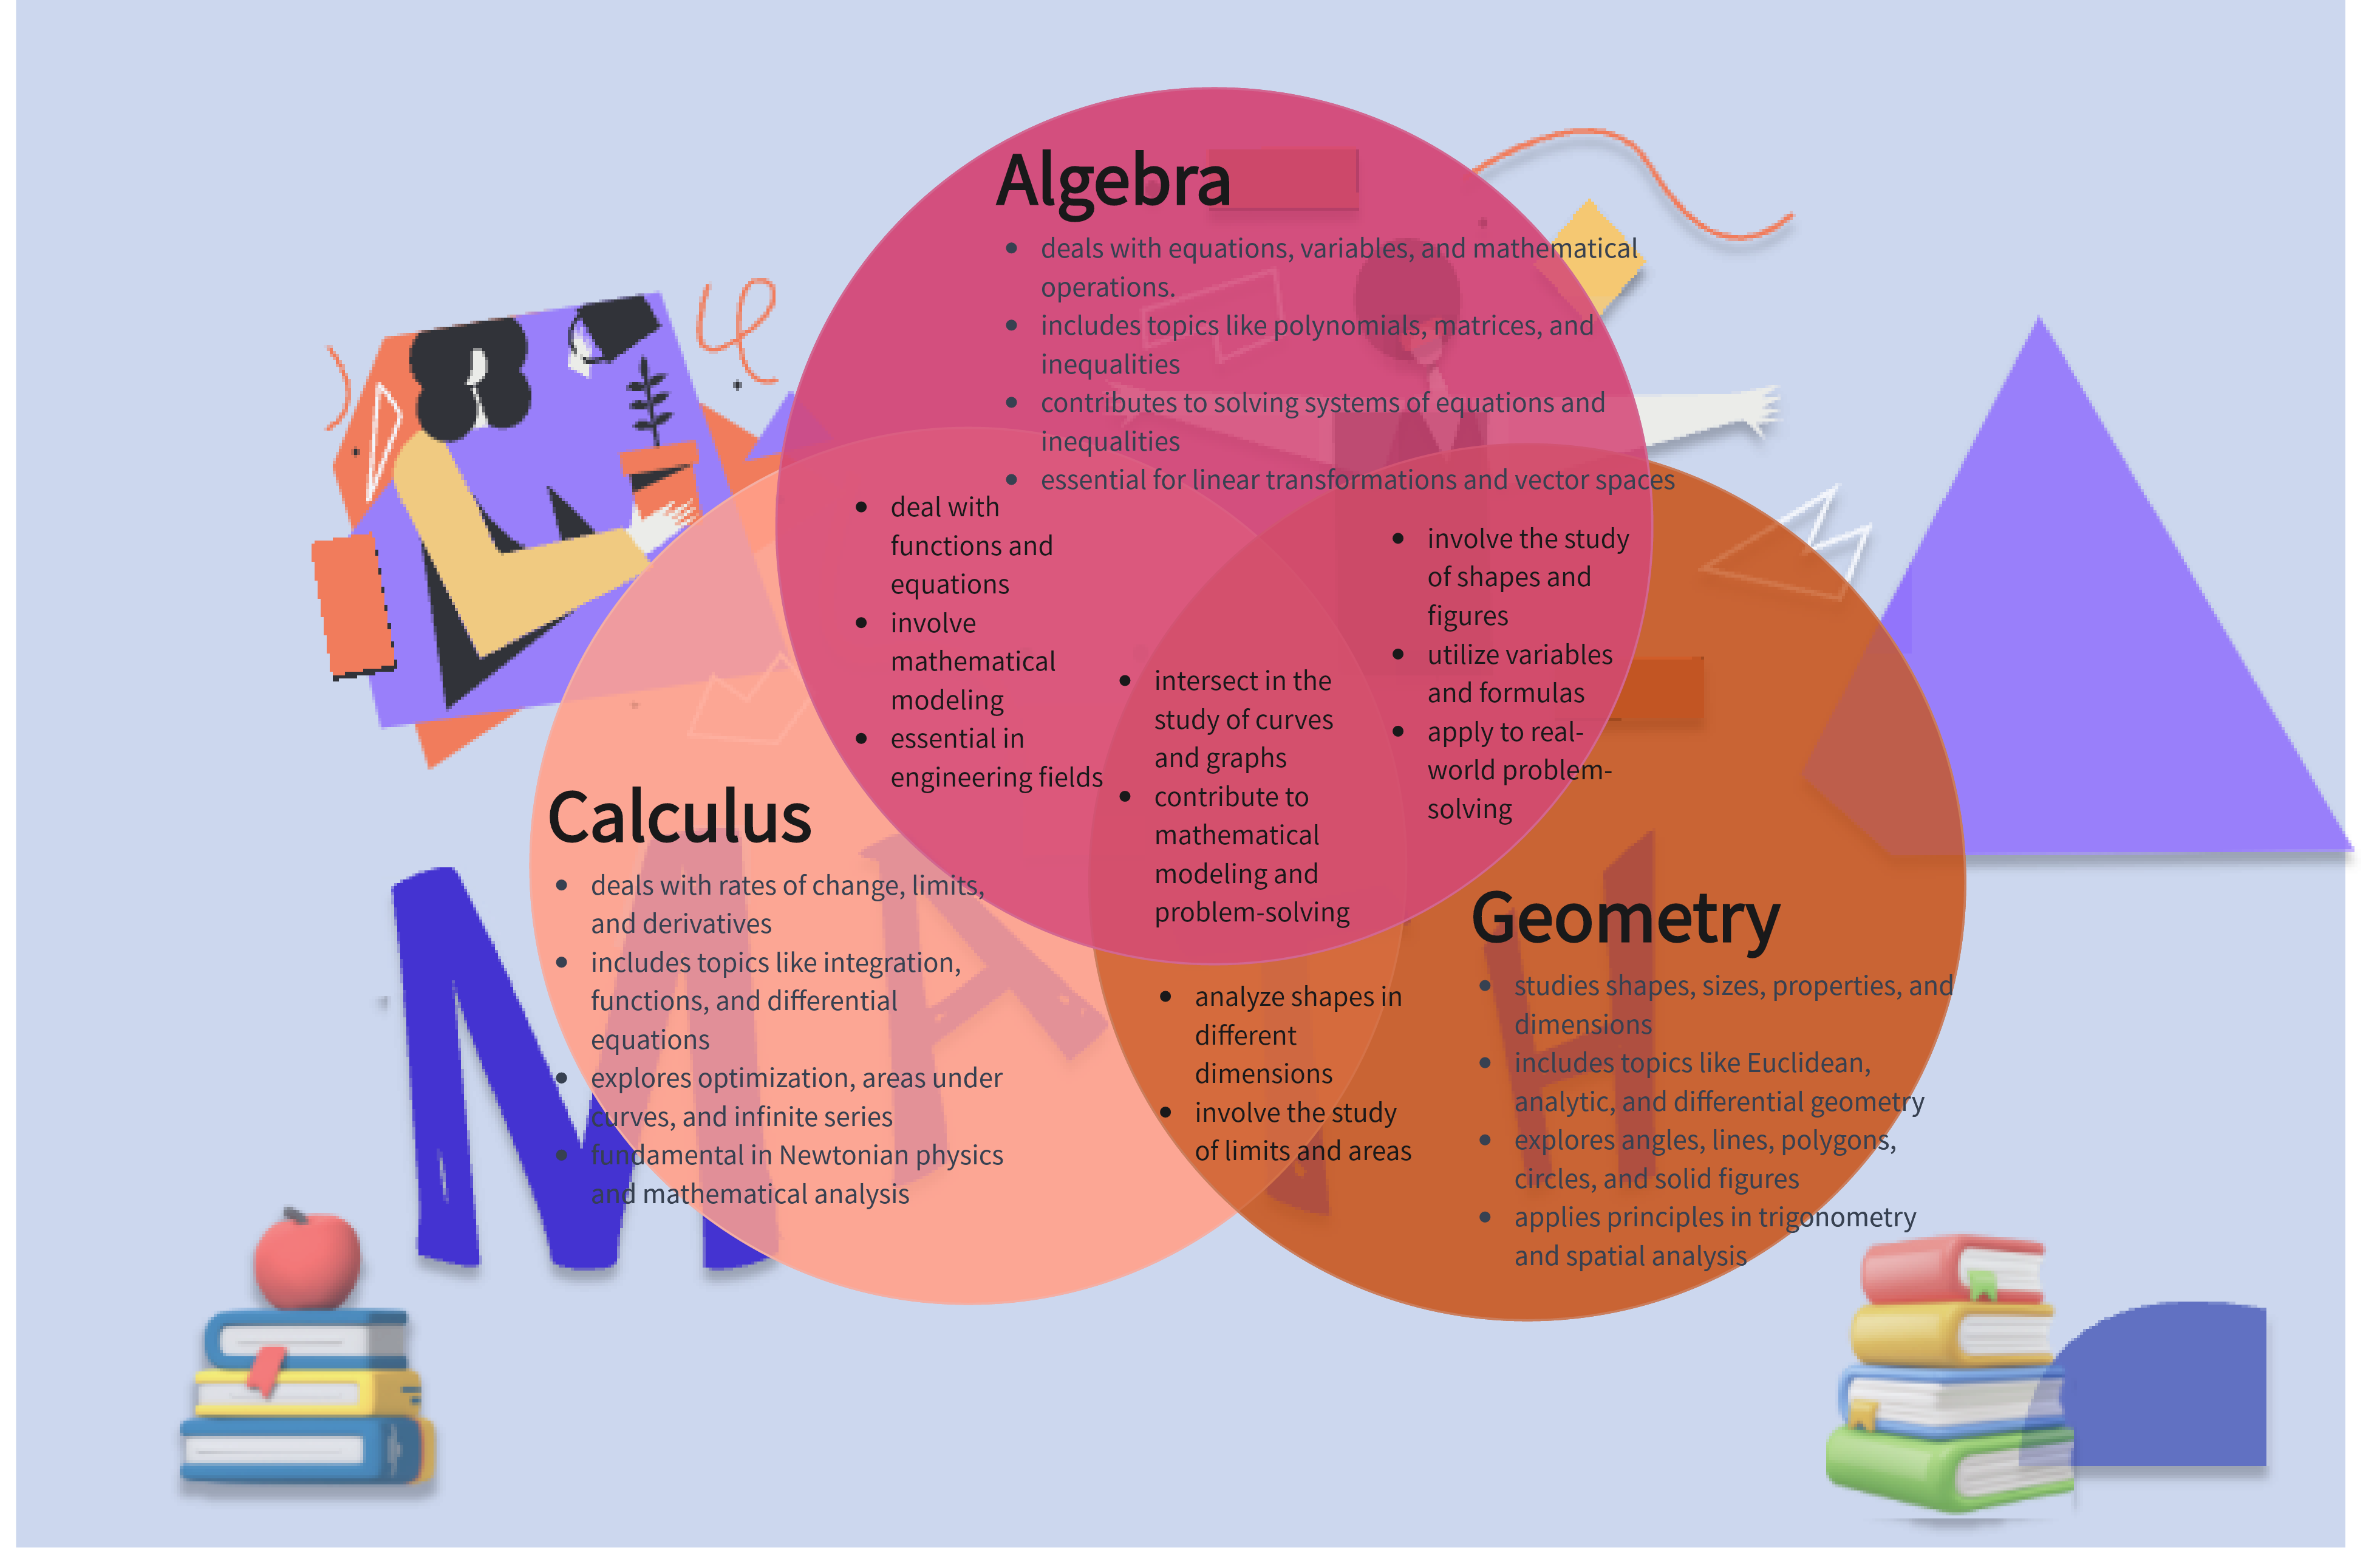
Example of a Venn Diagram in Math
In mathematics, a Venn diagram is a graphical representation of the relationships between sets. It is commonly used to illustrate the logical relationships between different sets, demonstrating the intersections and differences between them. They provide a visual and intuitive way to understand set theory concepts, including union, intersection, and complement.
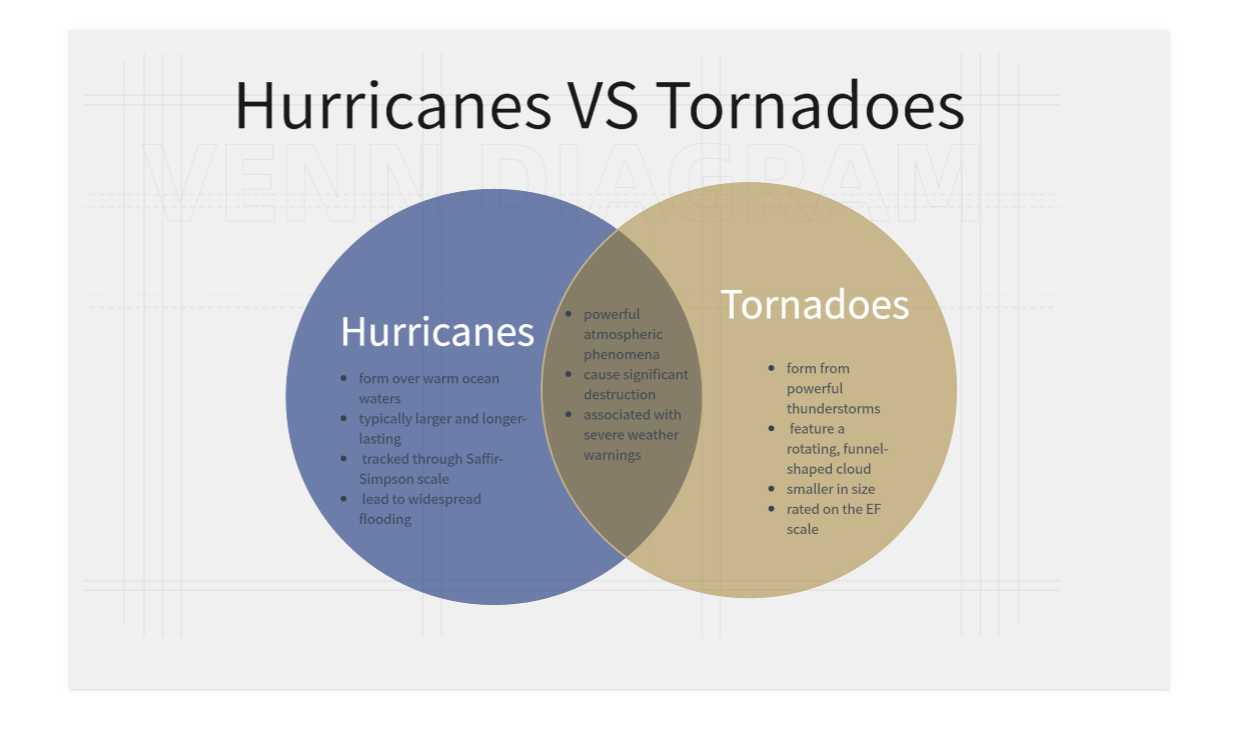
Example of Venn Diagram in Weather
A Venn diagram is a graphical representation commonly used in weather analysis to illustrate the relationships and commonalities between different weather phenomena or variables. Venn diagrams in weather analysis help communicate how various meteorological elements coincide or influence each other in specific weather conditions.
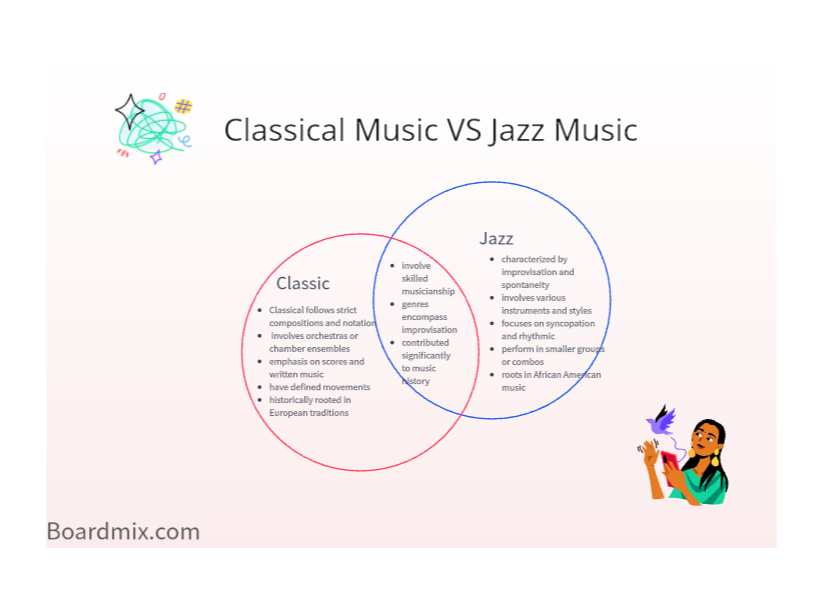
Example of Venn Diagram in Music
In the context of music, a Venn diagram is a visual representation that illustrates the relationships and commonalities between different musical elements, genres, or styles. It uses overlapping circles to show the intersection of these elements, highlighting areas of similarity or influence.
Example of Venn Diagram in Electronic Field
In the electronic field, a Venn diagram is a graphical representation that illustrates the relationships and commonalities between different sets of electronic components, signals, or systems. This visual tool is often employed to analyze the intersections and dependencies among various electronic elements, aiding in the understanding of complex systems, signal interactions, or component relationships within electronic circuits and devices.
Example of Venn Diagram in Bioscience
In bioscience, a Venn diagram is a graphical representation used to illustrate the relationships and commonalities between different sets of biological elements, such as genes, proteins, or biological processes. It is commonly employed in genomics, systems biology, and other branches of bioscience to analyze and communicate the overlapping features of various biological entities.
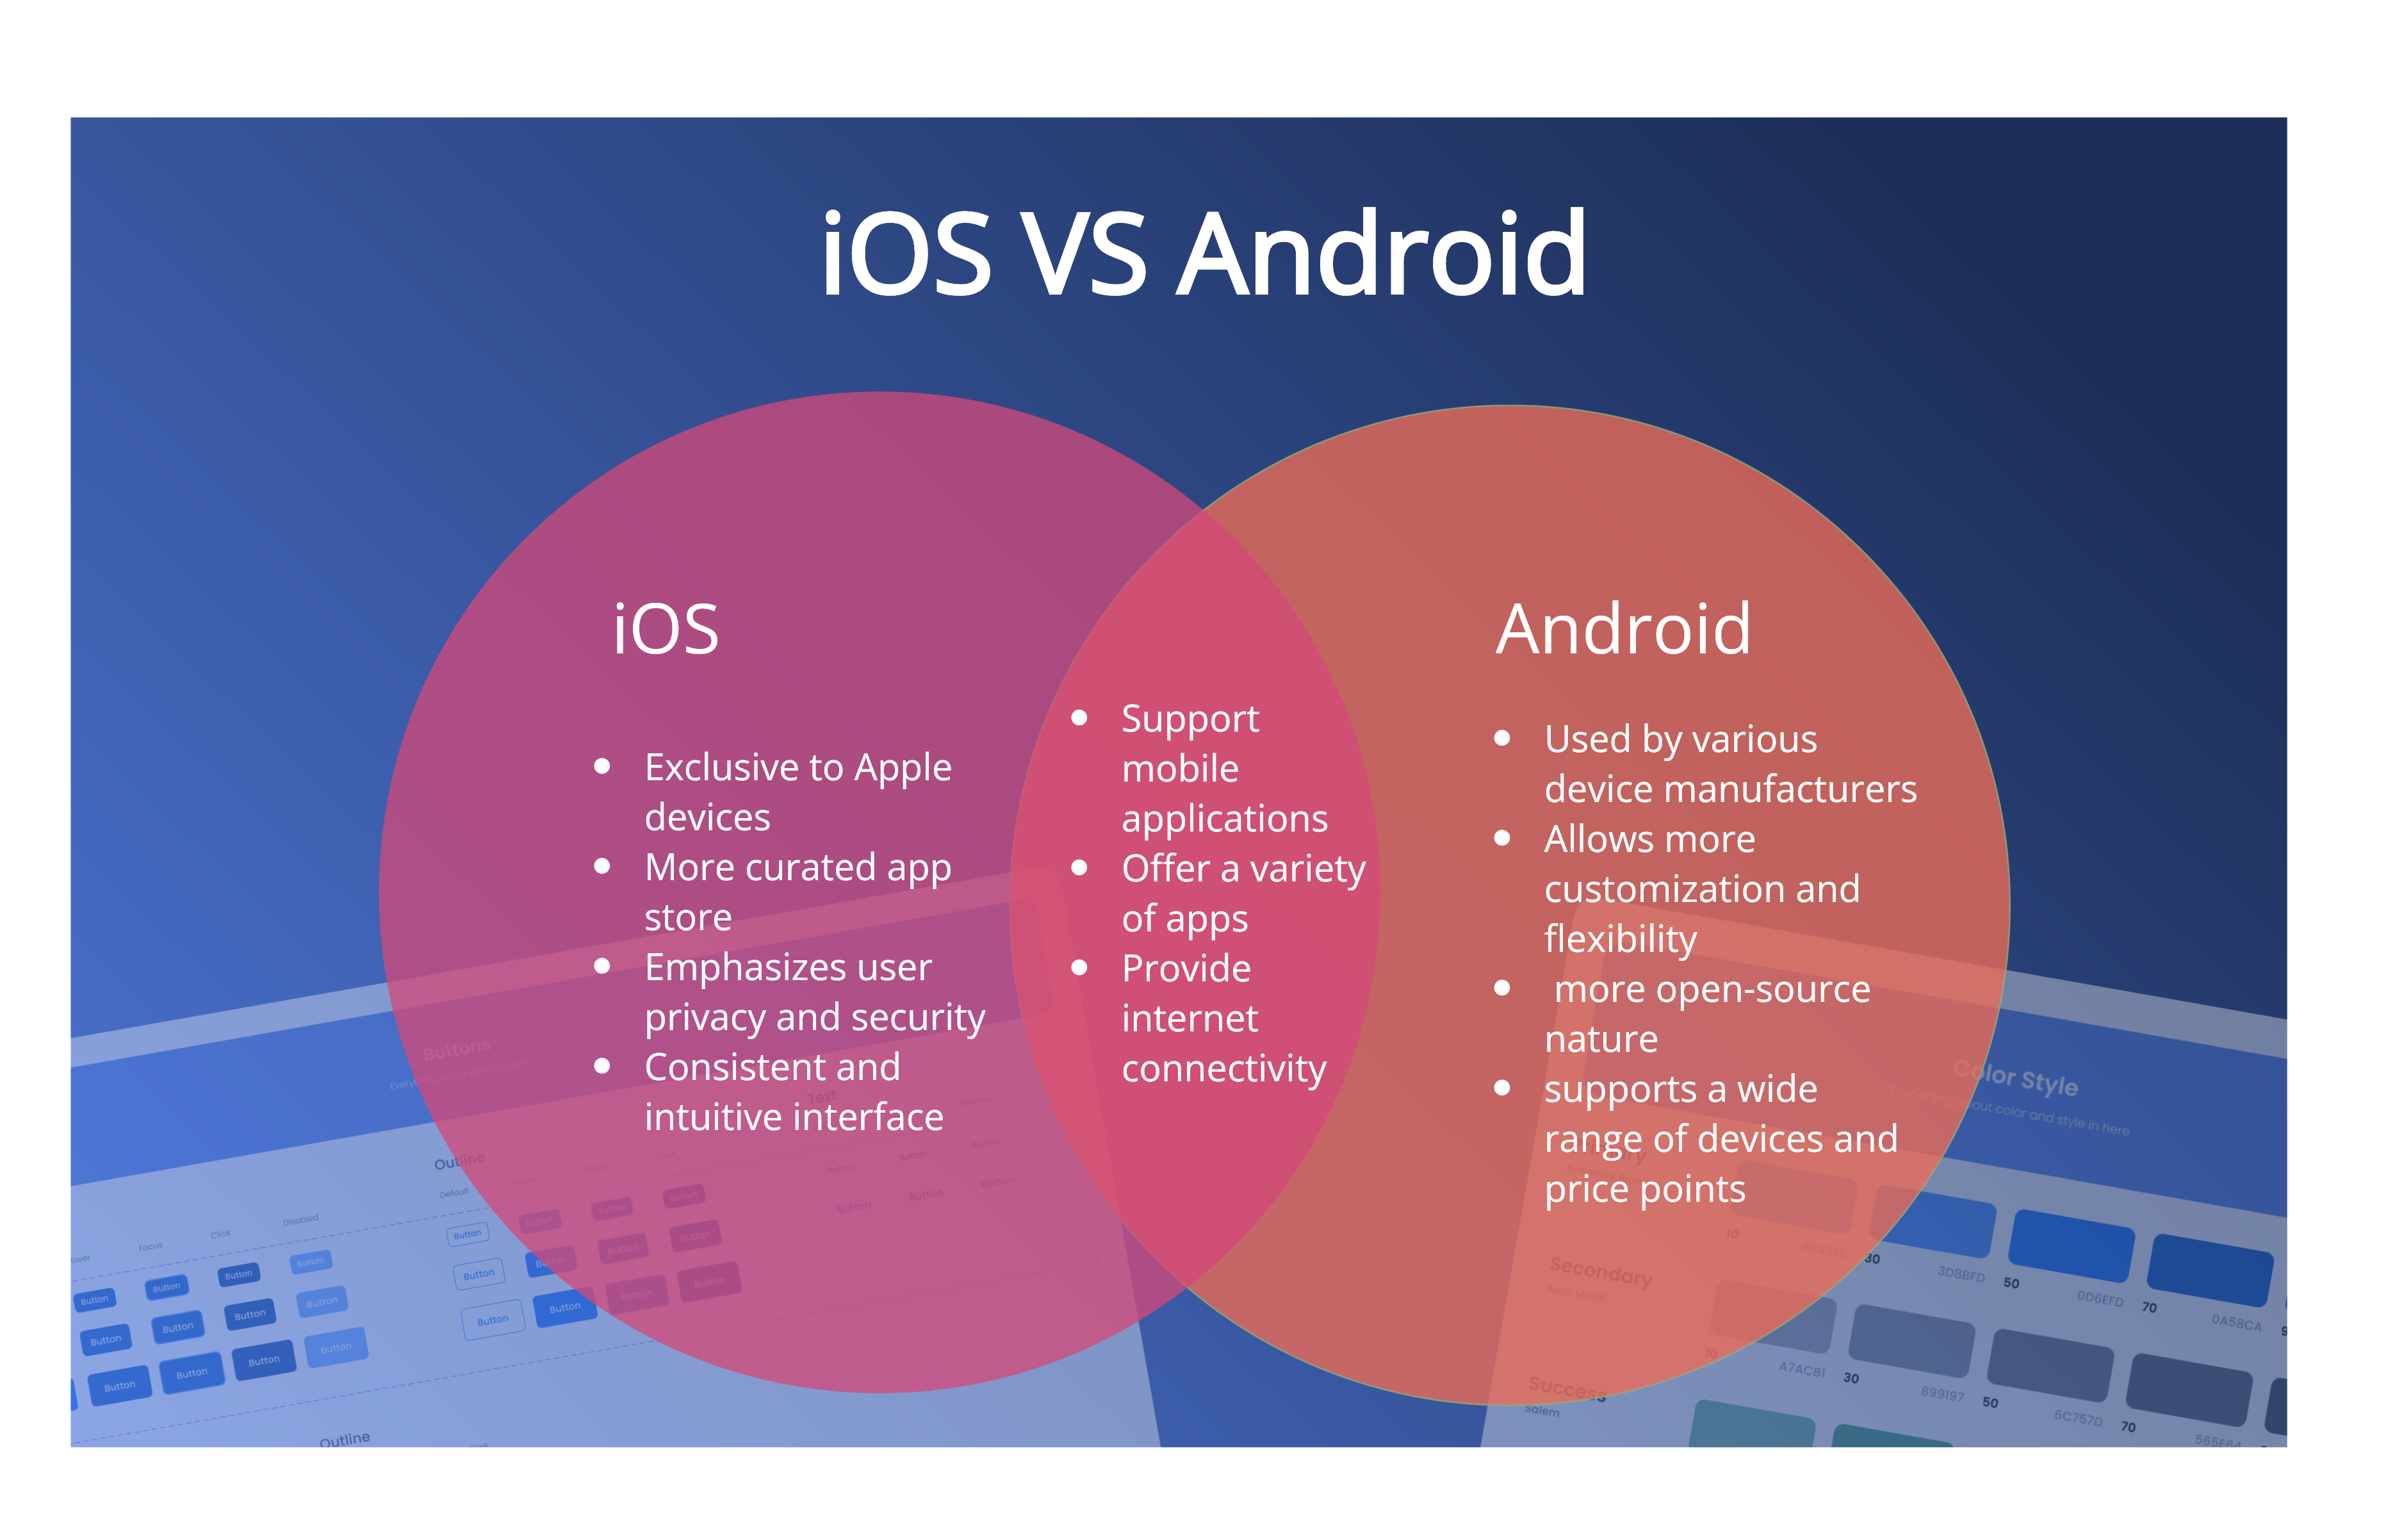
Example of Venn Diagram in Technoloy
In technology, a Venn diagram is a graphical representation that uses circles to illustrate the relationships and commonalities between different sets or categories. It visually demonstrates the overlap and distinctions among various elements, helping to analyze data, identify patterns, and showcase intersections between different technological components or concepts.
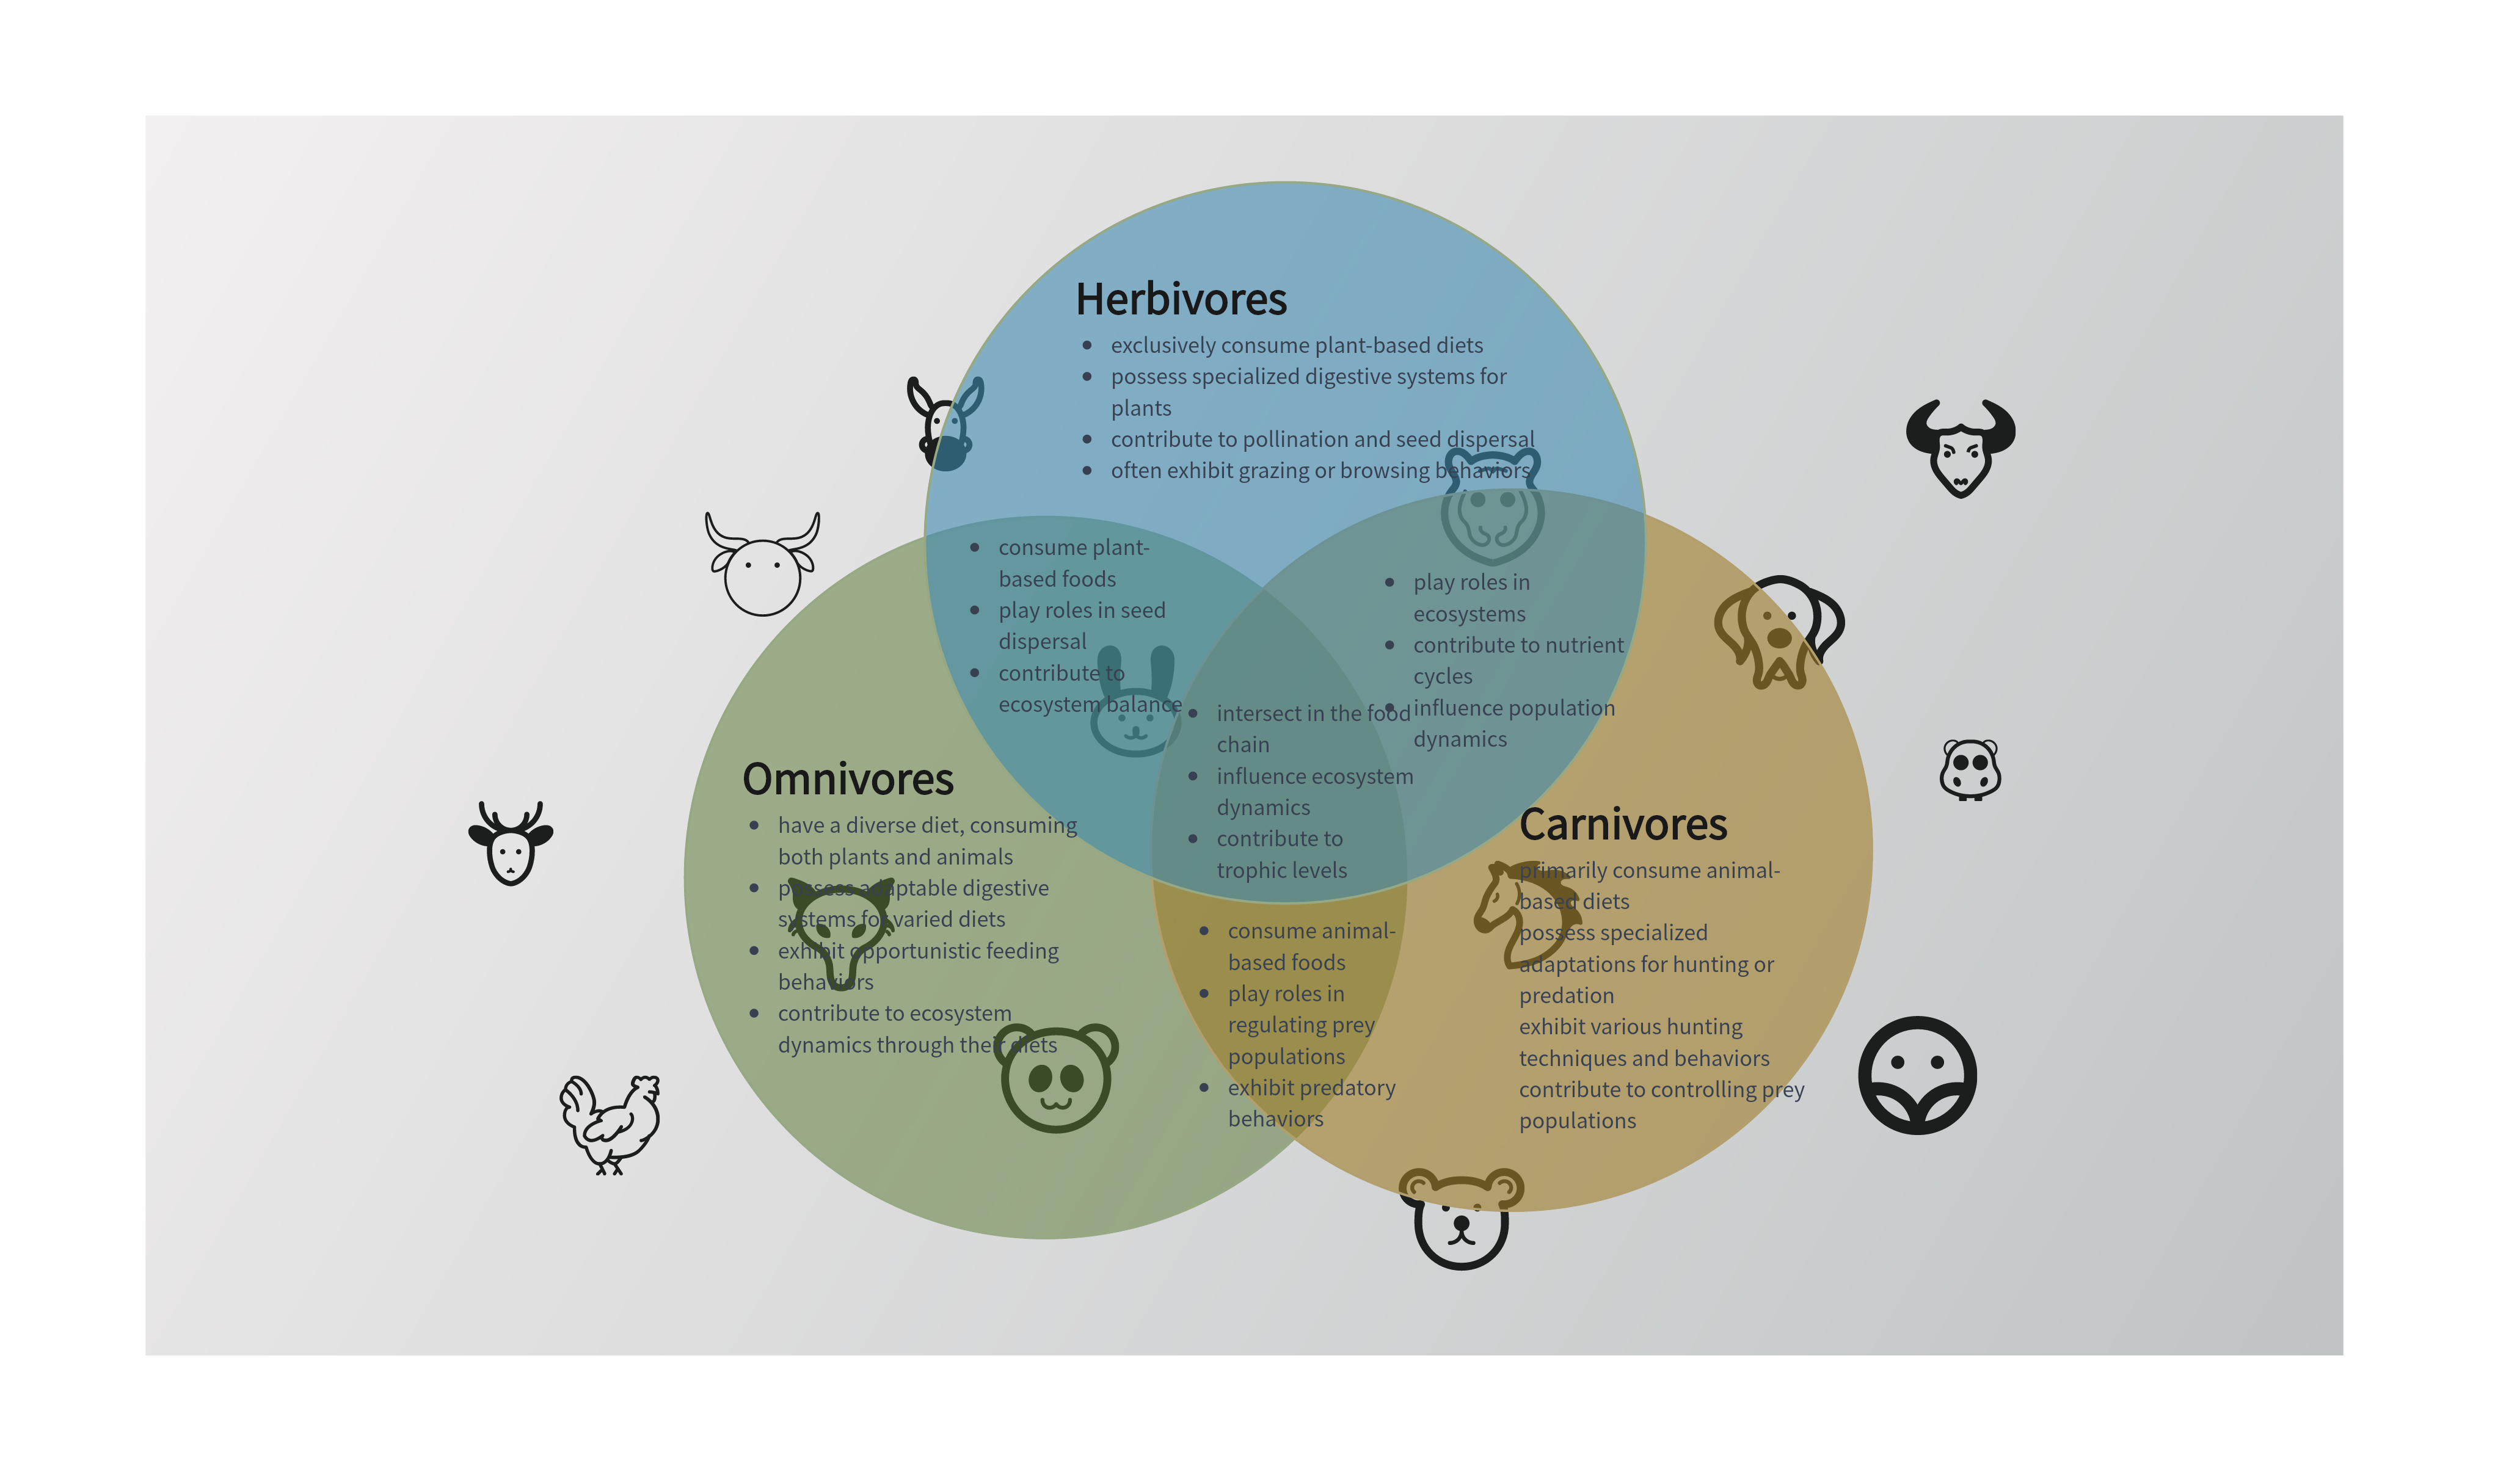
Example of Venn Diagram in Zoology
In zoology, a Venn diagram is a graphical representation that illustrates the relationships and commonalities between different sets of characteristics or traits within a specific context, such as biological classifications, animal characteristics, or ecological factors.
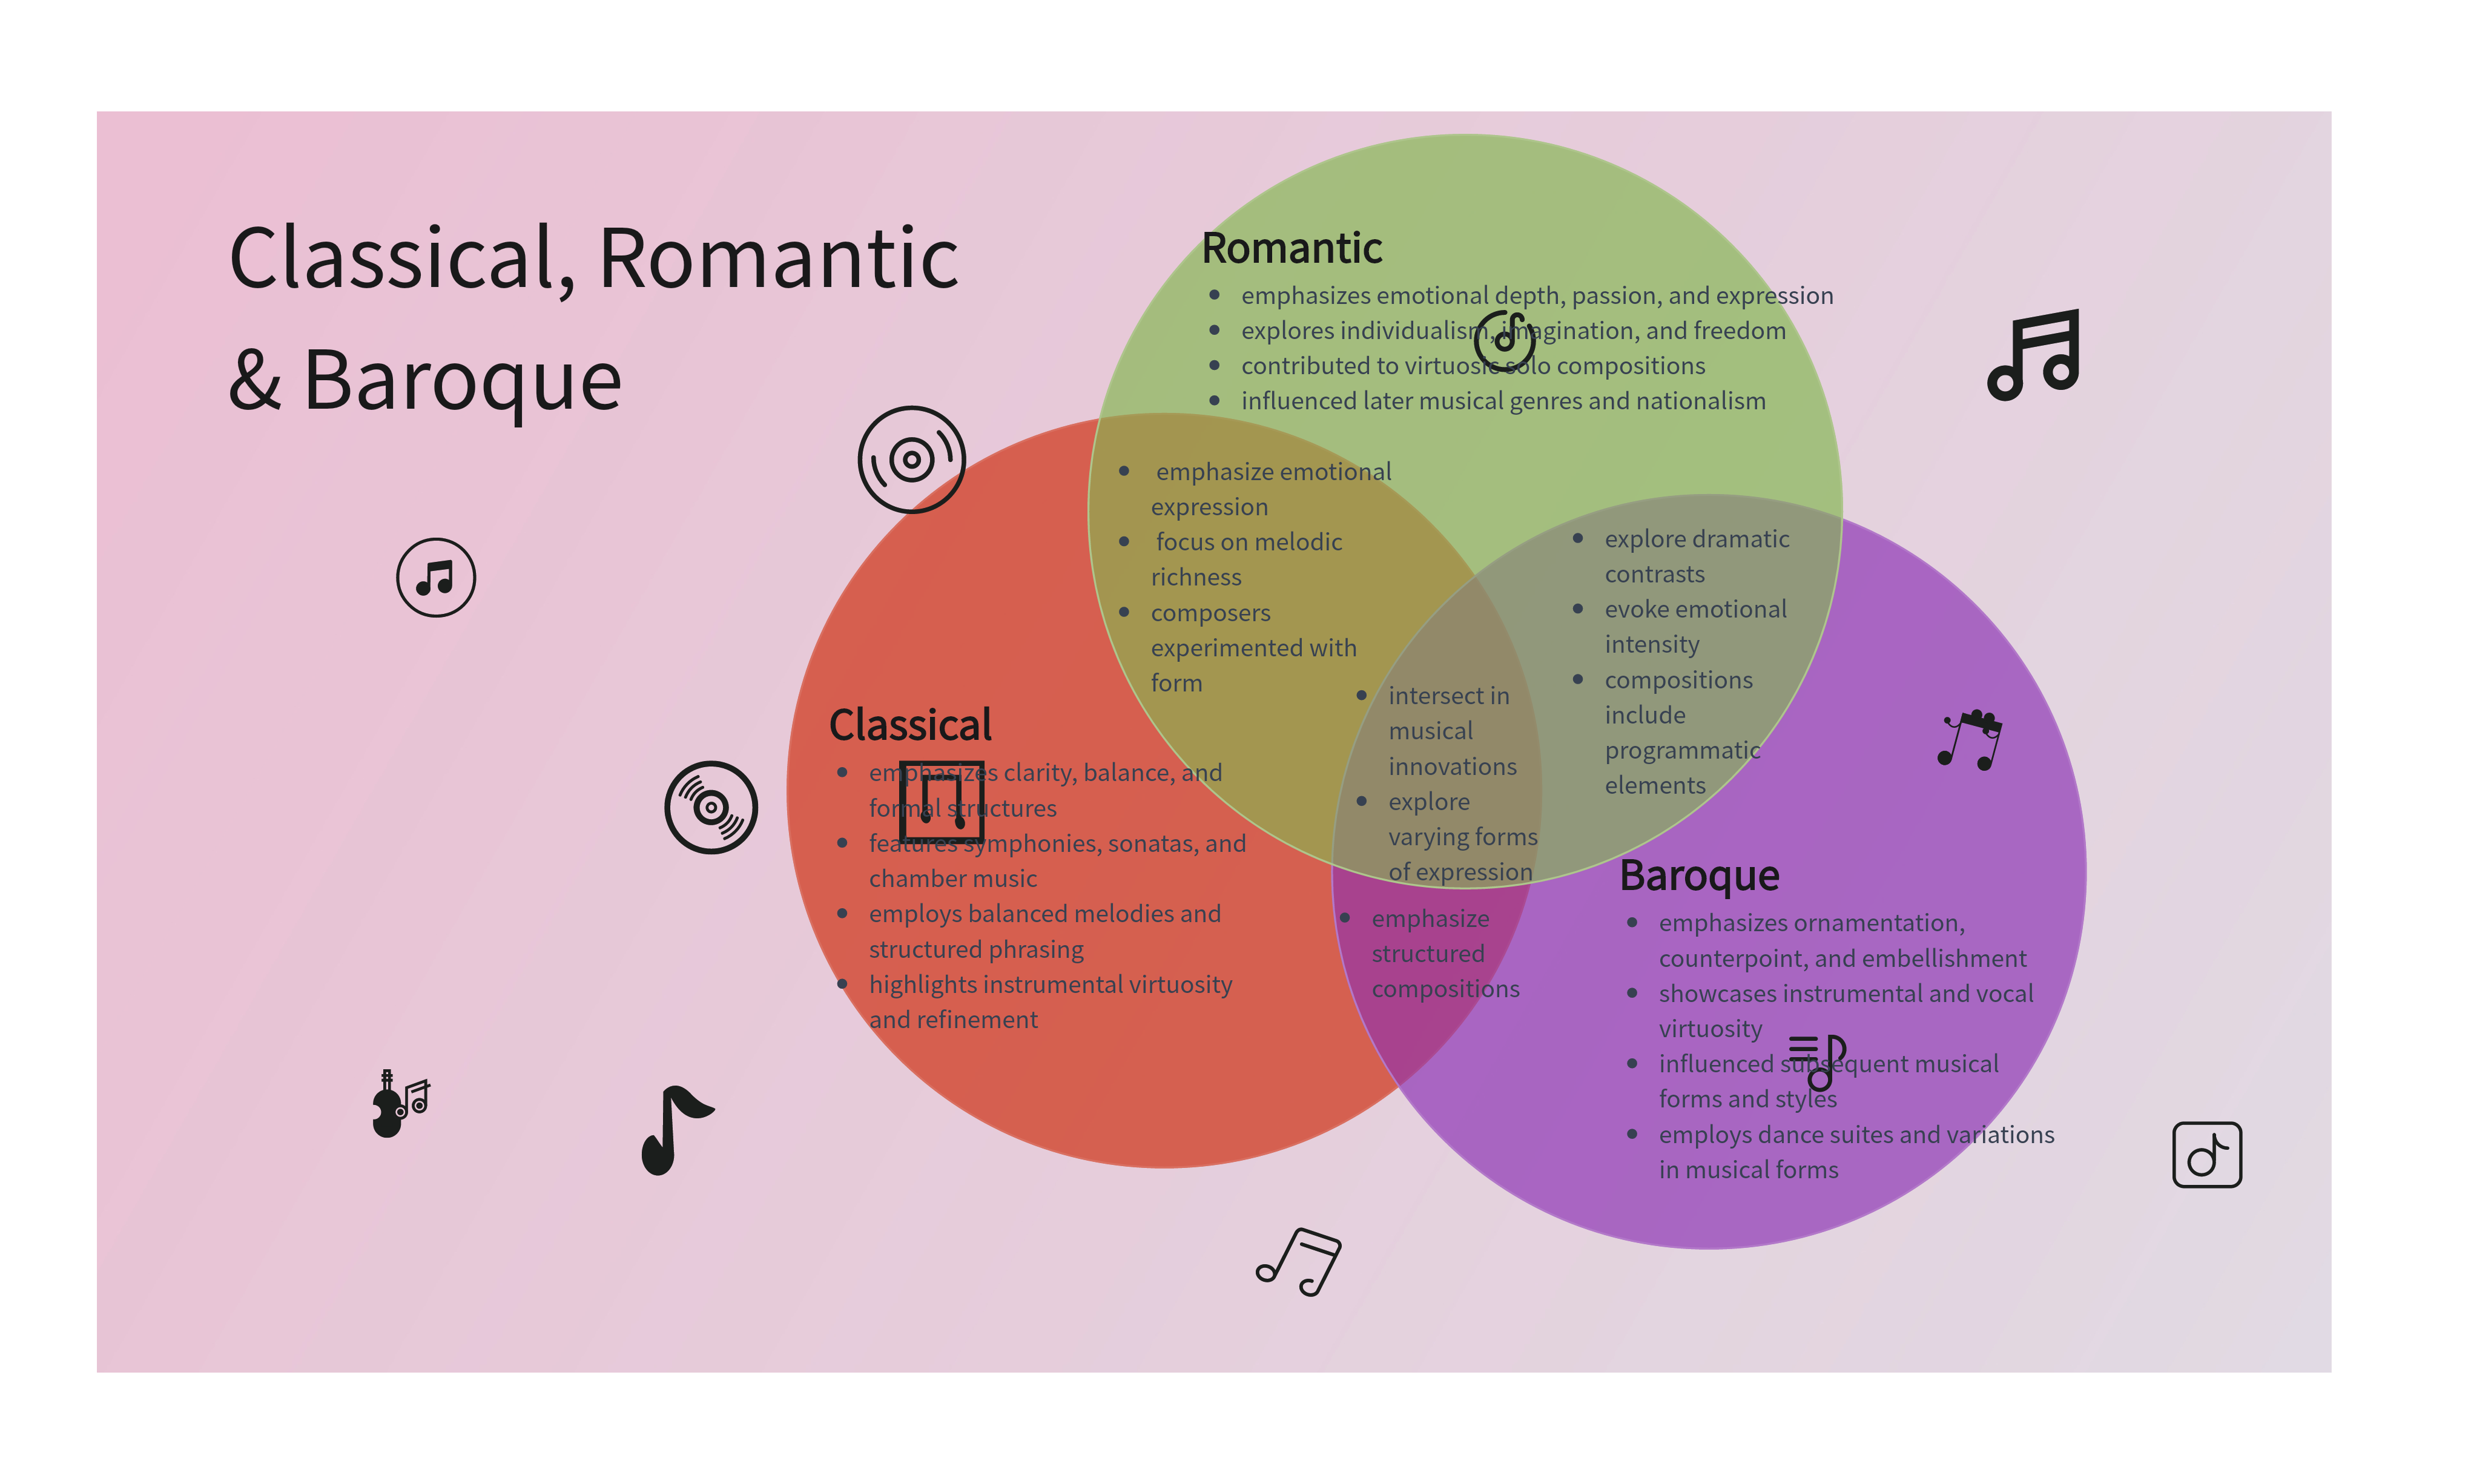
Example of Venn Diagram in Music (3-Circle)
In the context of music genres, a Venn diagram is a visual representation that illustrates the relationships between different musical genres. Each circle within the diagram represents a specific genre, and the overlapping areas between circles indicate where genres share common characteristics or influences.
Example of Venn Diagram in Feng Shui Theory
In Feng Shui theory, a Venn diagram is not a traditional or commonly discussed concept. Feng Shui primarily involves the arrangement and orientation of elements in a space to promote harmony, balance, and positive energy flow.
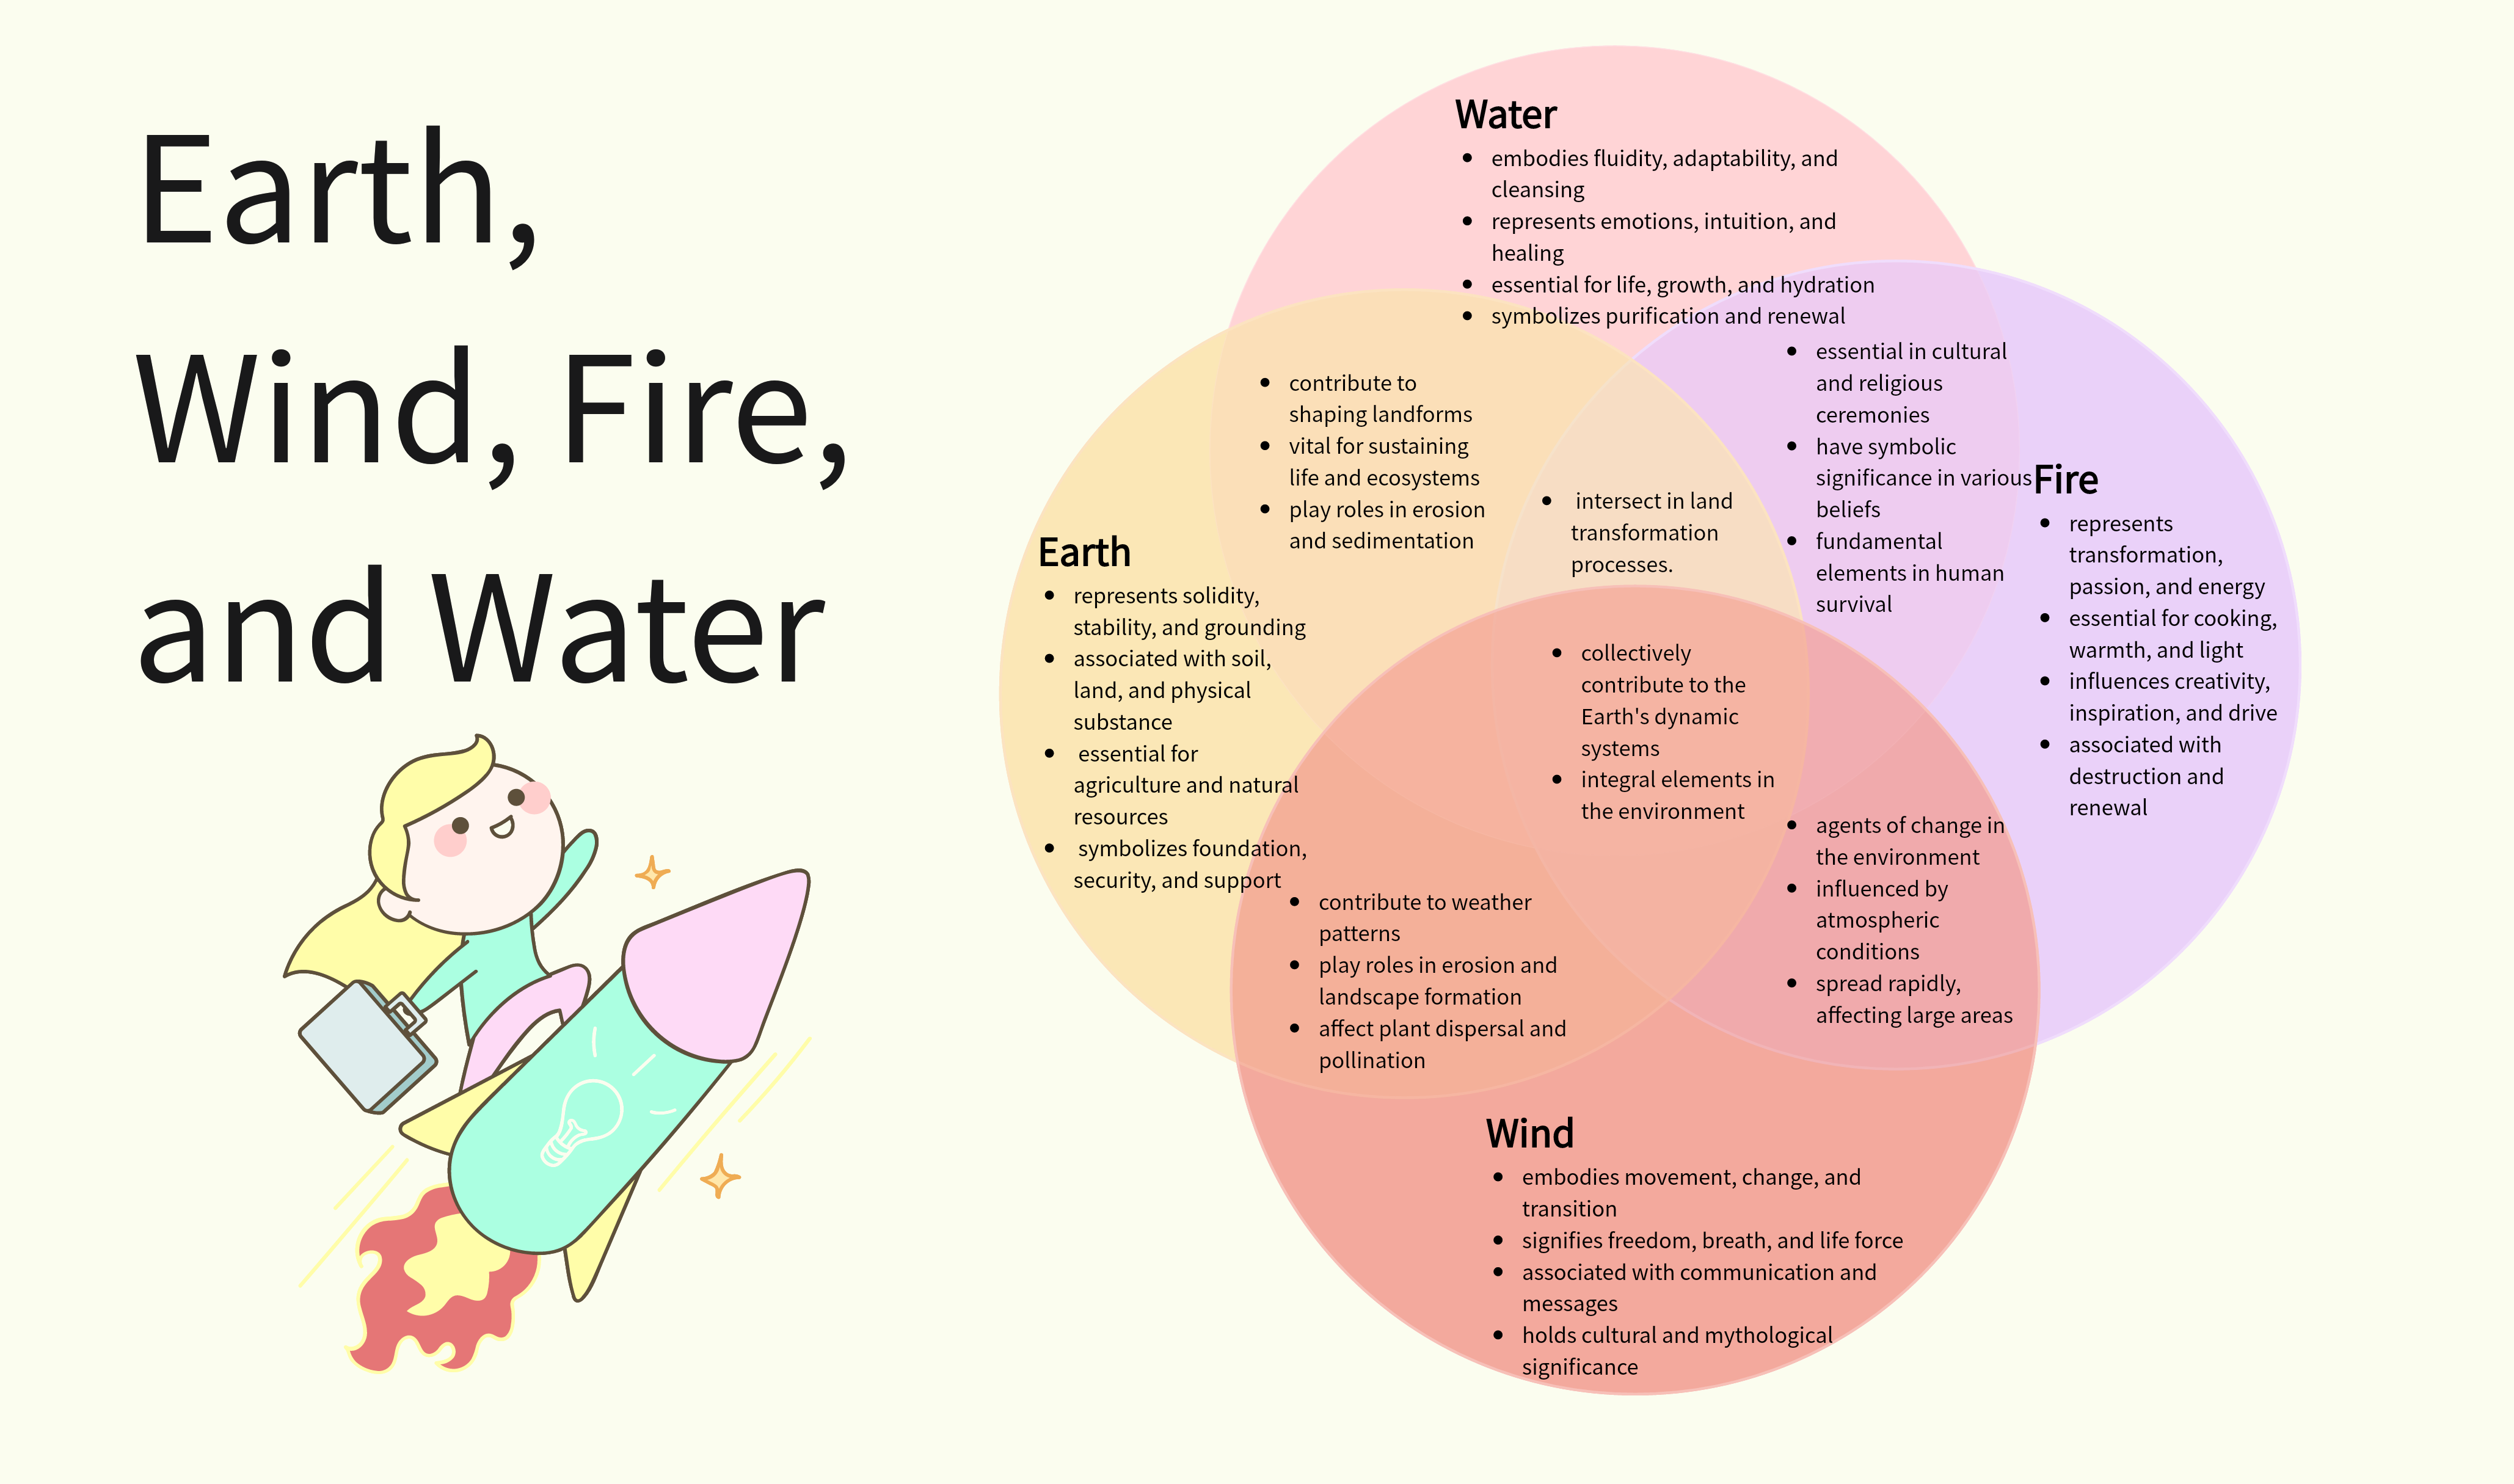
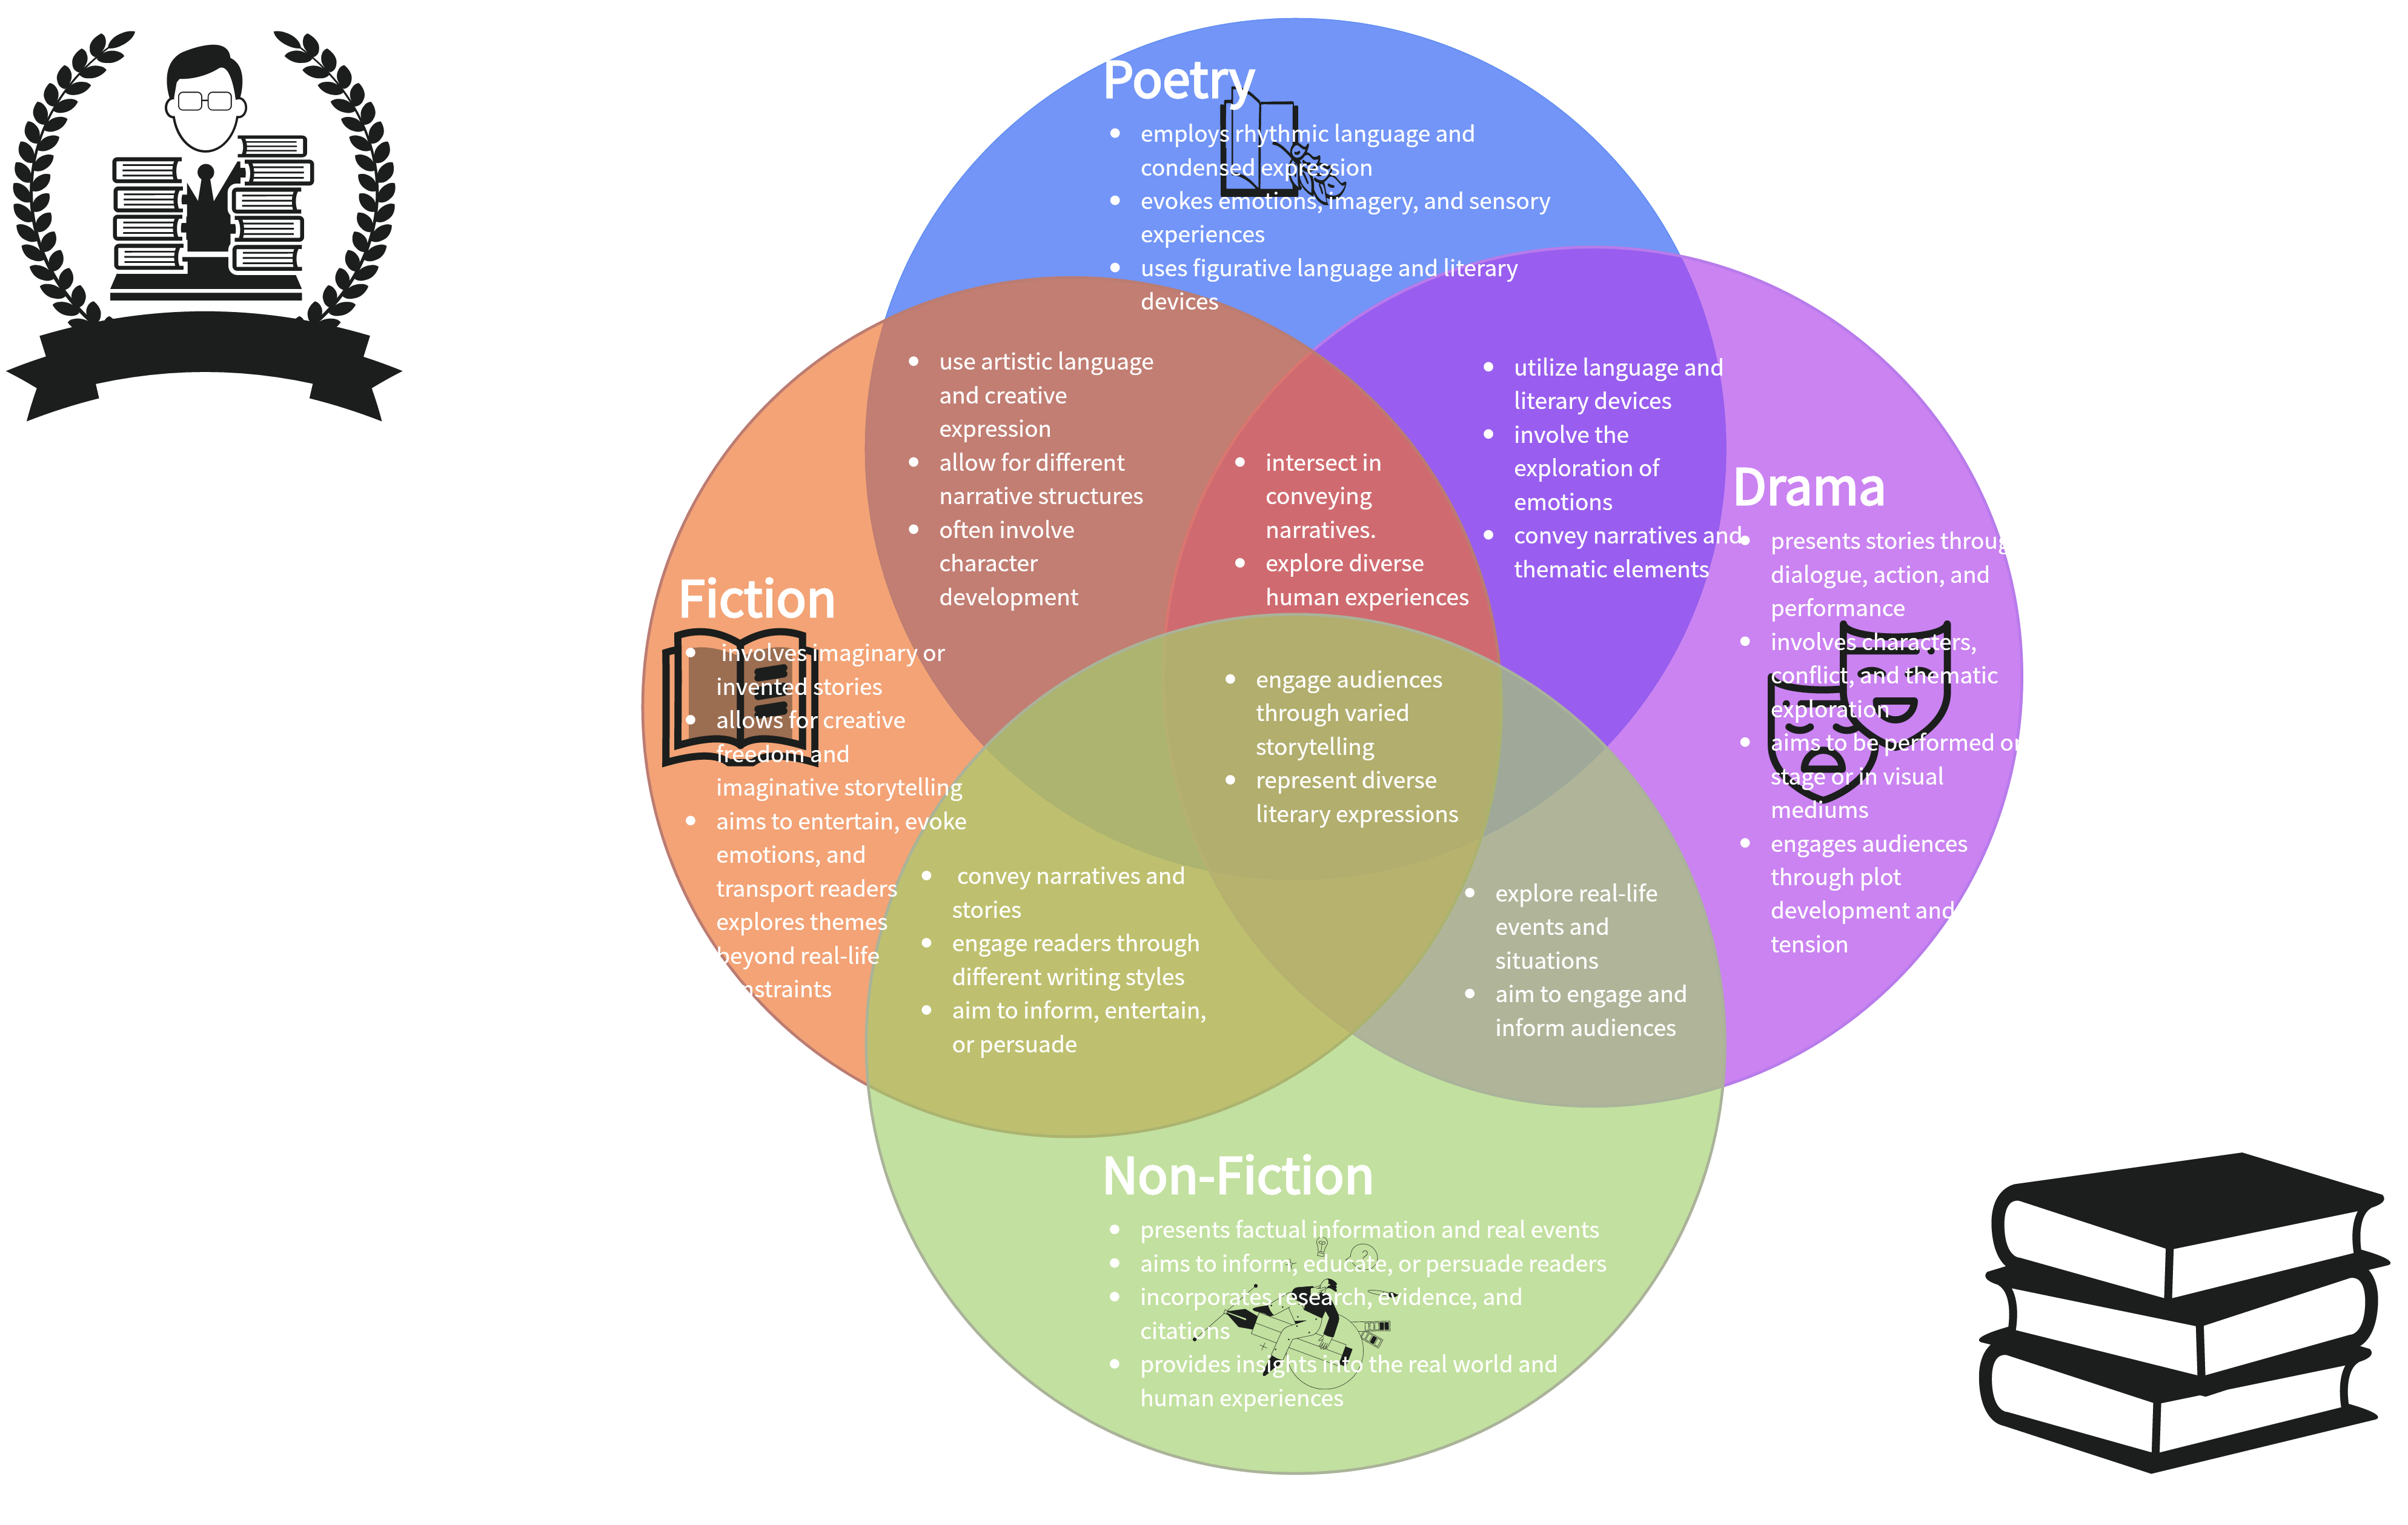
Example of Venn Diagram in Literature
A Venn diagram is a graphical representation that uses overlapping circles to illustrate the relationships or commonalities between different literary genres. Each circle represents a specific genre, and the overlapping areas highlight where genres share common characteristics or themes. This visual tool is employed in literary analysis to showcase the connections and distinctions among genres, aiding in the understanding of their shared elements or unique features.
How to Create Your Own Venn Diagram: A Step-by-step Guide
Boardmix offers a user-friendly platform that allows users to create custom diagrams, infographics, charts, and more. Its unique selling point lies in its simplicity, making it an ideal choice for beginners and professionals alike. The built-in Venn diagram template and rich shape resources are particularly useful, allowing users to visualize relationships between different sets or groups easily.
Here, we present a step-by-step guide on creating your own Venn diagram using Boardmix.
Step 1: Login or Register
Begin by accessing the Boardmix website and logging into your account. If you're a new user, sign up for a free account.

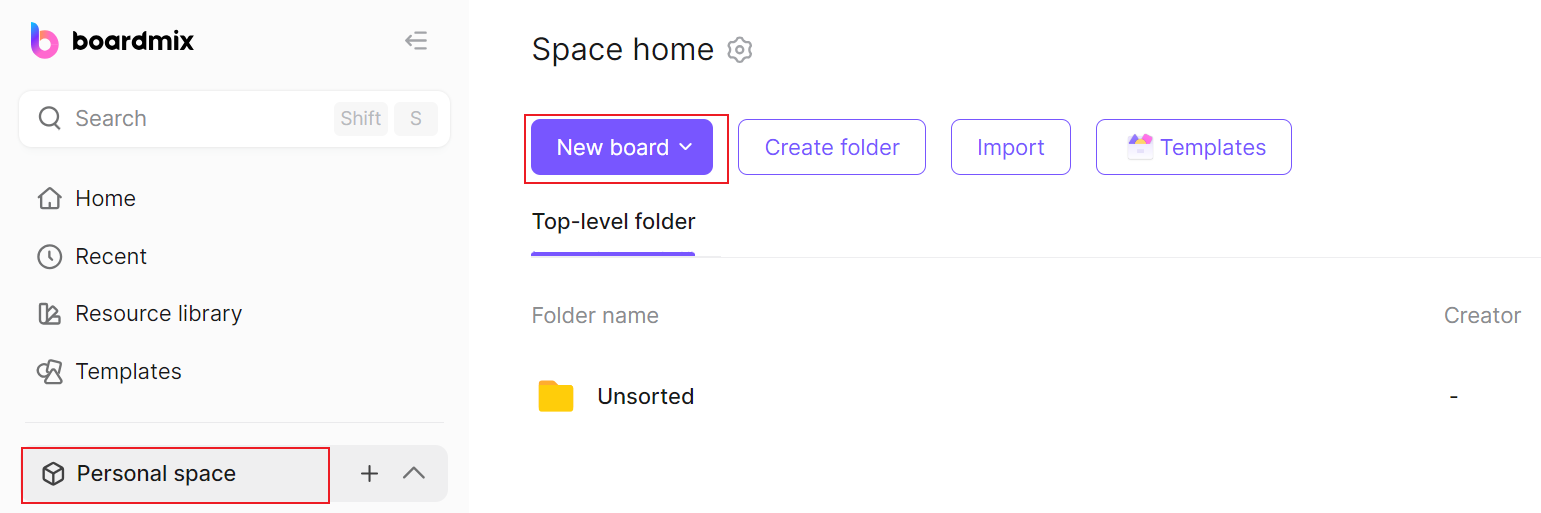
Step 2: Create a New Board
After logging in, click on "New board" button, then you’ll be directed to an editor with all tools you need.
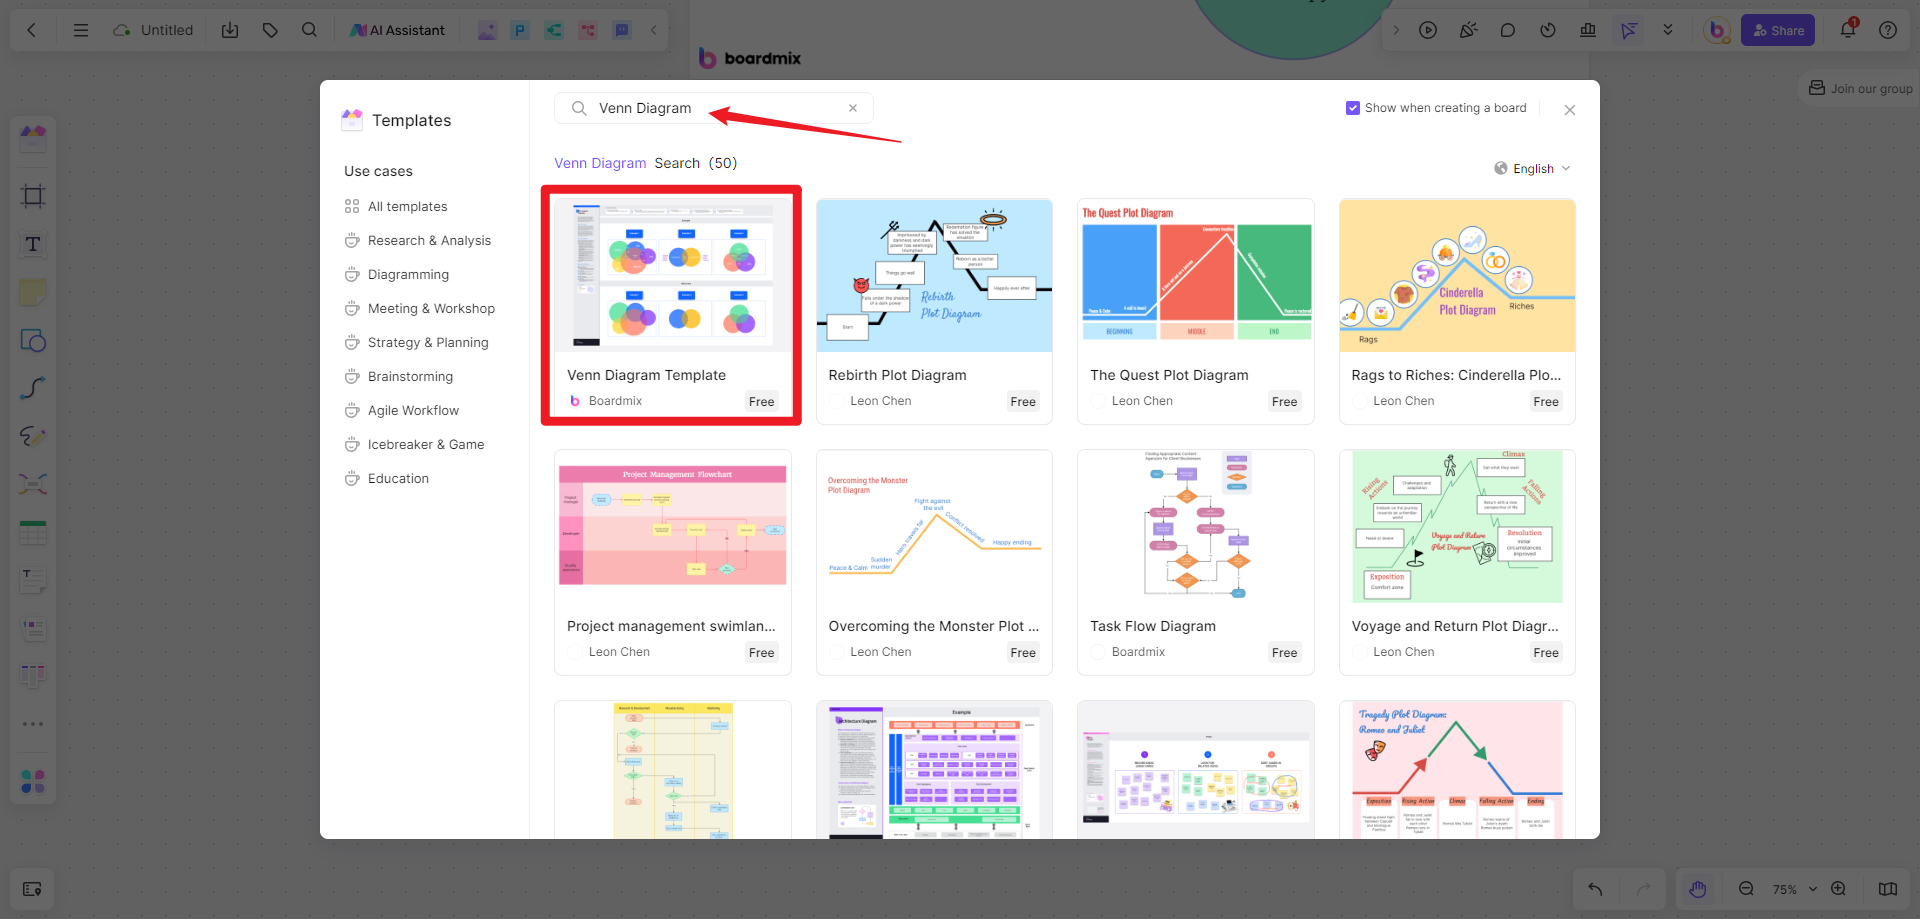
Step 3: Use the Venn Diagram Template
From the left panel, click “Template”, then search for the Venn diagram. Directly use the template after locating it, and you’ll have a preset framework.
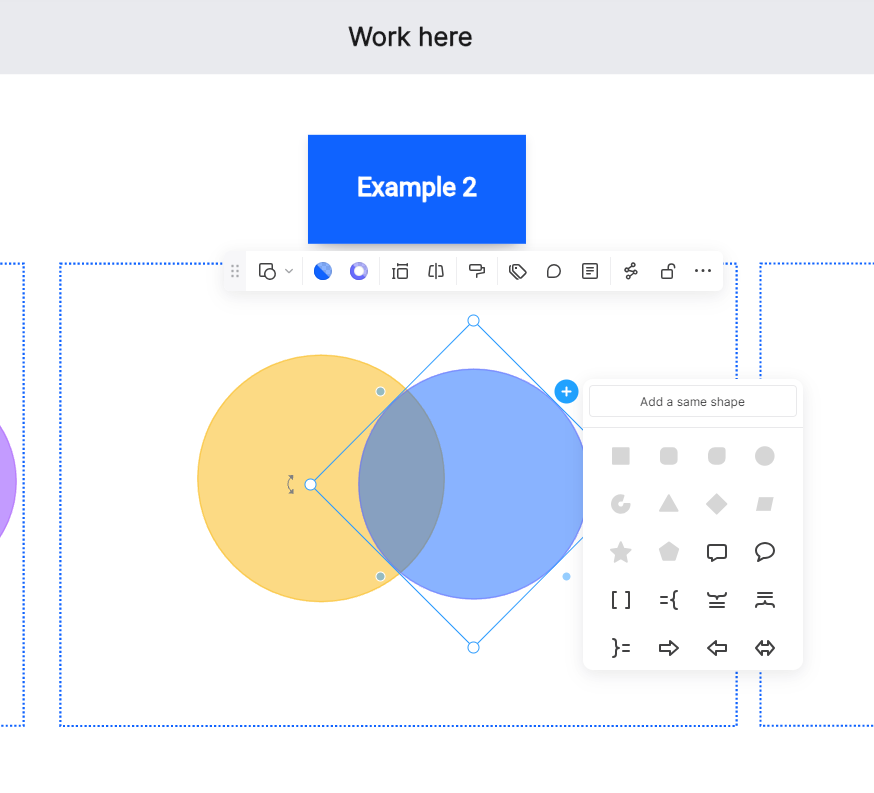
Step 4: Adjust Size and Position of Circles
By default, Boardmix provides two circles for a simple Venn diagram. Add more circles as needed by clicking on "Shapes". Customize the size of the circles by dragging their corners. Arrange them to represent the relationships among your sets.
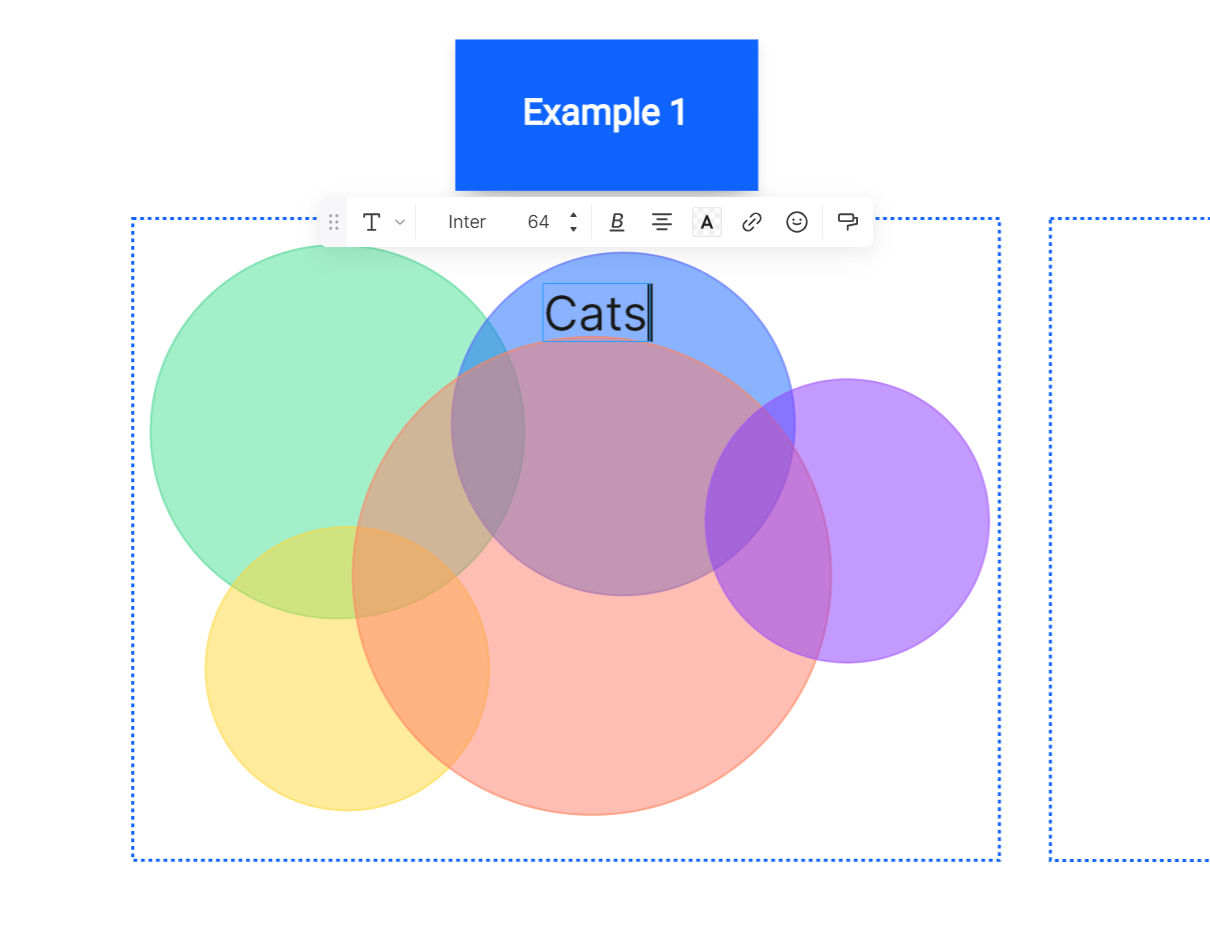
Step 5: Label Your Circles
Use the text tool to add labels to your circles. These labels should represent the different groups or sets in your diagram.
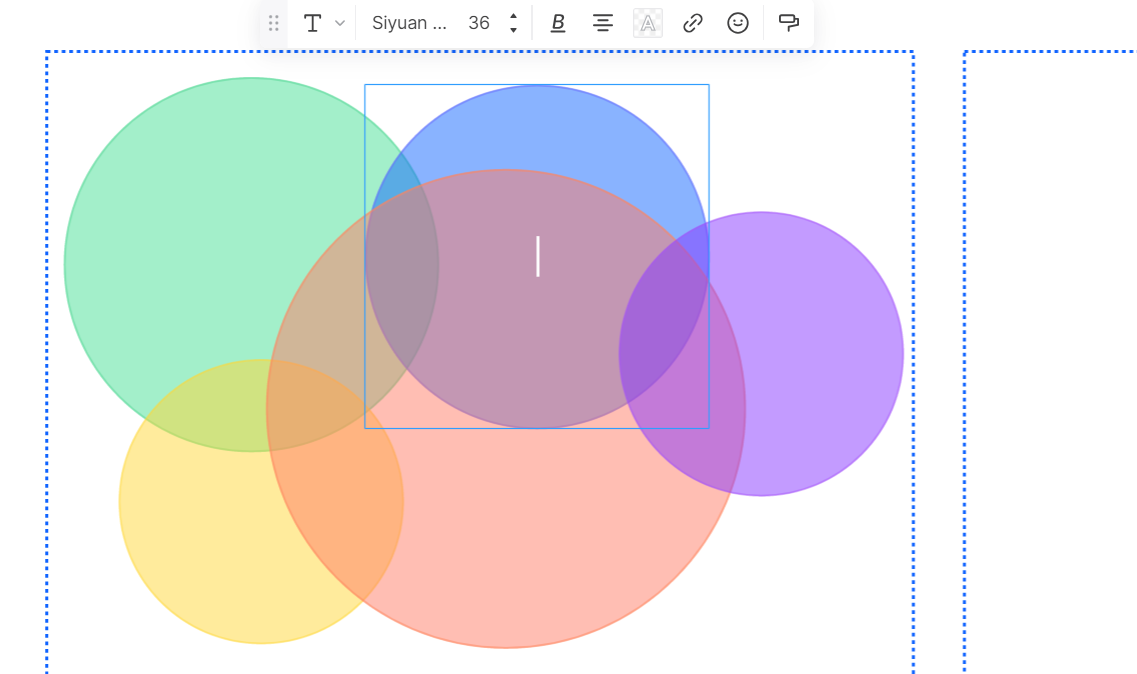
Step 6: Fill in Your Diagram
Click inside each section of your diagram to add values. You can also copy and paste data from other documents into the diagram.
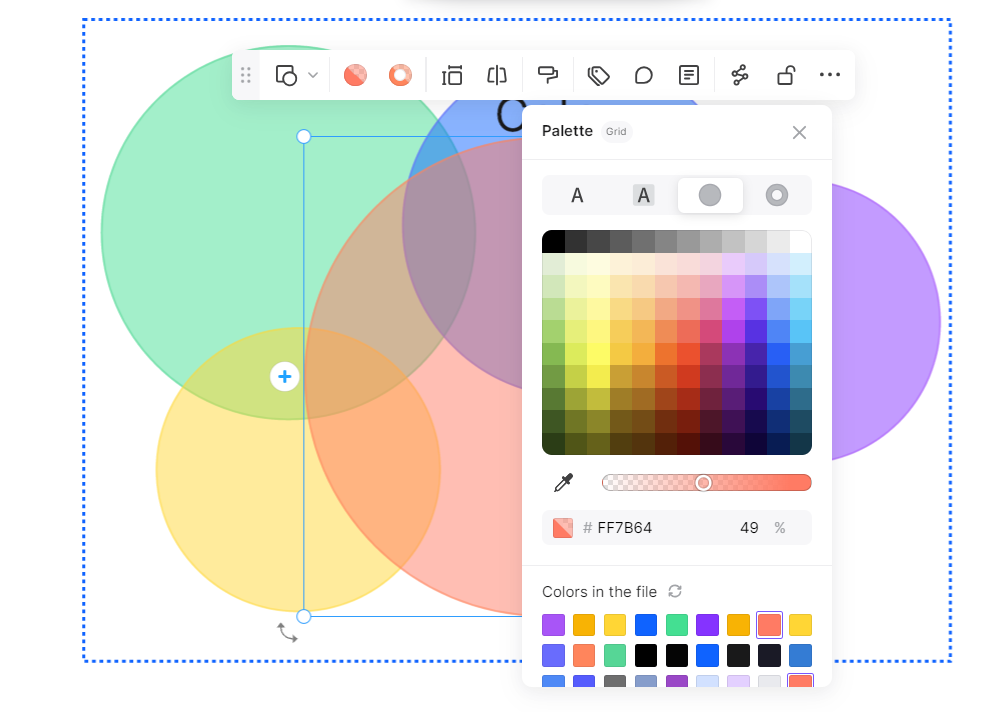
Step 7: Customize Your Diagram's Appearance
Boardmix allows you to customize the appearance of your diagram by changing color schemes, font styles, and sizes.
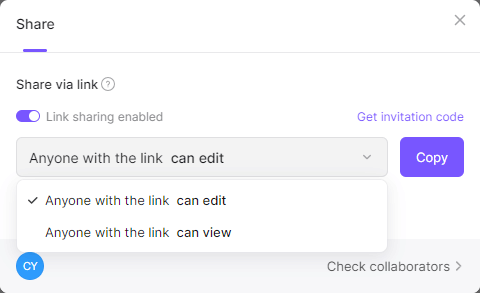
Step 8: Share and Export Your Diagram
Once you've finished your Venn diagram, share it with your teammates via a link or export it in a suitable format (PDF, PNG, JPEG) for printing.
By following these simple steps, anyone can create a professional-looking Venn diagram using Boardmix's intuitive platform. Is it easy-peasy? Go ahead and give Boardmix a try!


