A flowchart is a graphical representation that illustrates the steps, sequences, and decisions of a process or workflow. By utilizing a variety of shapes, symbols, and connecting lines, it facilitates the visualization of intricate processes and makes explicit the structure of problems and tasks.
Nowadays, flowcharts play an extremely important role in breaking down information and assisting reasoning. This common process analysis tool has extended beyond computer science and found extensive application in multiple fields, facilitating the comprehension, analysis, and communication of complex systems and tasks.
30+ Flowchart Examples for Beginners
1. Simple Decision-Making Process Flowchart
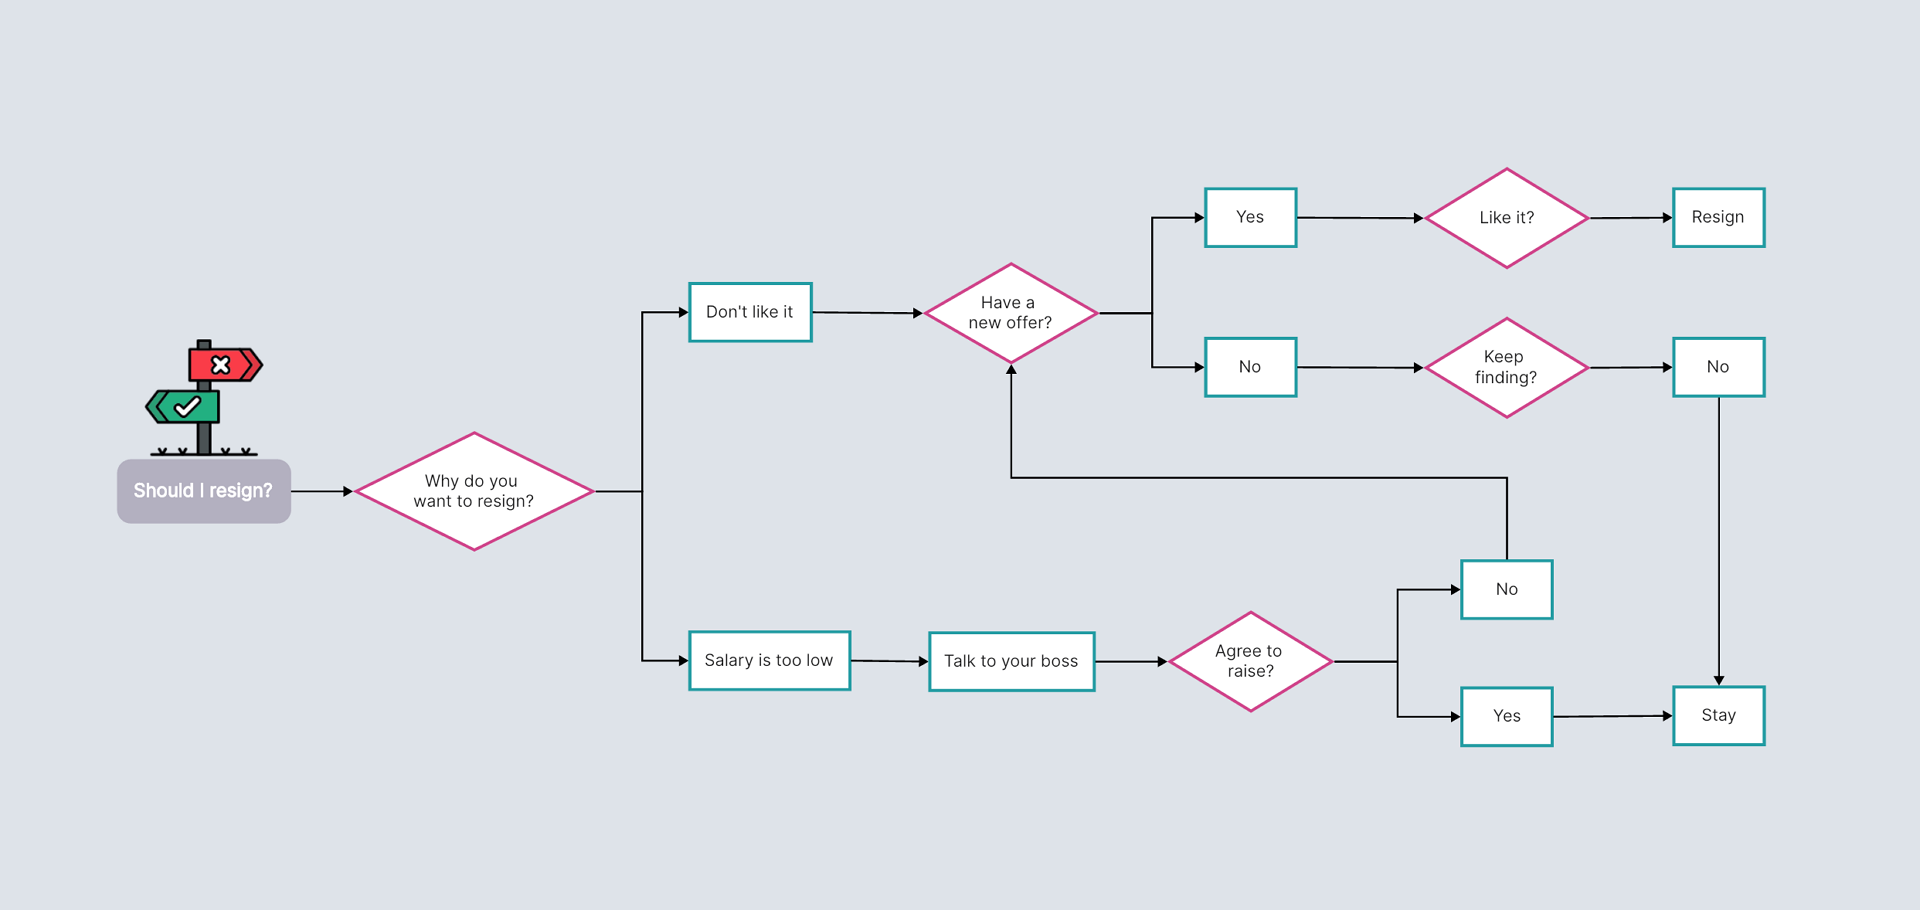
Flowcharts are powerful tools for those hard-to-make decisions. By mapping out potential consequences and scenarios, they enable the visualization of various outcomes for any situation, thereby aiding in reducing ambiguity, spotting improper choices, and making the most appropriate decision. Below is a decision-making flowchart example for reference.
2. Problem-Solving Flowchart
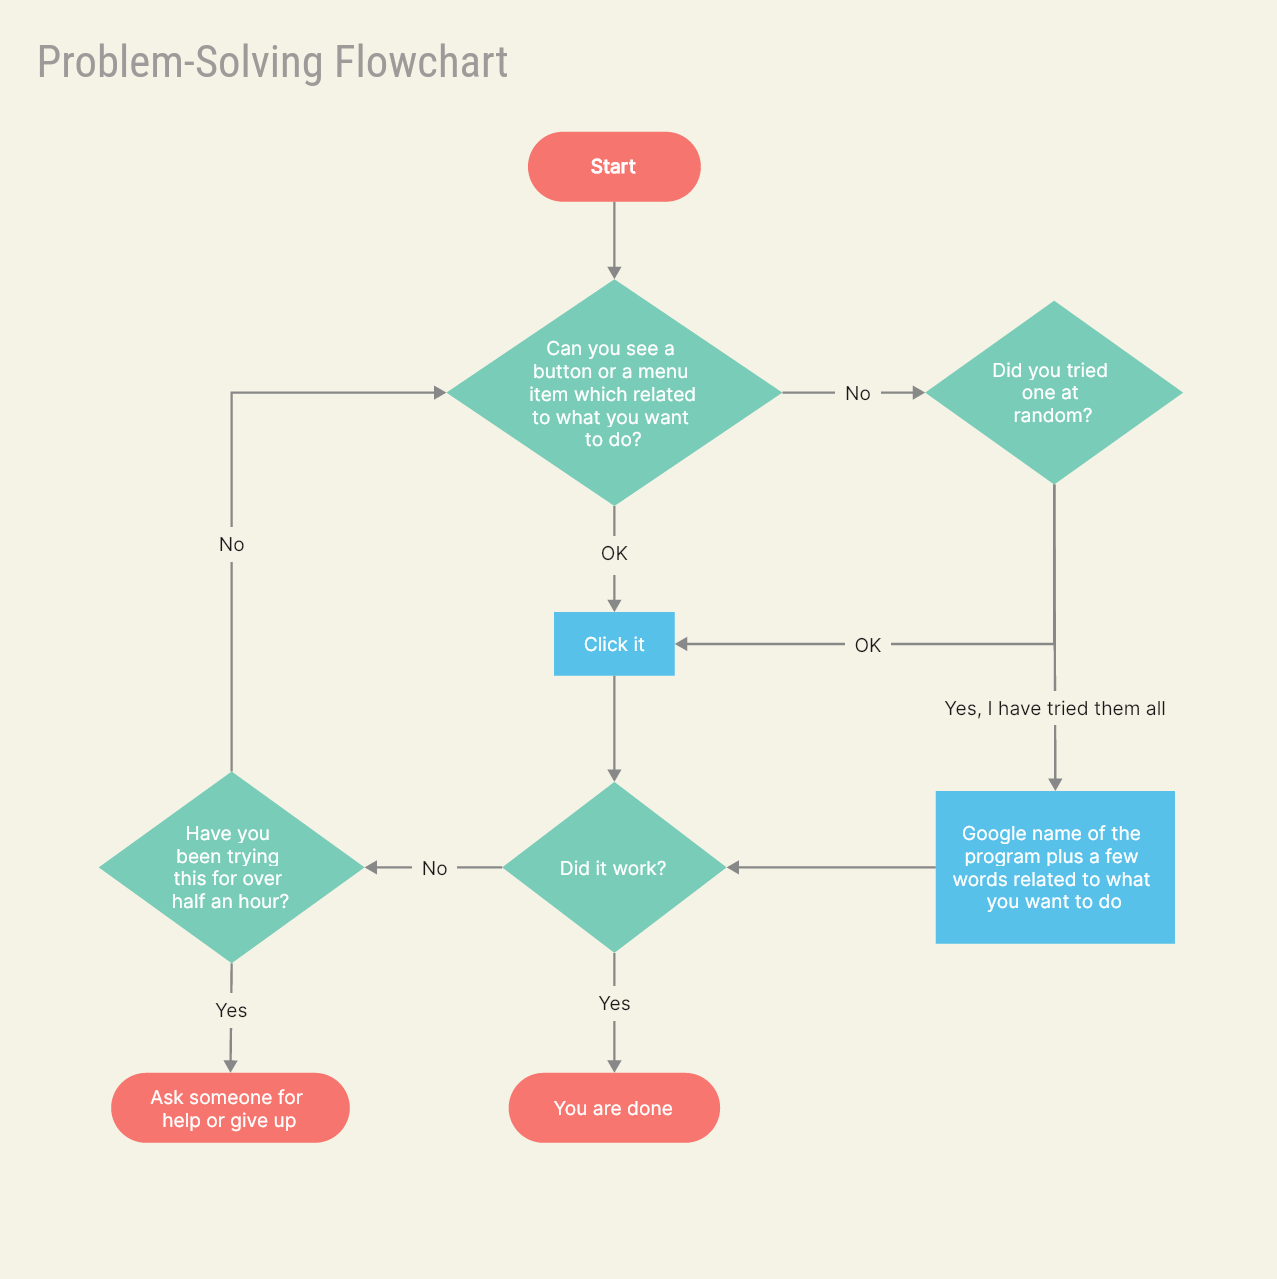
A flowchart can be a useful tool in problem-solving, as it breaks down the procedure into clear and logical steps, making it easier to understand and follow. It can be employed in various settings, including the customer support, where the primary responsibility is to resolve customers’ issues. If you are having trouble in understanding a customer’s problem, a flowchart is an excellent choice to analyze the issue and arrive at a solution.
3. Online Sales Procedure
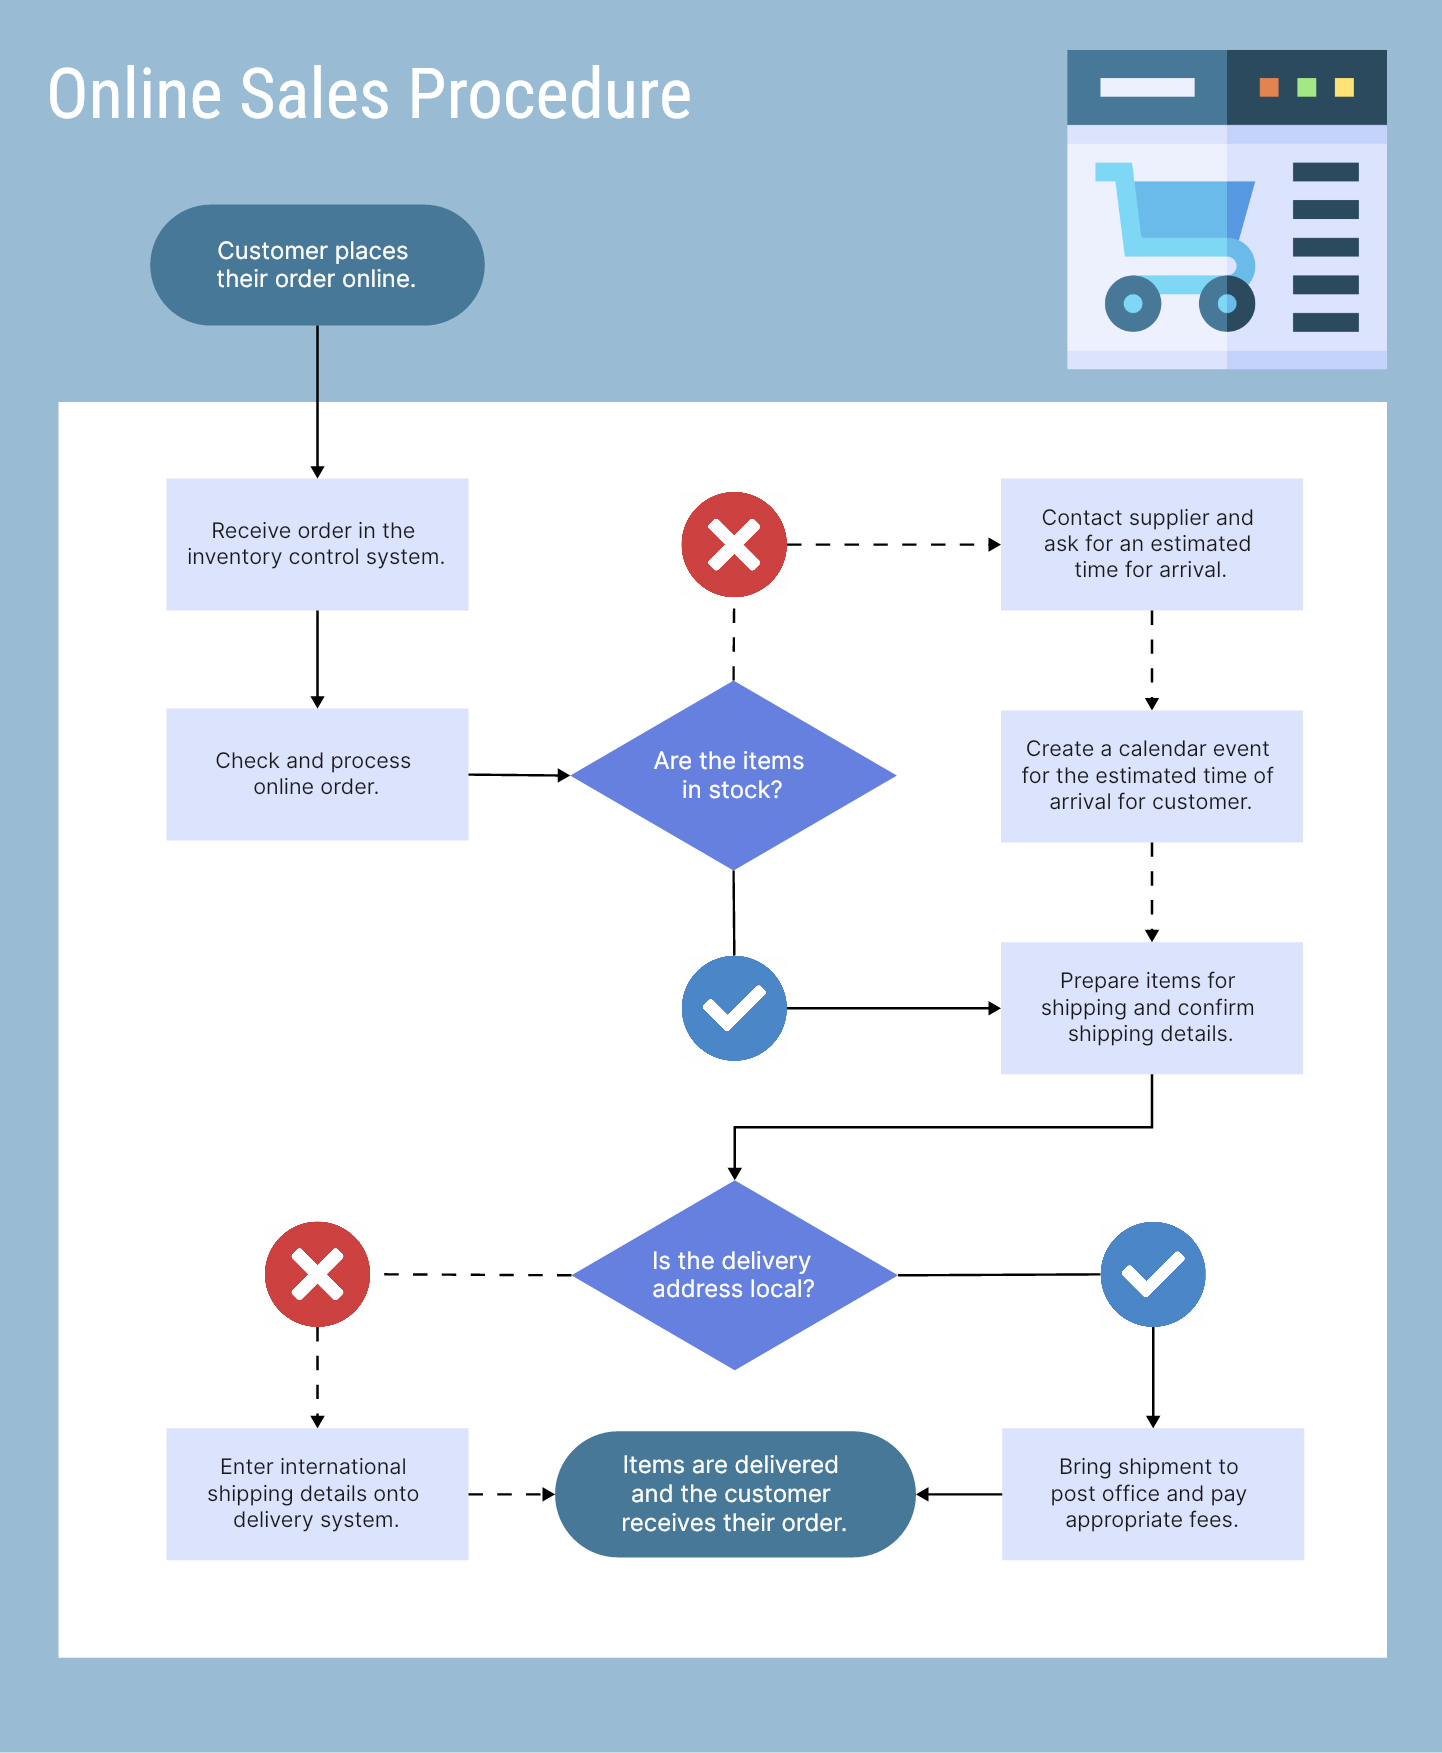
Flowcharts are widely adopted in the business field, offering an excellent means to communicate internal processes, hiring procedures, and project workflows. They can be effectively used to outline a variety of processes, including budgeting, planning, communication, and sales. For instance, the flowchart below visualizes the online sales procedure of a business.
4. Algorithm Flowchart
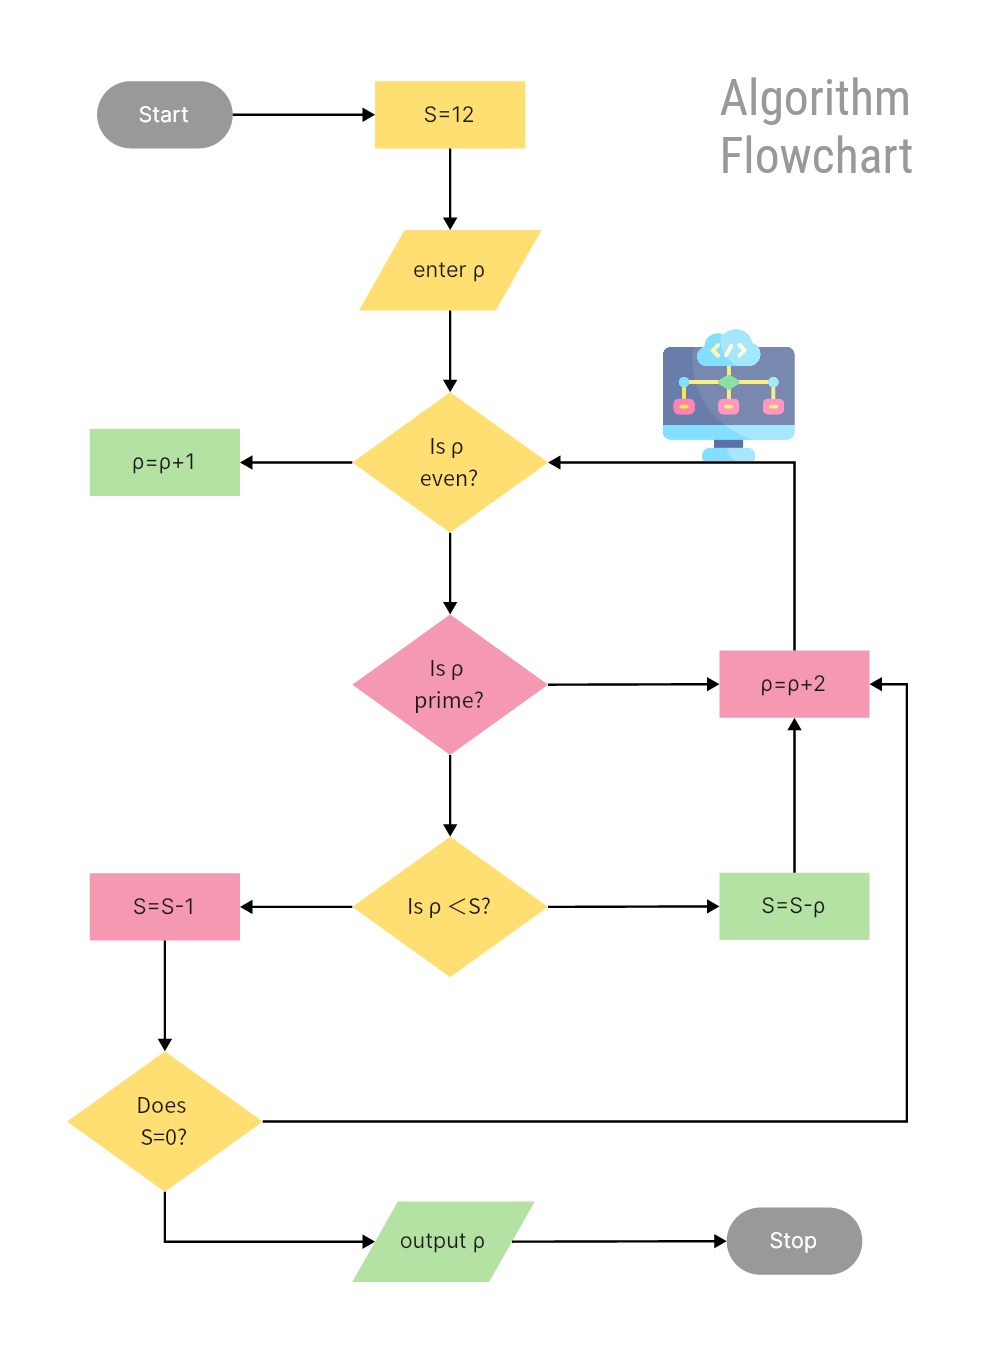
Flowcharts can effectively break down and present various algorithms, making them easier to digest and understand. Algorithms flowcharts play a crucial role in the field of computer science and programming, as they help in understanding, designing, and debugging algorithms. They are also used in educational settings to teach algorithmic concepts and problem-solving techniques. Therefore, educators and students can use them in the classroom, while IT professionals and engineers can employ them to map out computer algorithms and share their insights with non-technical audiences.
5. Customer Service Flowchart
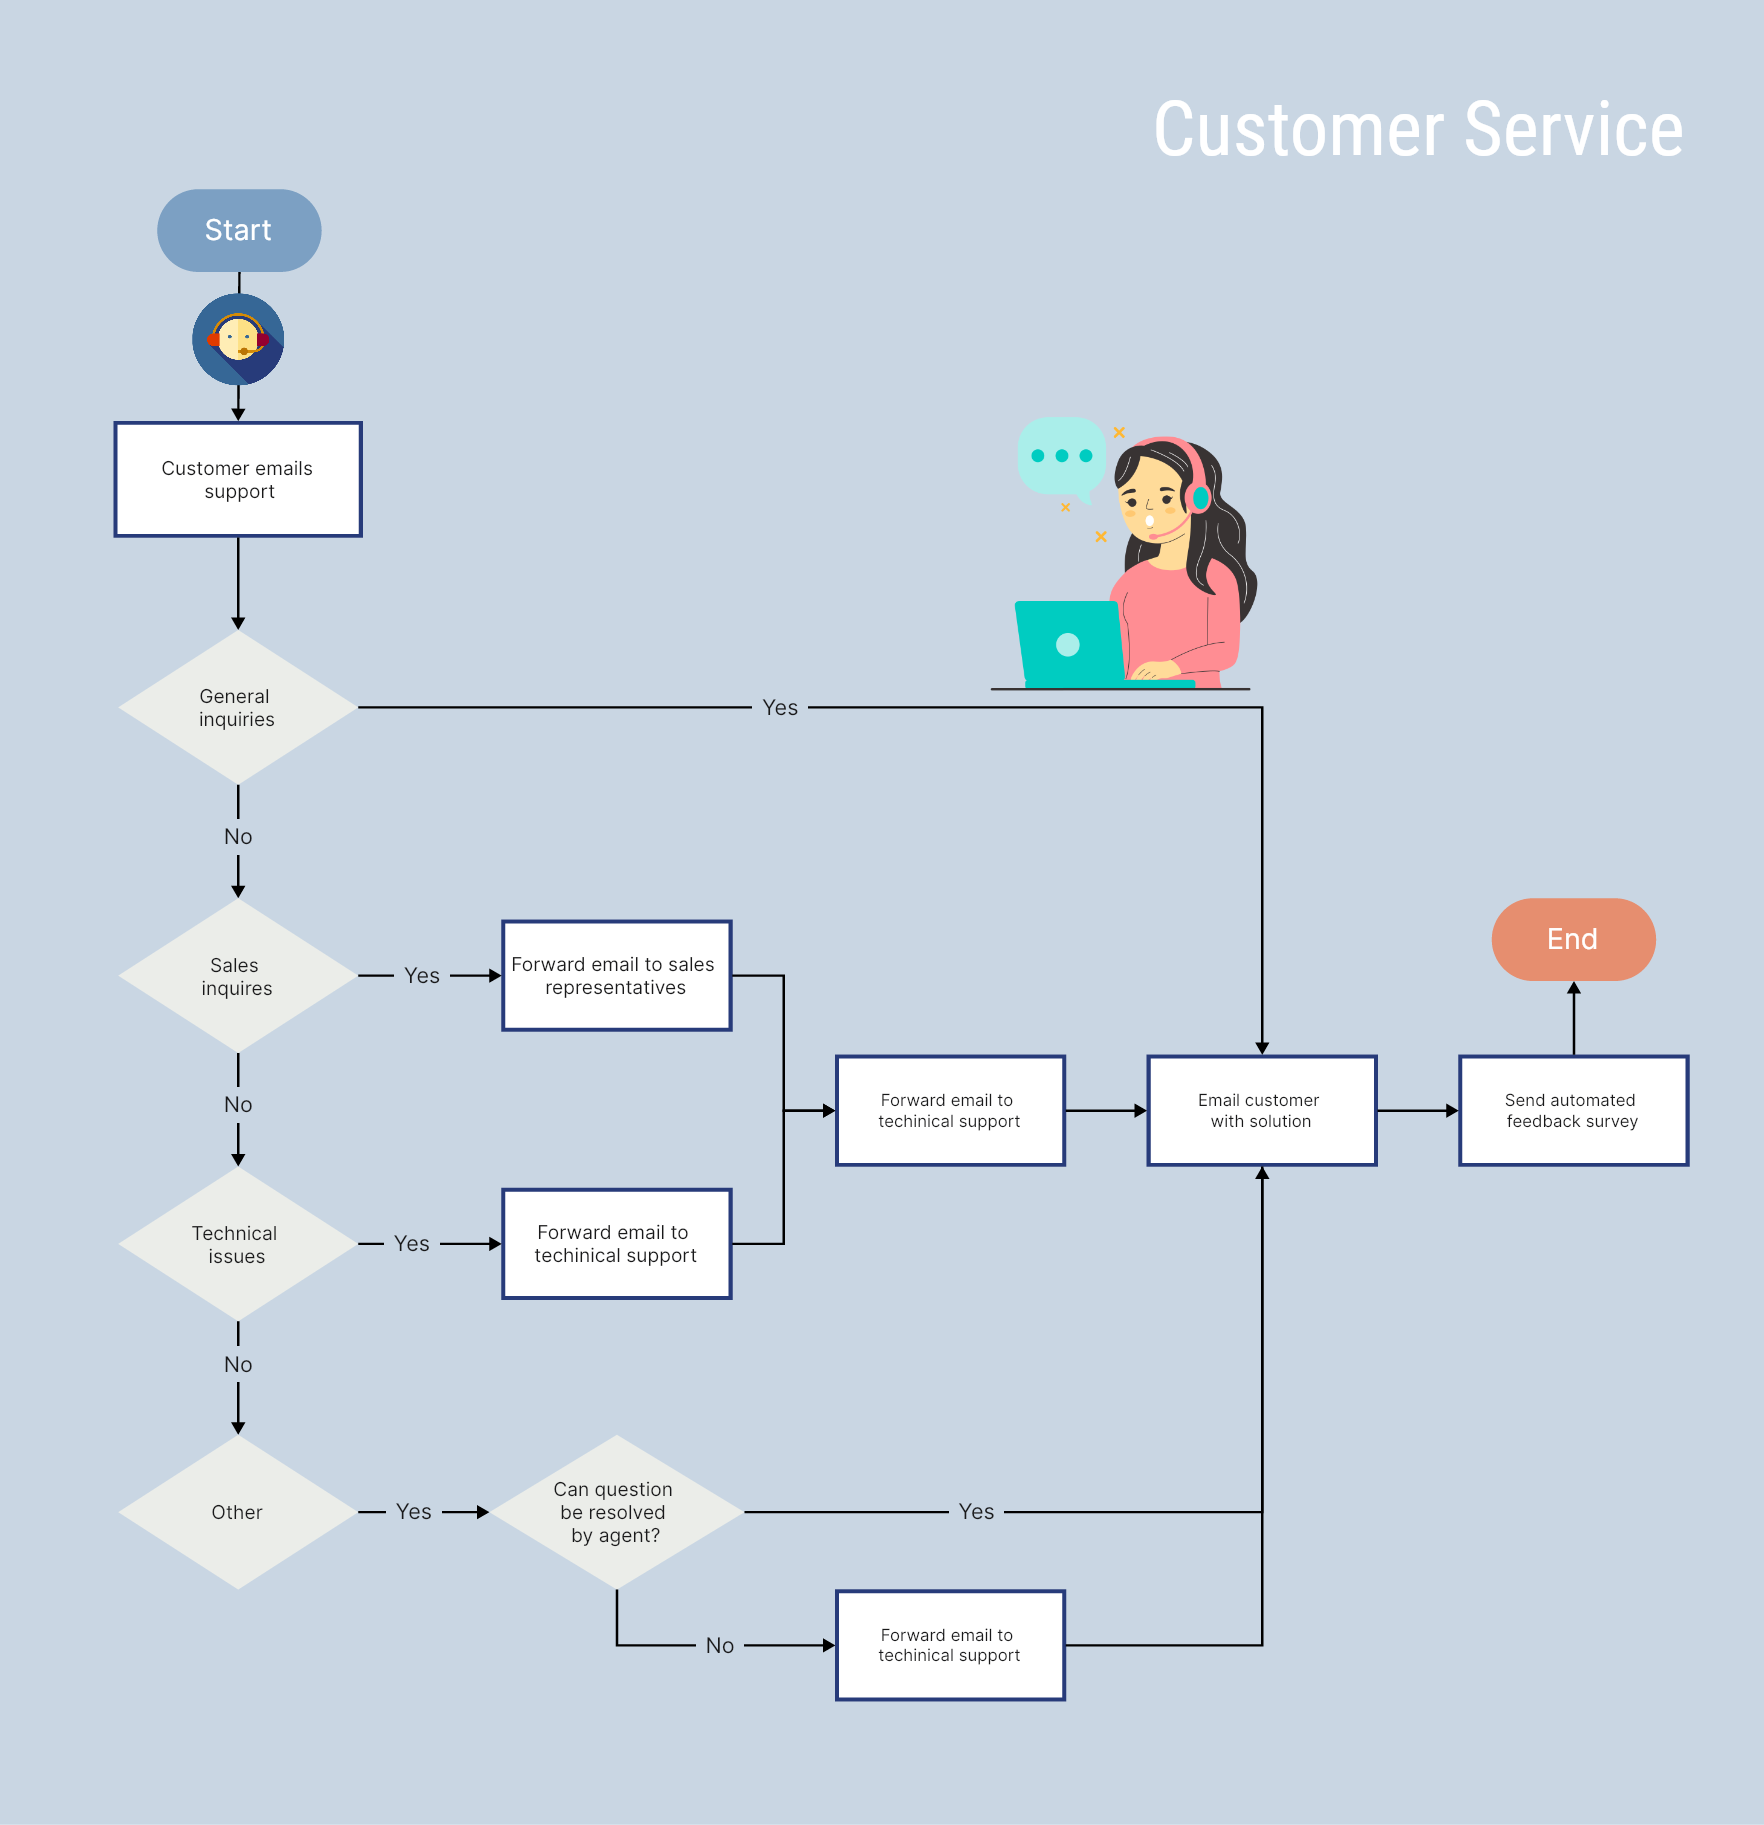
A customer service flowchart is a visual tool that outlines the various steps in the process and the order in which they are followed. It depicts the sequence of actions taken by customer service representatives or teams to address customer inquiries, resolve issues, ensure customer satisfaction, and ultimately enhance the overall customer experience.
6. Recruitment Process Flowchart
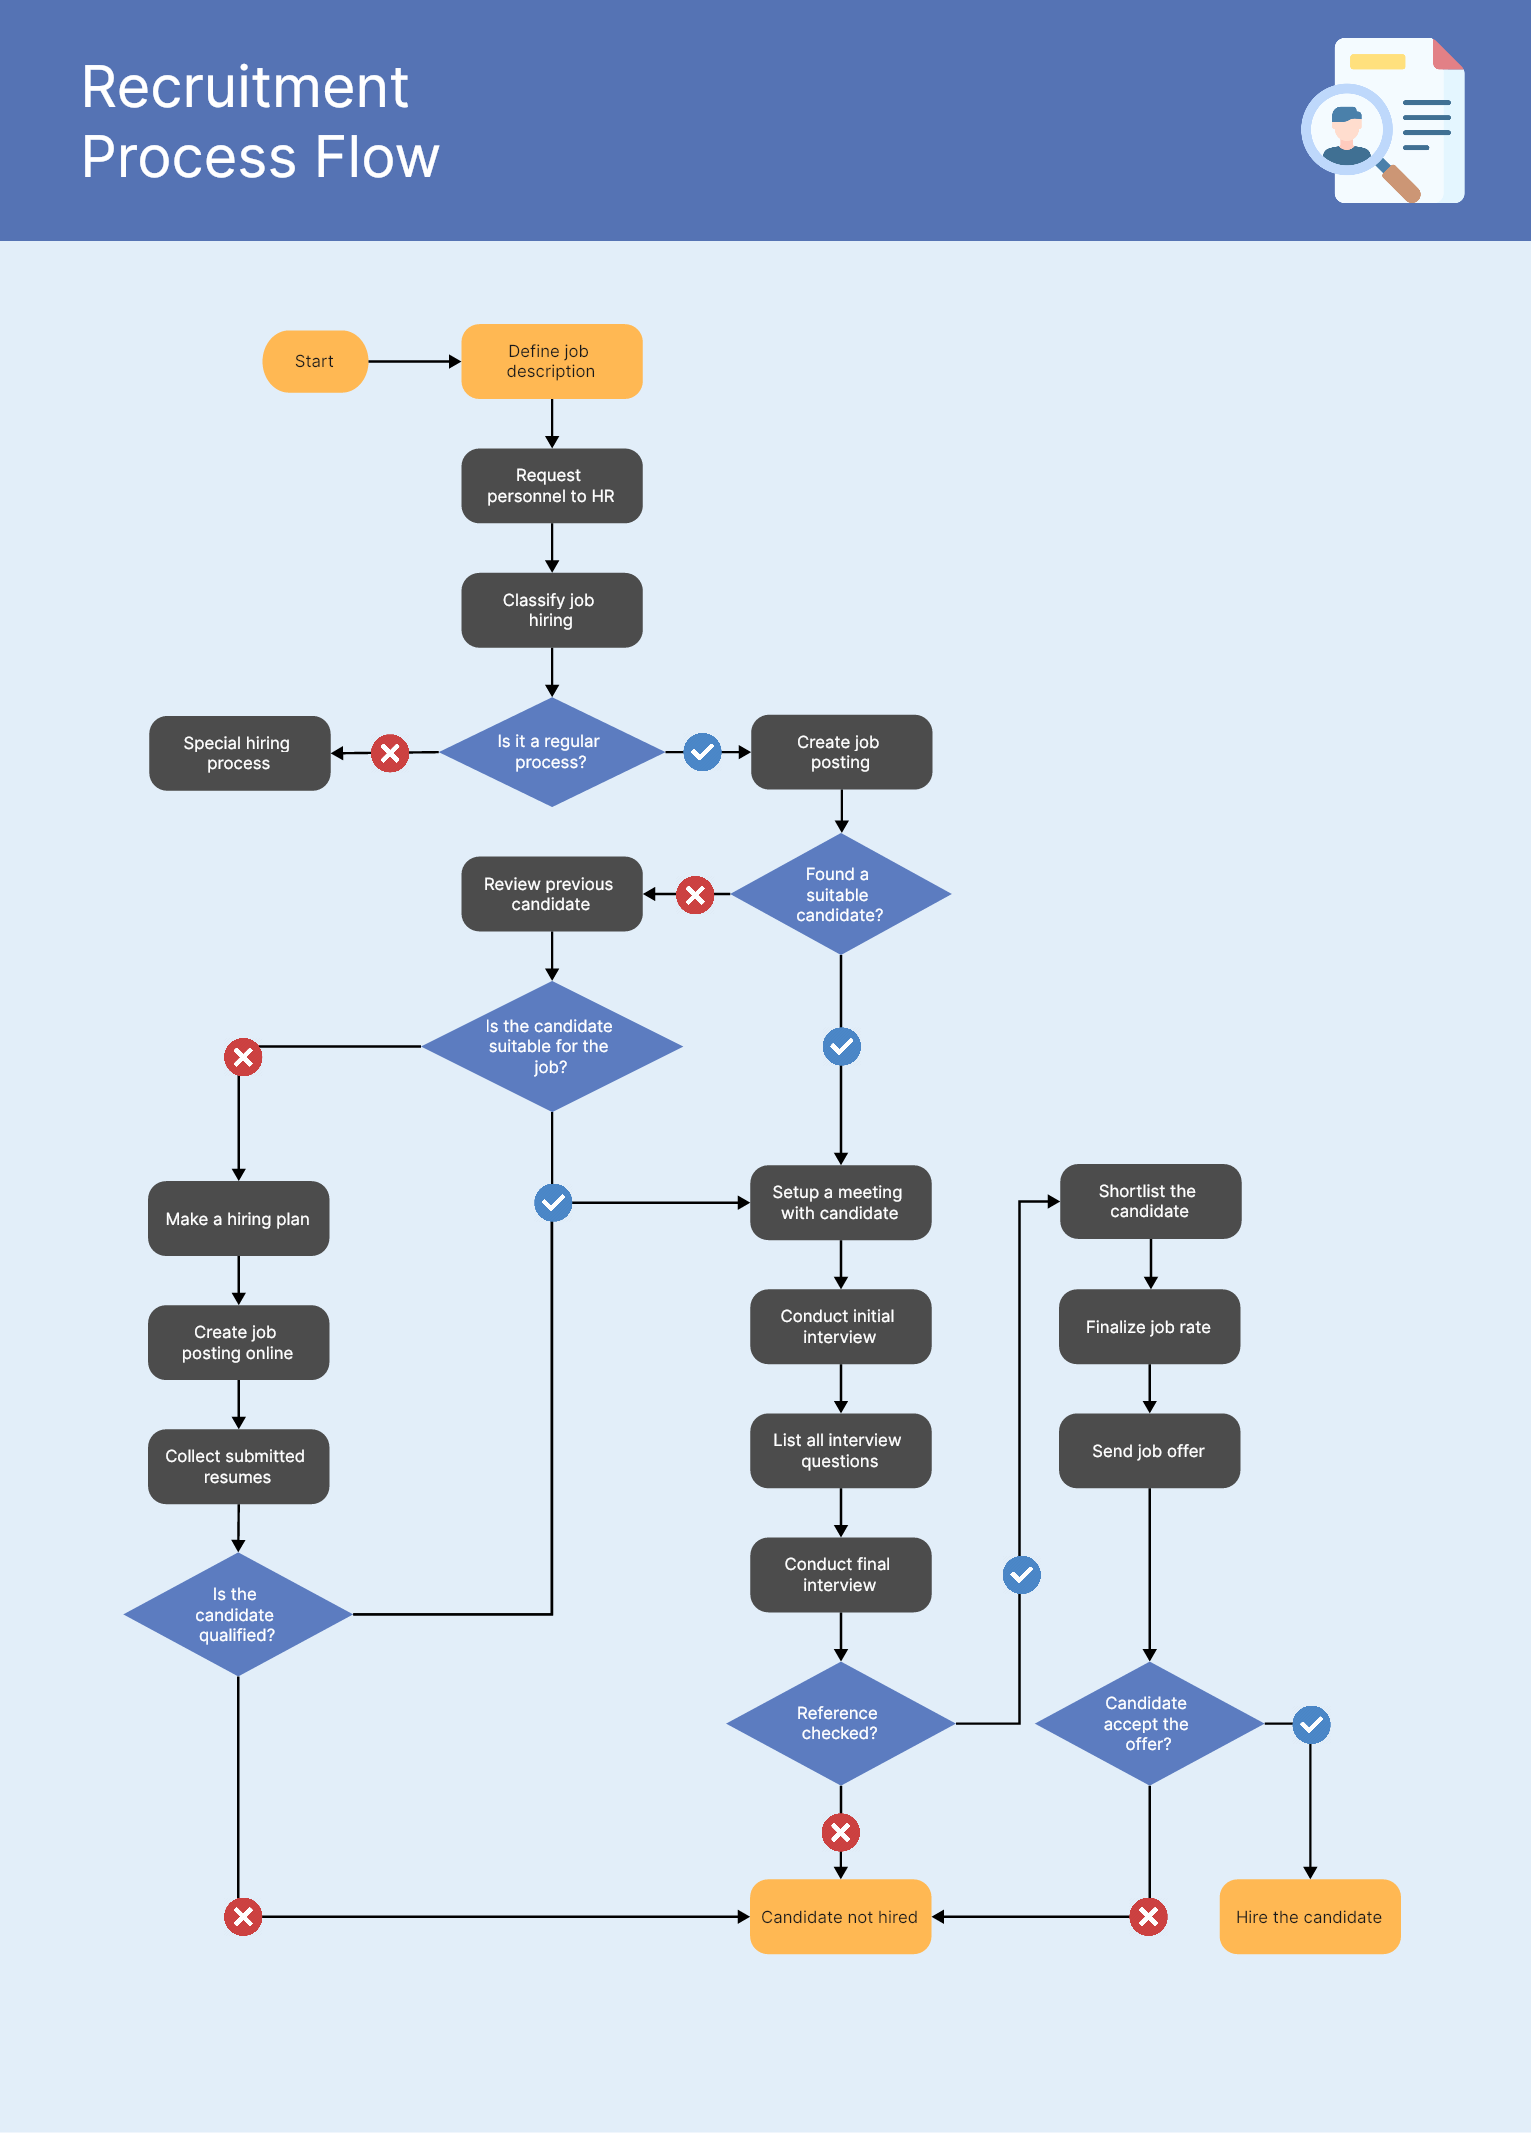
A recruitment process flowchart is a visual representation of a company’s plan to find and recruit new talent. Utilizing vivid images makes it more expressive and memorable than plain text. It is more understandable as it breaks down complicated hiring processes into manageable steps, allowing the information in the boxes to convey the core of the process concisely.
7. Programming Flowchart
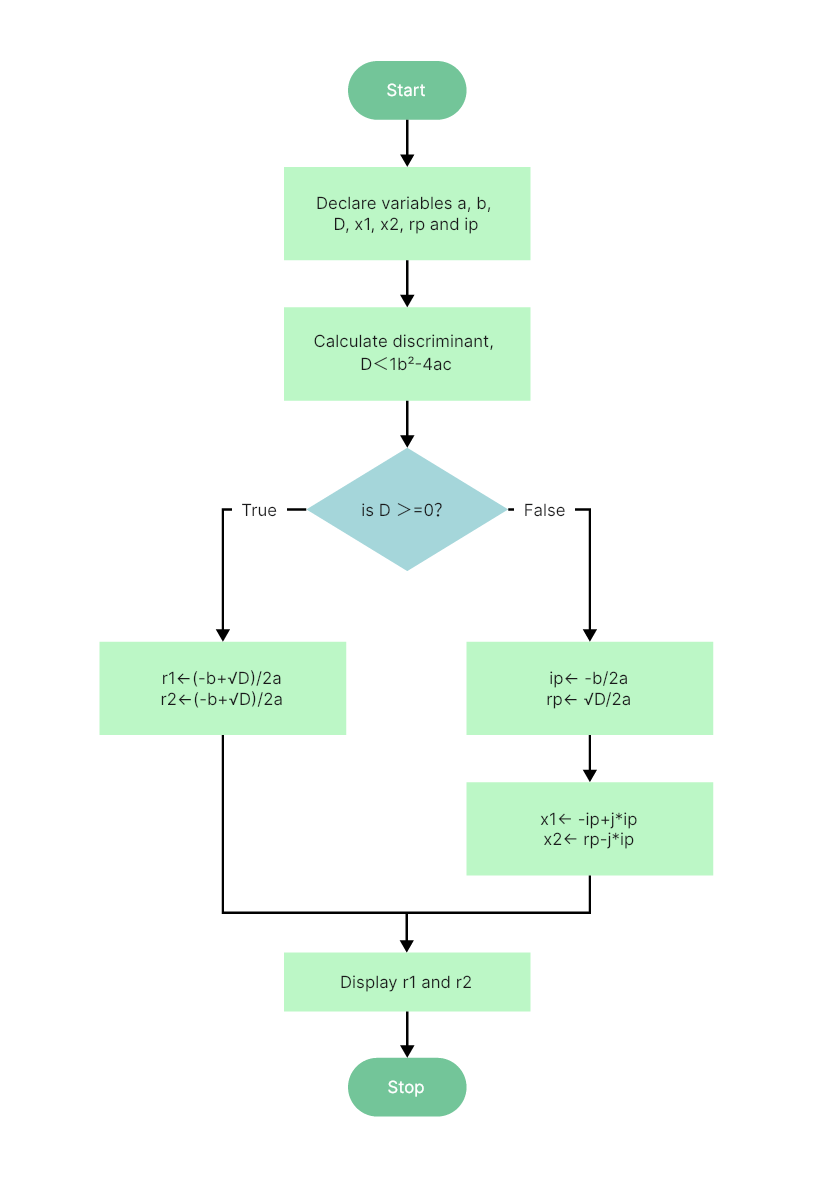
Programming can be complex, but with a flowchart, you can simplify intricate systems, making them more accessible to those who may not be familiar with programming. Programmers commonly employ flowcharts as a program-planning tool to solve problems, as they prove helpful in both writing programs and effectively communicating the program’s logic to others.
Notably, while flowcharts can be useful for programming, drawing a flowchart for complex programs can be more complicated than writing the program itself. Therefore, creating flowcharts for complex programs is often ignored. Below is an example of a programming flowchart designed to find all the roots of a quadratic equation ax²+bx+c=0.
8. Medical Service Flowchart
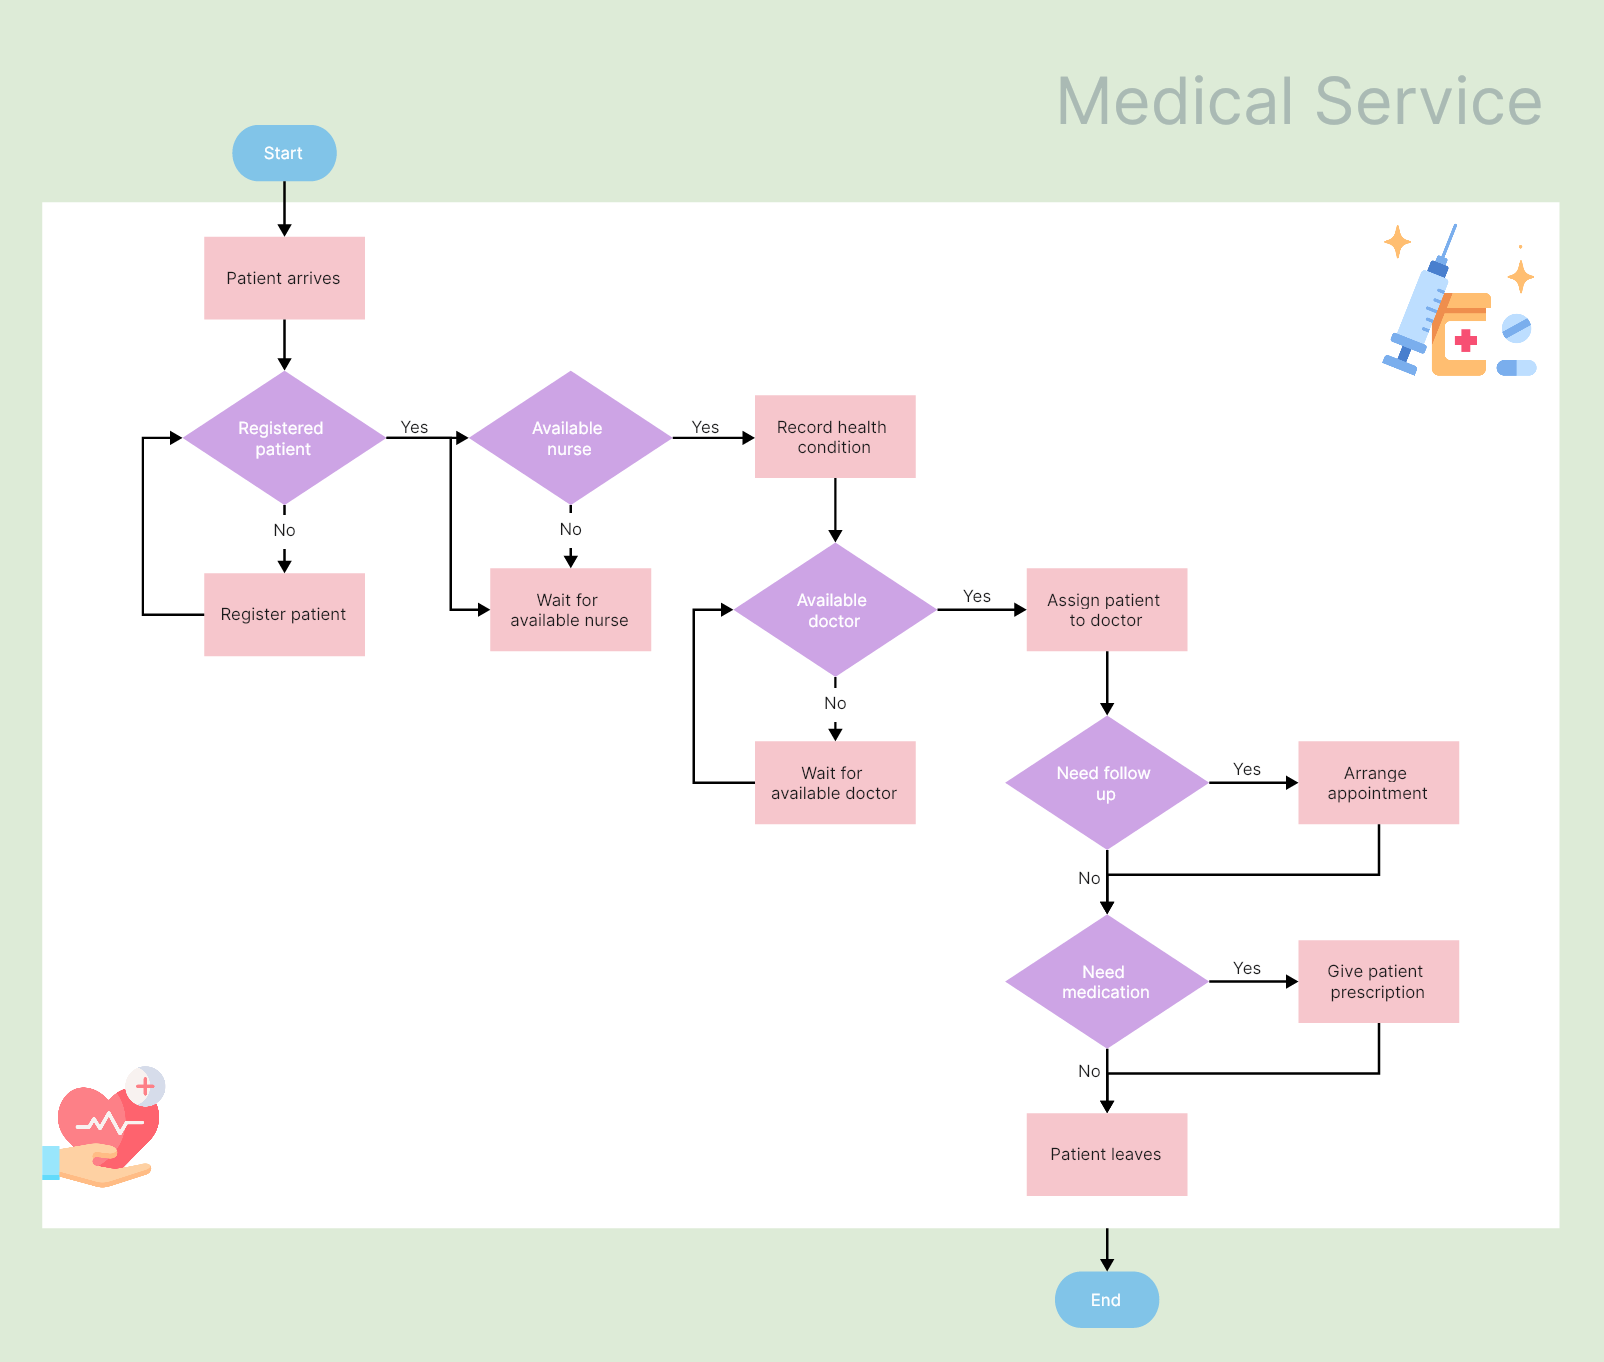
Flowcharts can be very beneficial in the medical field. As a visual representation of processes, they help medical professionals, administrators, and patients understand and follow procedures more efficiently. In this way, they enhance communication, reduce errors, and promote standardization to ultimately improve patient care and overall healthcare efficiency.
Below is an example of a hospital flowchart that illustrates the process for handling clinical cases. This flowchart uses decision shapes intensively in representing alternative flows.
9. Simple Sales Process Flowchart
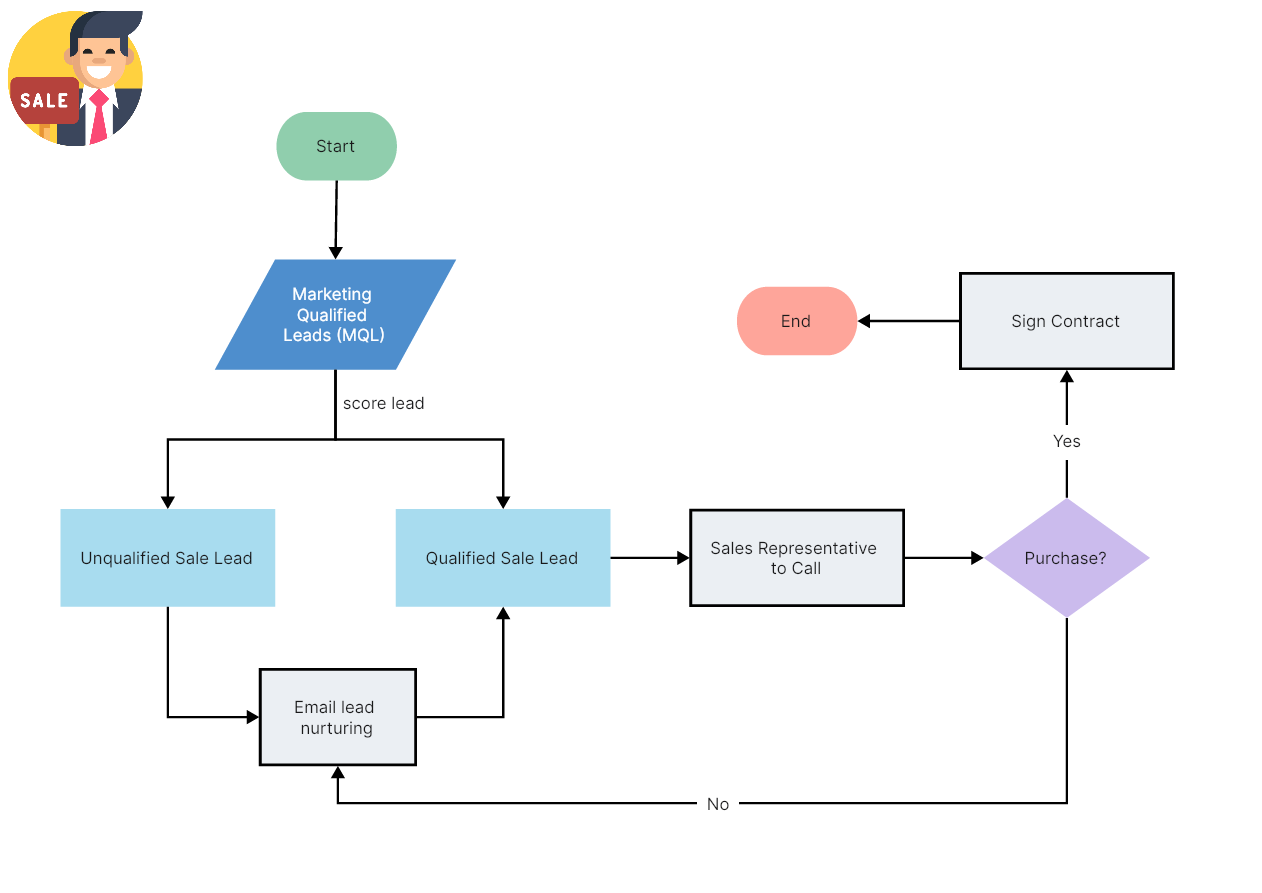
A Sales Process Flowchart is a type of flowchart that illustrates the step-by-step sequence of actions involved in selling a product or service. It outlines the various stages and activities that sales representatives or teams undergo, from the initial contact with a potential customer to closing the sale.
Sales processes are important because they provide a clear overview of the entire sales journey, help identify potential bottlenecks or inefficiencies, and allow for continuous improvement throughout the process.
10. Customer Payment Processing Flowchart
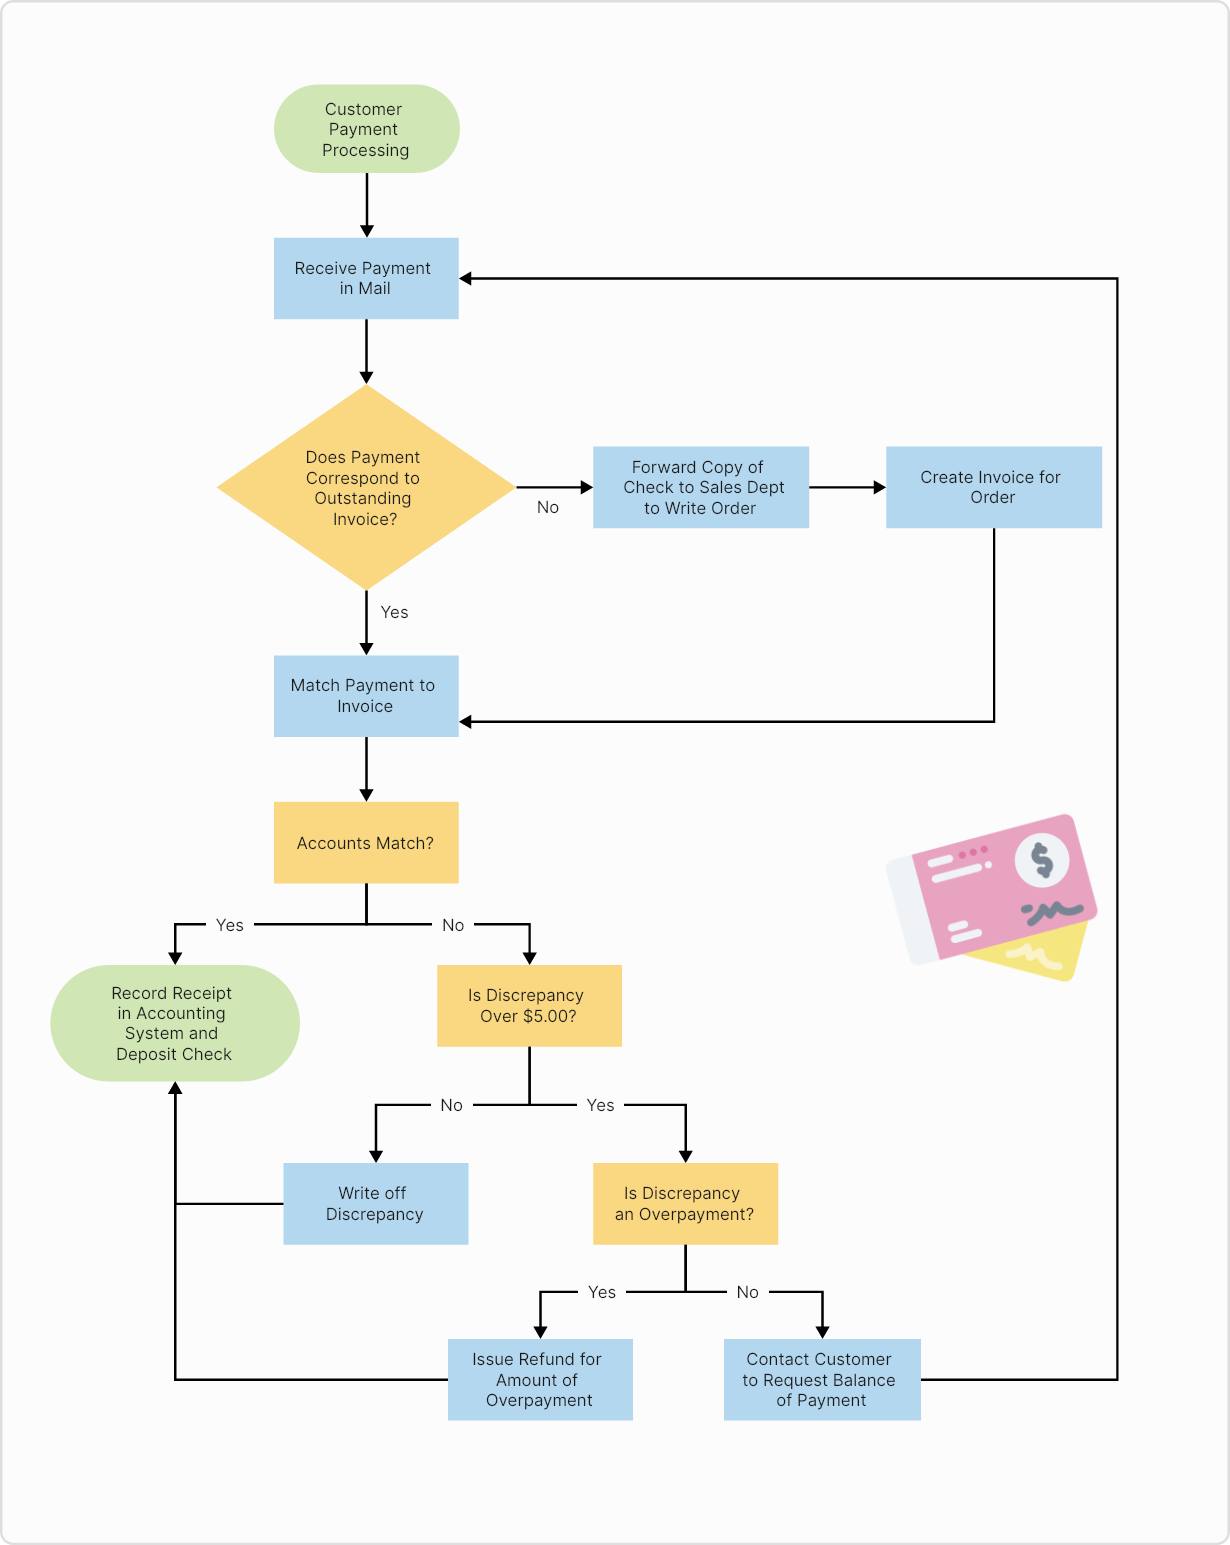
The Customer Payment Process Flowchart maps out the steps involved in the cash receipts process. Specifically, it describes how incoming payments for invoices are received and how the correct documents are processed in the required order. It is a critical part of the daily operations for organizations worldwide, as it makes sure incoming cash is deposited promptly and applied correctly, both vital for maintaining a healthy cash flow and sustaining the business.
You can customize this flowchart template to align with your company’s standards and provide your personnel with an easy-to-follow visual guide.
11. Order Management Flowchart
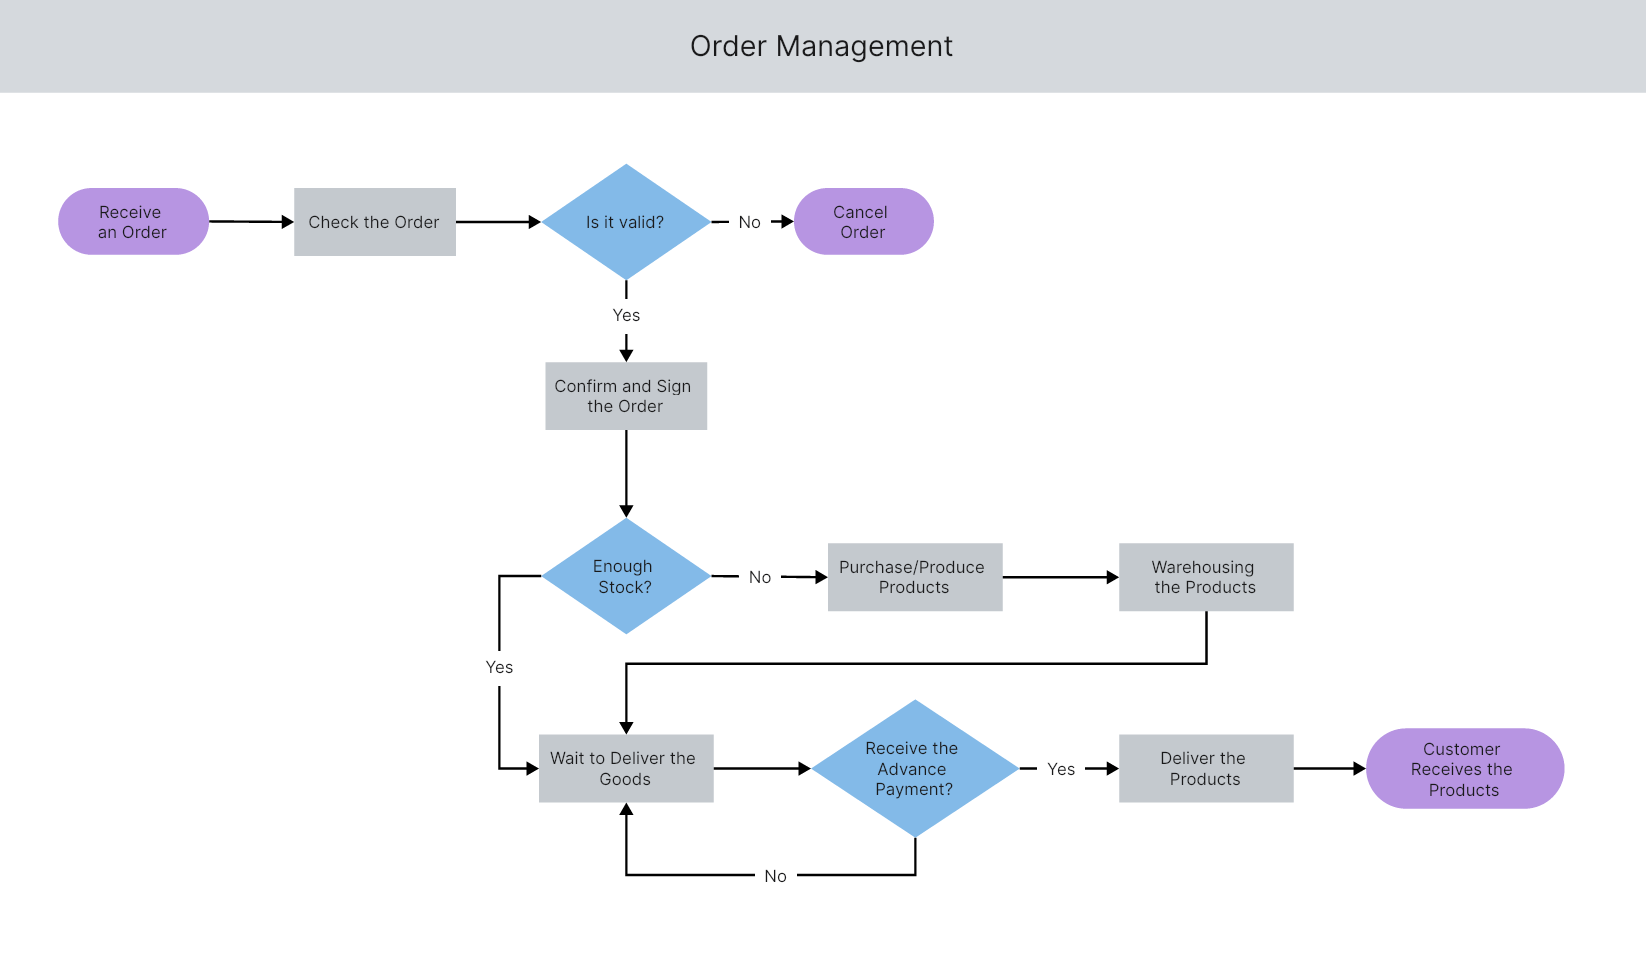
This flowchart outlines the steps involved in managing an order, from its receipt to its delivery. The process includes verifying the order’s validity and checking if there is sufficient inventory. If necessary, additional items can be ordered from suppliers. This template is suitable for companies of all sizes, as it helps to ensure excellent customer service.
12. Credit Card Order Process Flowchart
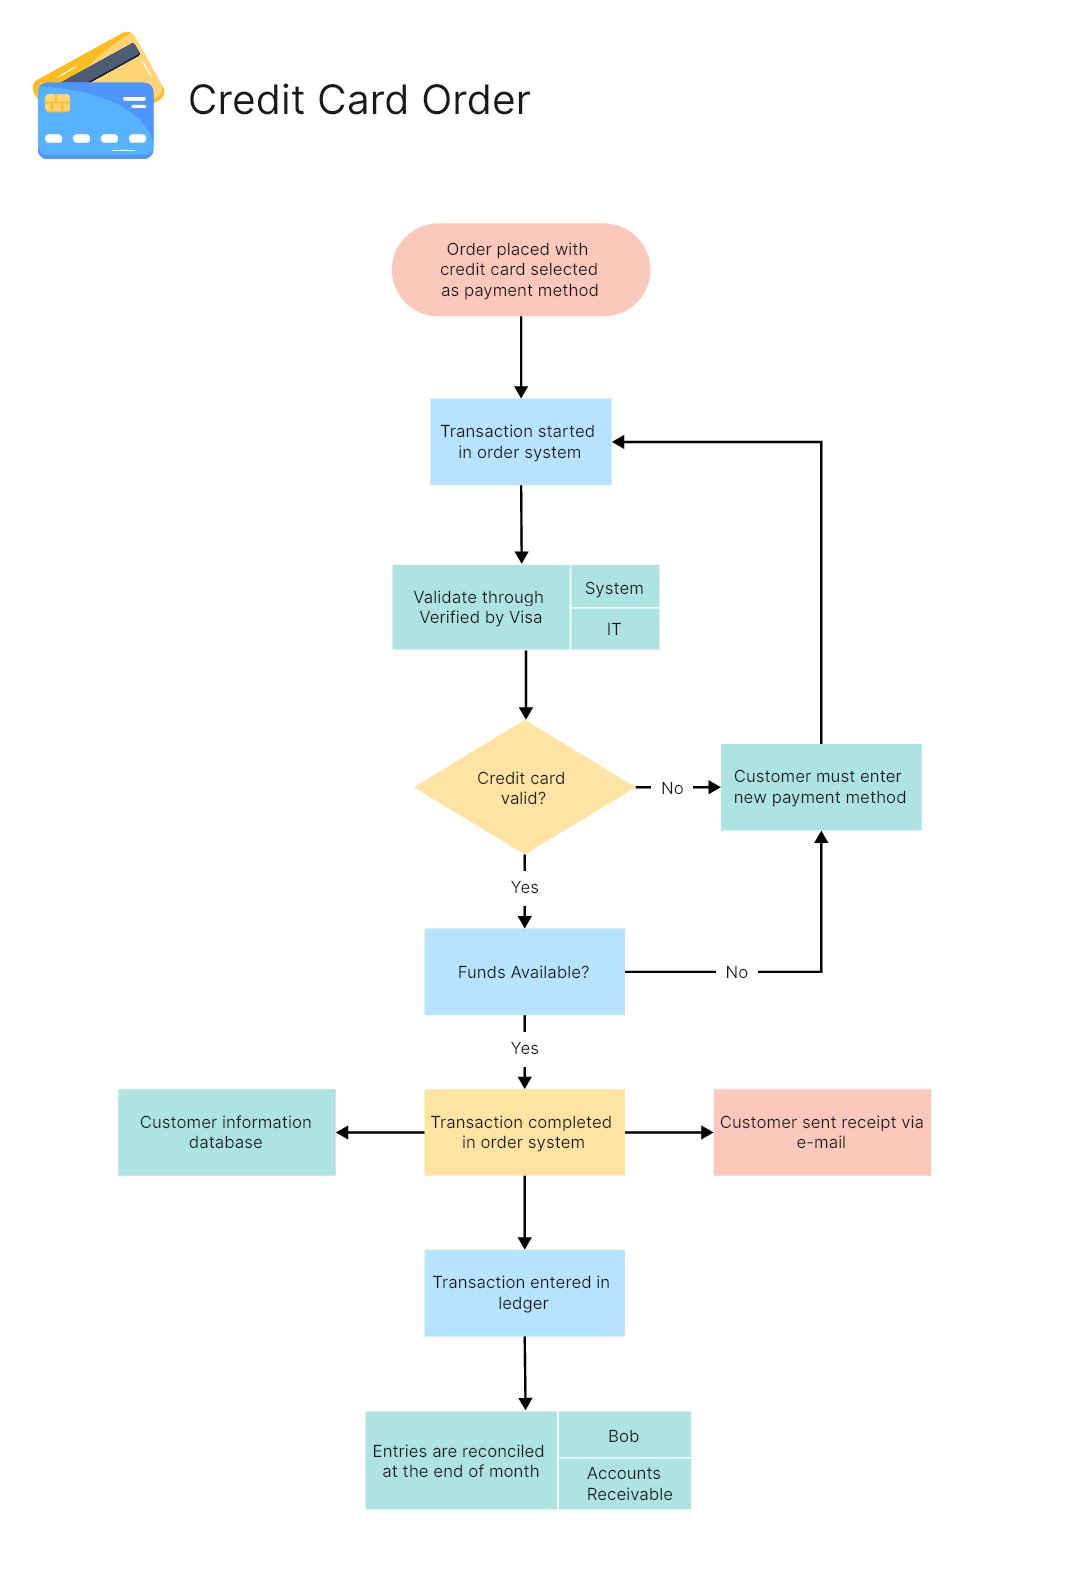
If your organization accepts credit cards, you know how important it is to have a well-defined process for it. The flowchart diagram is commonly used for the credit card order process. This process ensures that all parties involved in handling credit card payments follow a strict procedure. The flowchart helps to prevent errors when receiving funds through electronic payment. It can be used as an instruction manual for both company employees and the IT team responsible for implementing necessary checks before considering a payment complete and sending the information to the accounting department.
13. Vendor Payment Process Flowchart
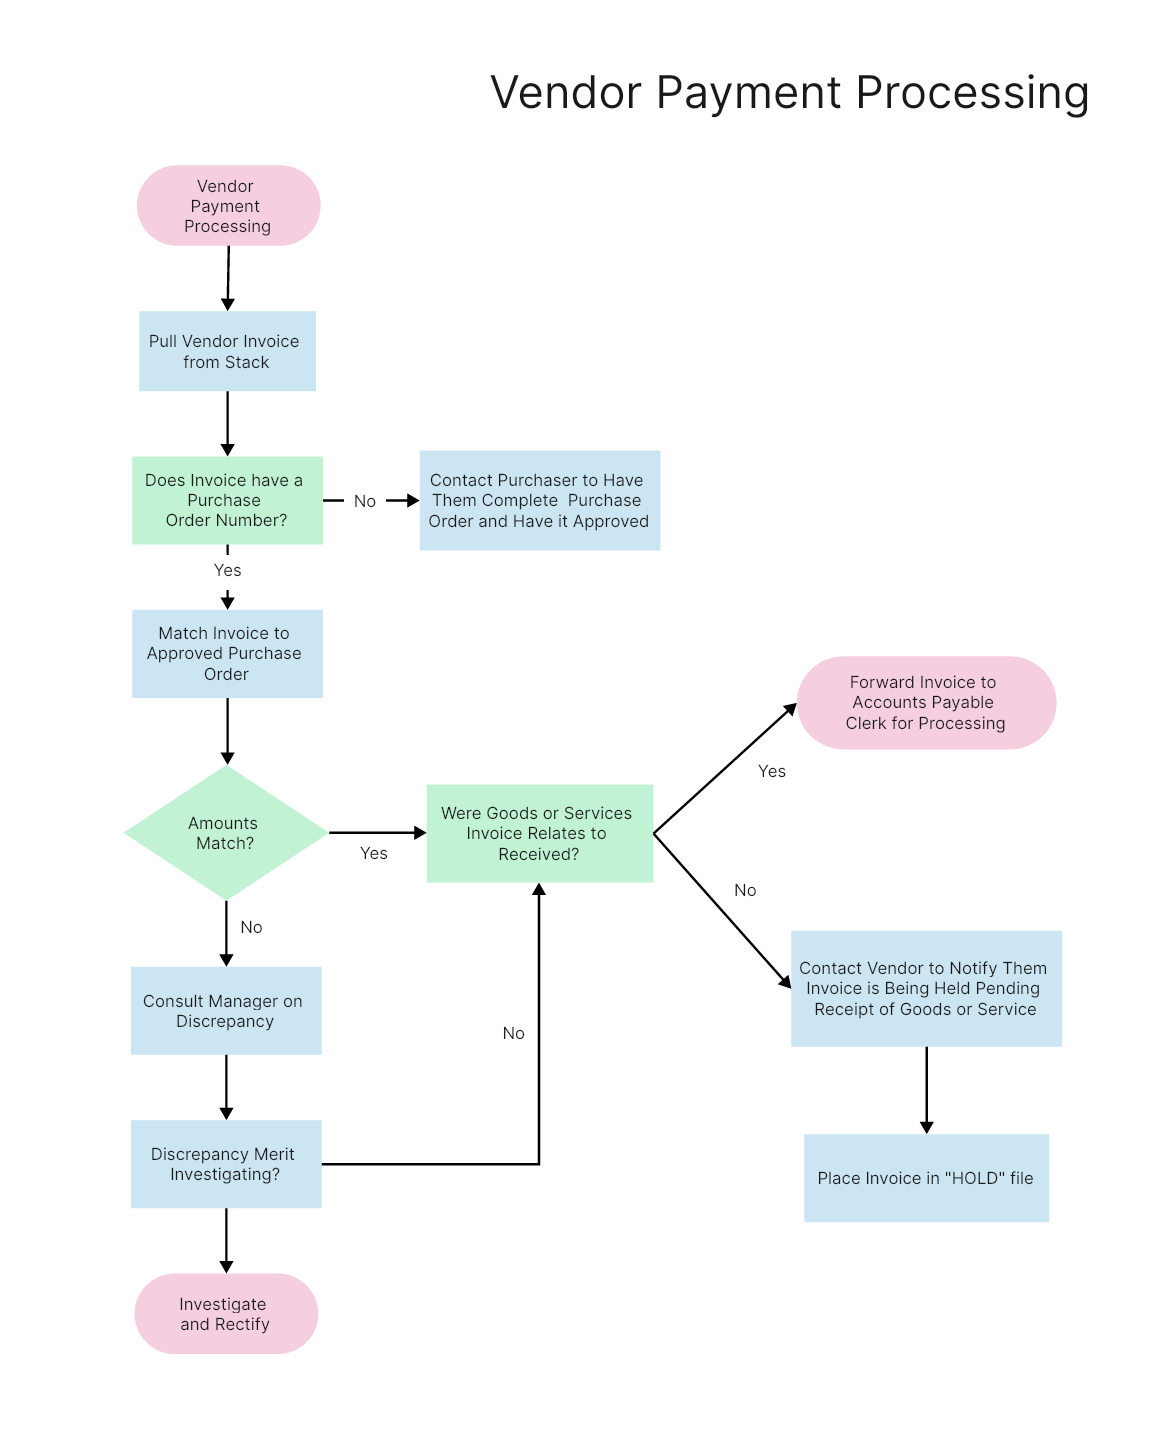
Visualize the vendor payment process to avoid the inconvenience of late payments and the burden of extra charges or service disruptions. Streamline the process of vendor payments by referring to this flowchart example, which highlights the necessary document flow, approvals, and verifications required to settle bills in your organization. You can also attach vendor lists, internal forms, and other relevant details to maintain a comprehensive record of your bill-paying process.
14. Online Menu Ordering Process Flowchart
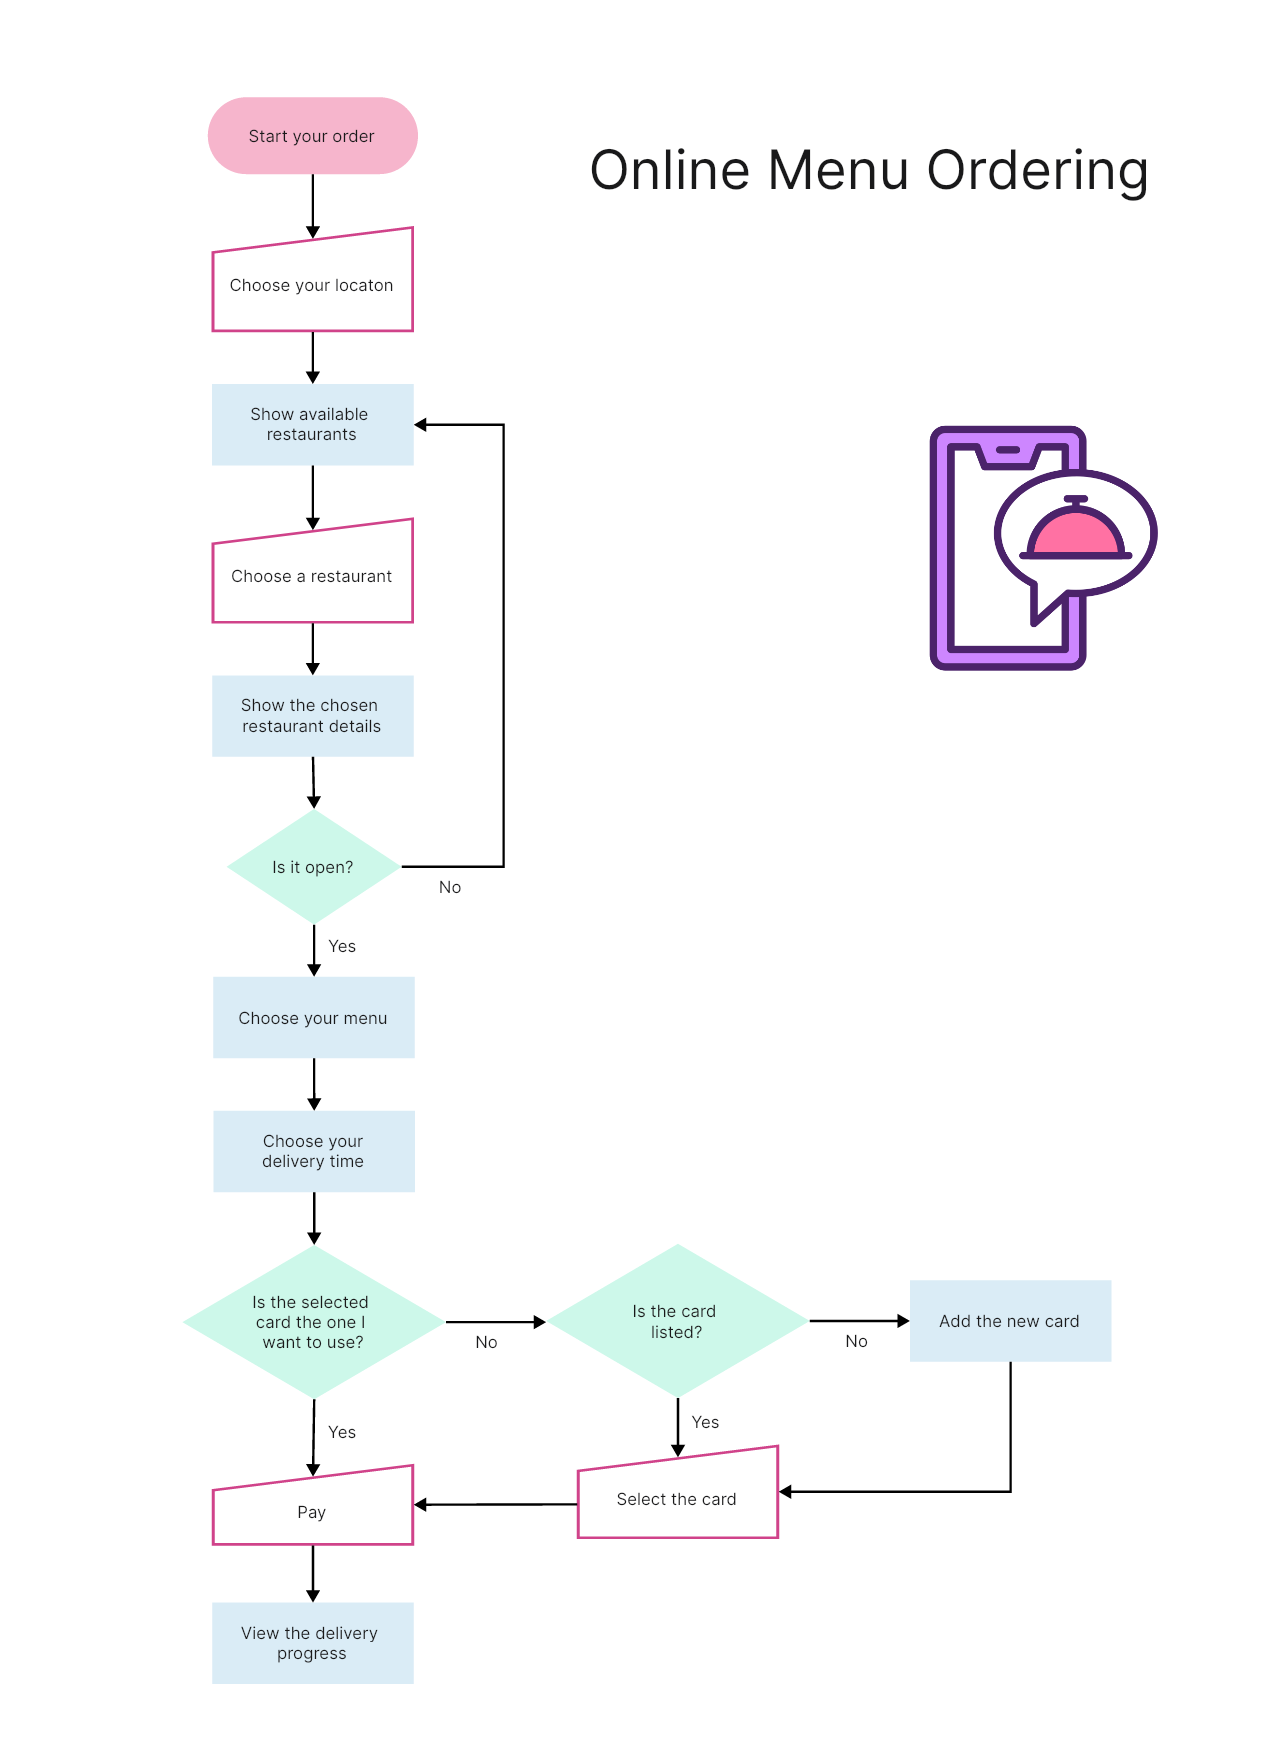
Below is a flowchart example that illustrates the steps involved in placing a menu order through an online restaurant delivery portal. The process includes entering the customer’s location, the restaurant choice, and the payment using a card. More details are available in the following diagram.
15. Restaurant Food Ordering Flowchart
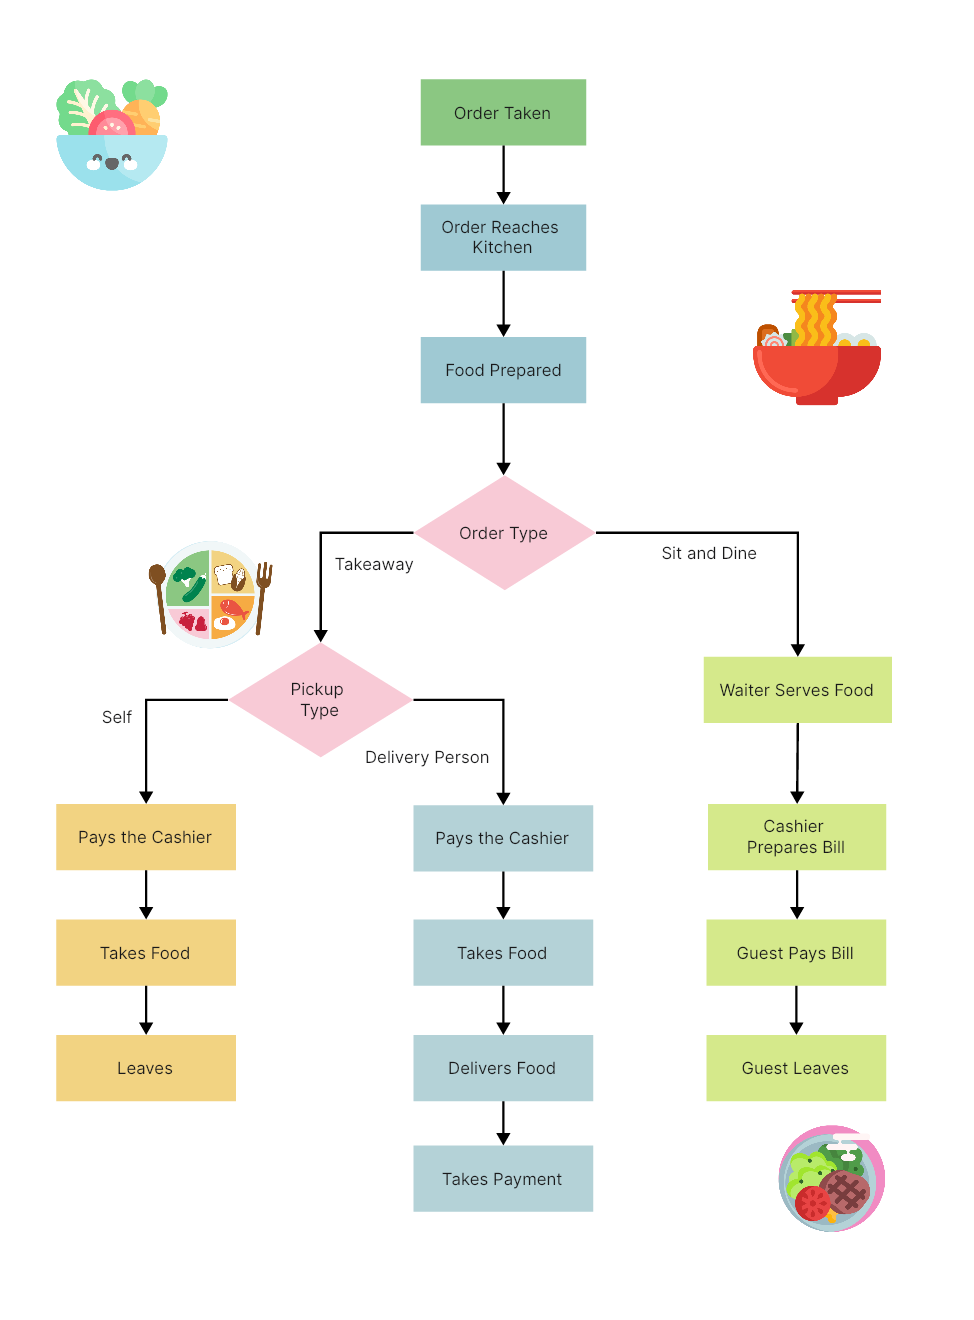
This flowchart shows the general steps and elements that you can include in a Restaurant Food Ordering flowchart. You can further customize the flowchart to include decision points for handling specific scenarios, such as customer requests for substitutions, delays in food preparation, or special promotions. Additionally, if your restaurant offers online ordering or delivery services, you can include separate branches for those processes. Also, Keep in mind that the exact flowchart may vary depending on the restaurant’s operations and processes. It’s essential to tailor the flowchart to match the specific workflow of your restaurant’s food ordering system.
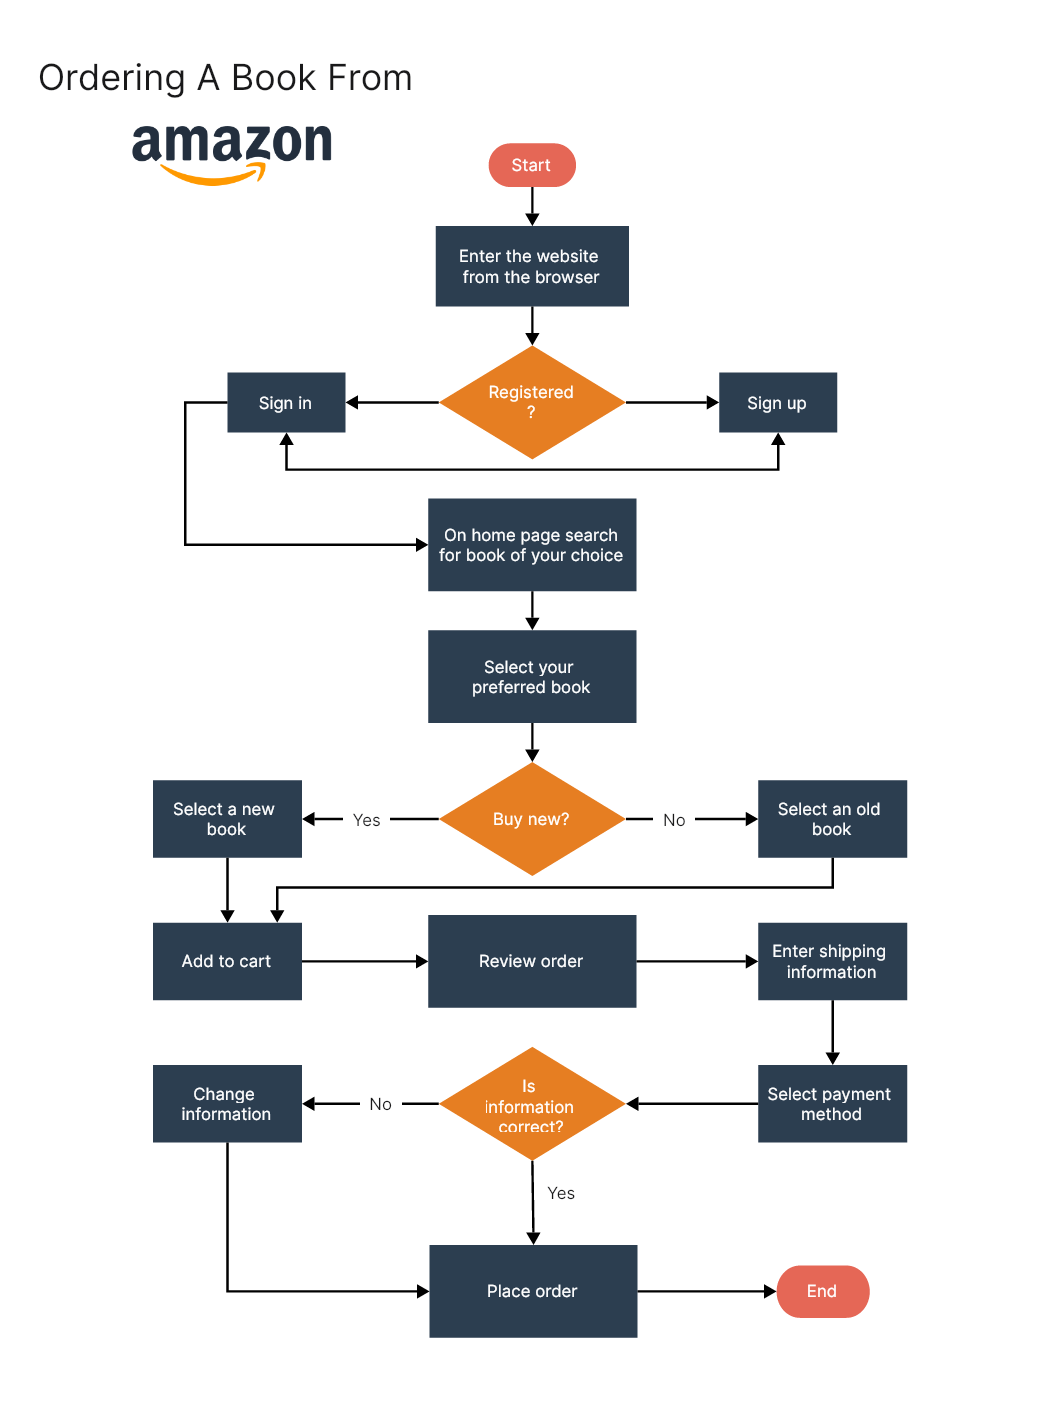
16. Amazon Book Online Order Process Flowchart
The following diagram visualizes the general steps involved in the Amazon Book Online Order Process. You may include additional steps and decision points for specific scenarios, such as order tracking, customer service interactions, or dealing with out-of-stock items. The specific steps may also vary depending on the user’s device (e.g., desktop, mobile app) and the region where the order is placed.
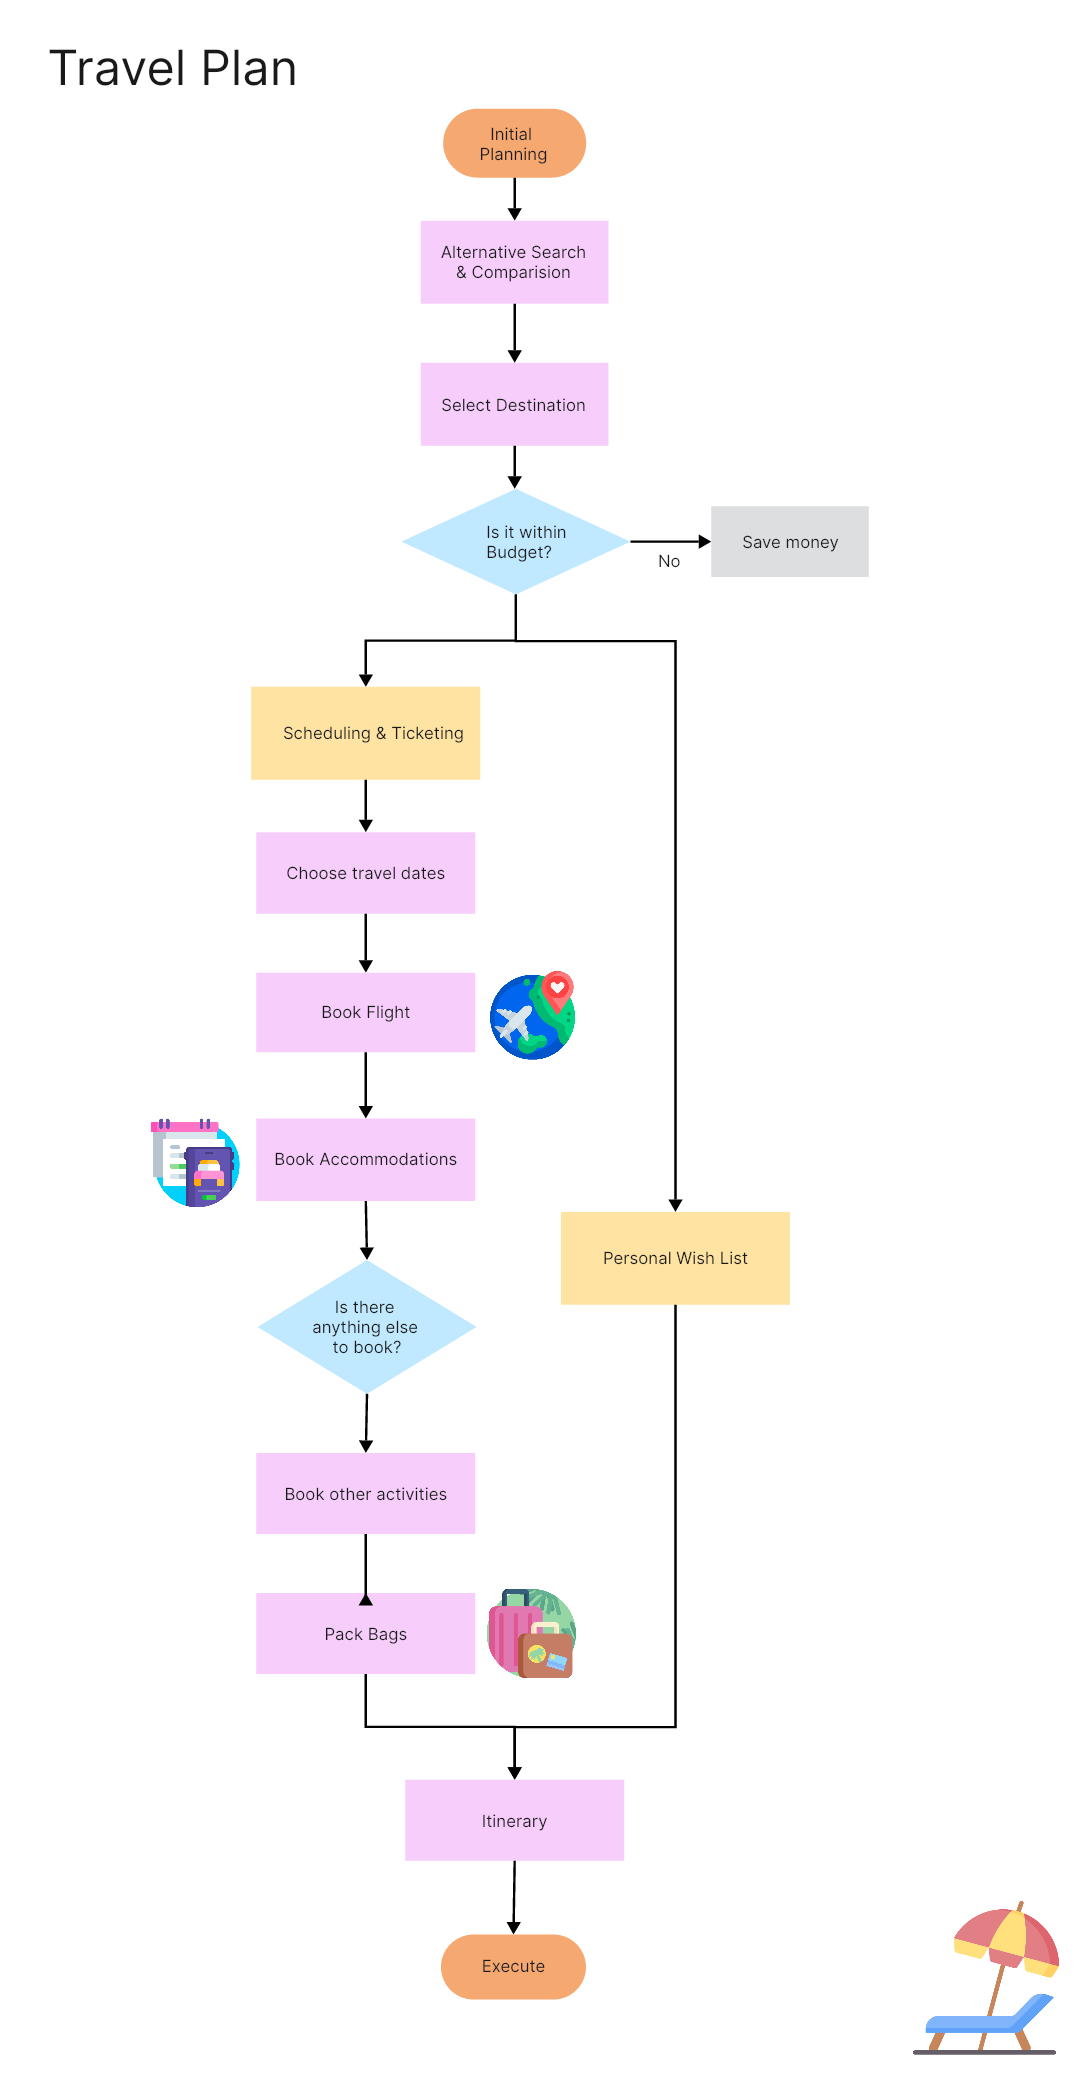
17. Travel Planning Flowchart
Crafting a travel planning flowchart offers a clear and organized approach to trip preparation, ultimately saving time and reducing stress. This approach helps to identify any potential issues, improves communication between travel companions, and ensures that travelers have everything they need for their trip. By following the flowchart, travelers can make the most of their time by seeing and doing everything they want while still having time to relax and unwind. Overall, a well-designed travel planning flowchart proves instrumental in orchestrating a successful, cost-effective, and enjoyable travel experience.
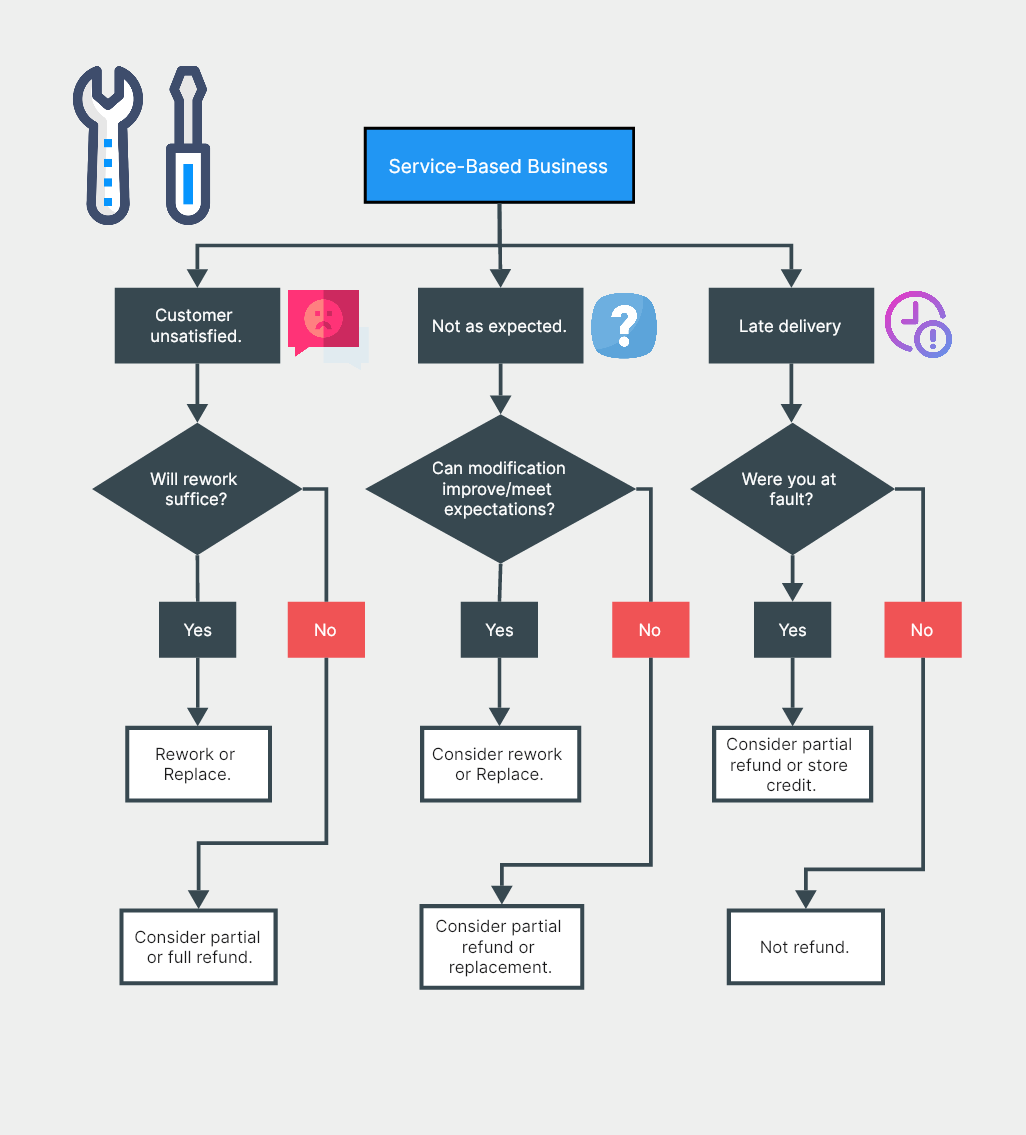
18. Return and Refund Policy Flowchart for Service-Based Business
For service-based companies, it is crucial to establish policies and procedures that address customer dissatisfaction related to their service or project outcomes. Since returns may not be feasible in service-based businesses, owners must carefully consider alternative options such as refunds (both full and partial), replacements, or rework. The flowchart below provides a framework for businesses to make these decisions effectively.
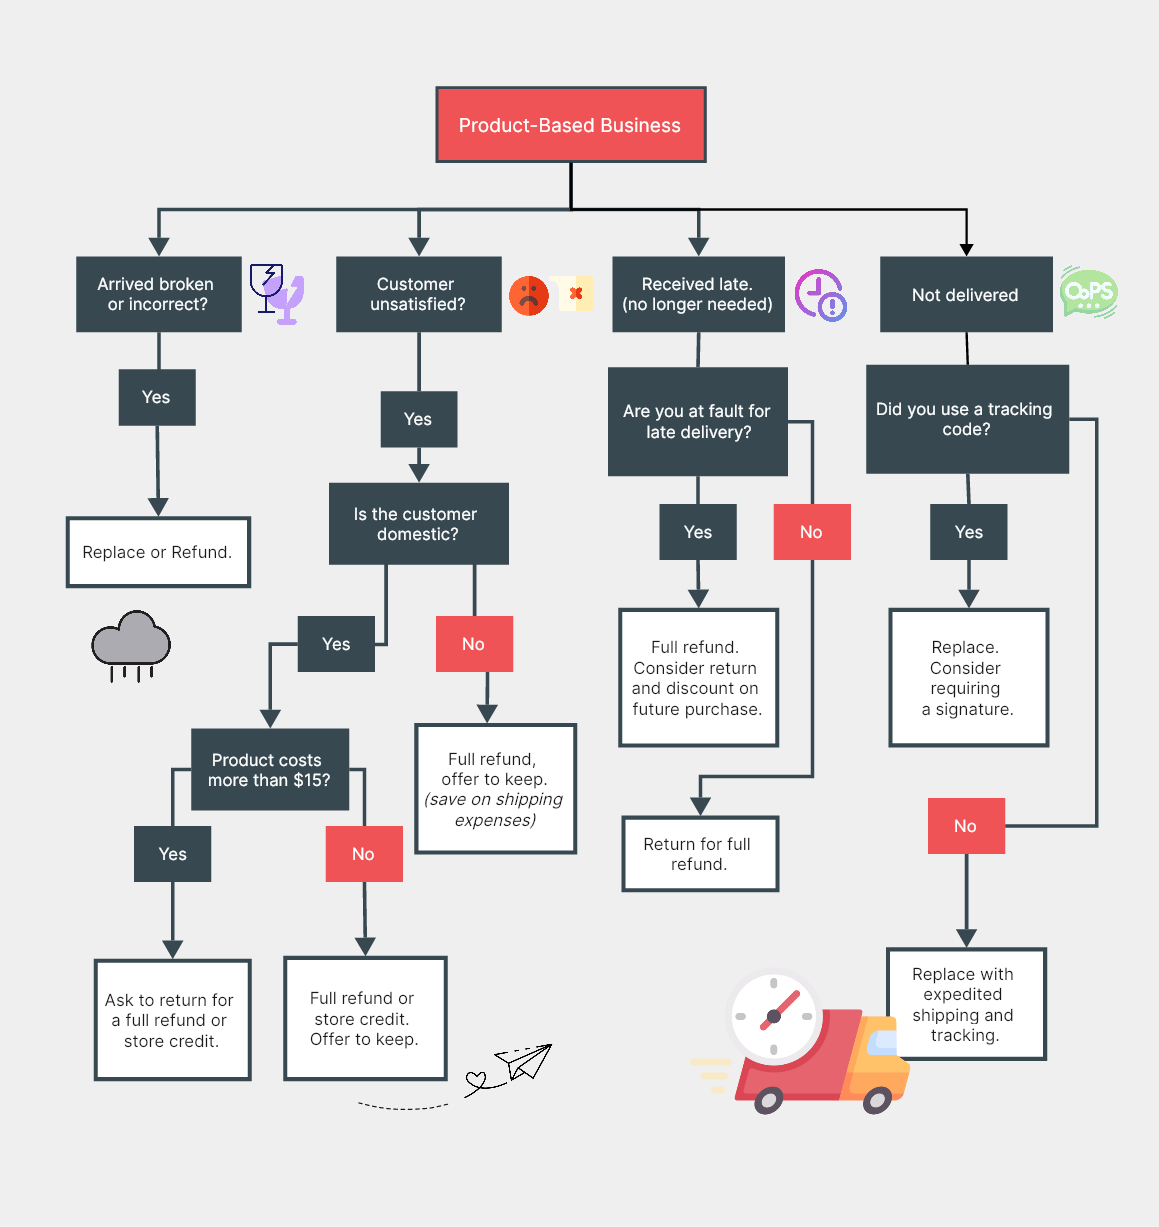
19. Return and Refund Policy Flowchart for Product-Based Business
The return and refund situations for product-based companies differ significantly from those of service-based businesses. Whether you operate a brick-and-mortar or e-commerce business, handling returns can be costly due to expenses associated with shipping, restocking, or recycling returned items. To make the best decision for your product-based business, consider the following framework for determining whether to return, replace, or refund a customer.
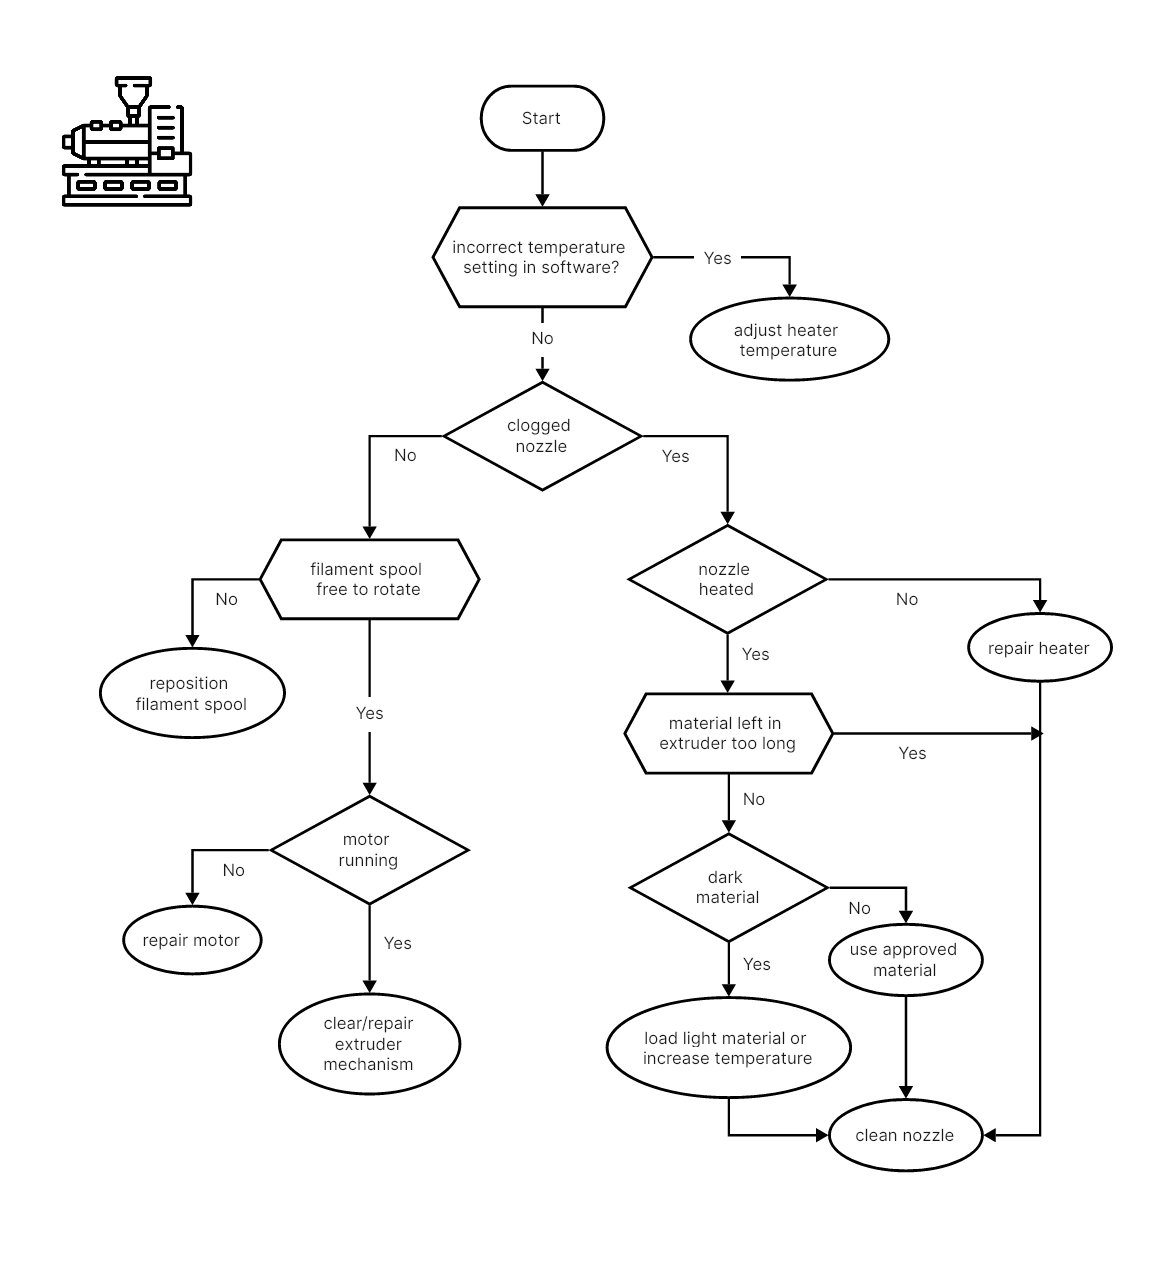
20. Troubleshooting Flowchart for Extruder Malfunctions
The following example comes from a research article that discusses 3D-printing laboratory experiences with unsuccessful prints in an undergraduate engineering 3D-printing lab using inexpensive 3D printers implementing fused deposition modeling (FDM) technology. A common issue with 3D printers is the filament extrusion problem, where a printer stops extruding material. Due to the numerous possible causes of this fault, a troubleshooting flowchart is developed.
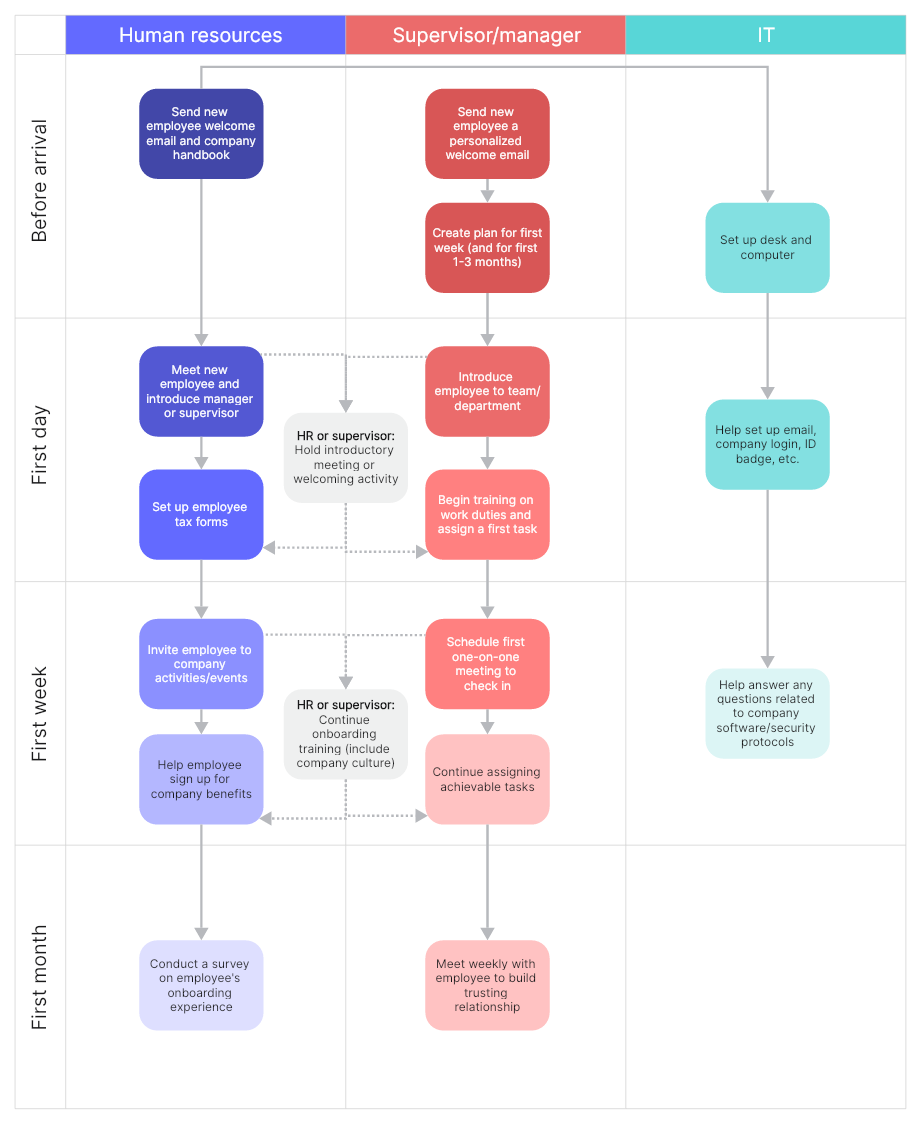
21. Employee Onboarding Process Flowchart
An onboarding process aids new employees in quickly adjusting to their job’s social and performance aspects. It can range from simple introductions to coworkers to in-depth training on company software and procedures. Creating an onboarding process flow properly introduces new hires to the company culture, responsibilities, and colleagues, fostering a more welcoming environment. Below is an example flowchart that illustrates the employee onboarding process, helping hiring managers enhance the employee joining experience.
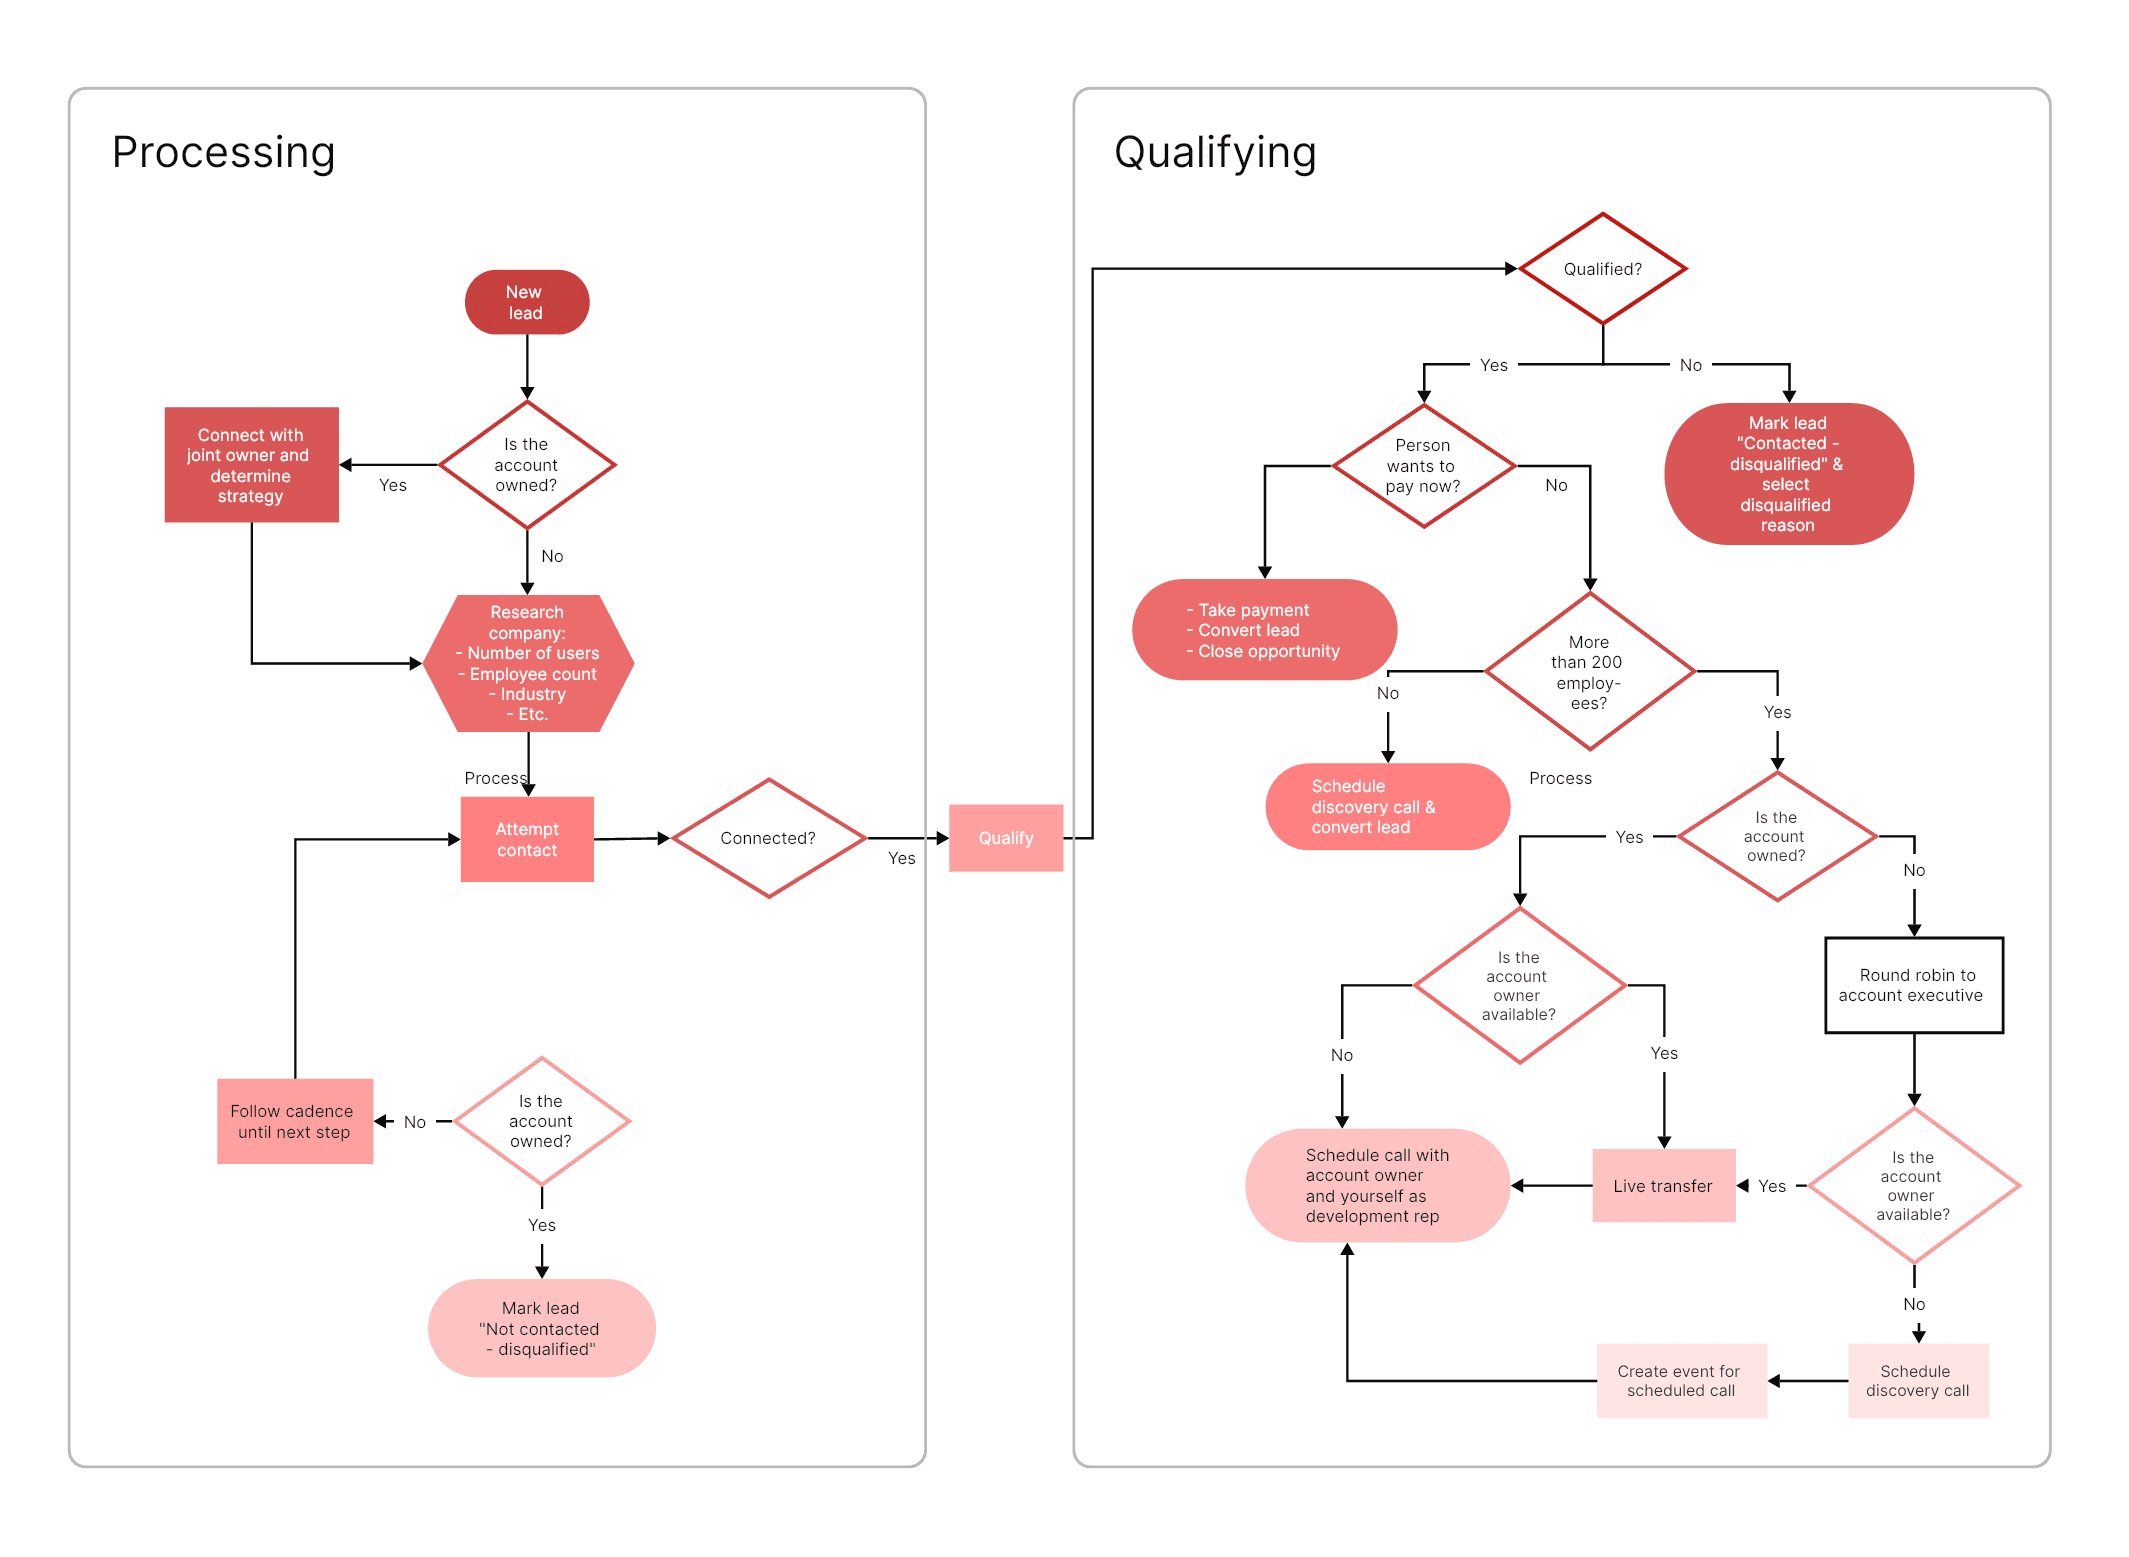
22. Processing and Qualifying Leads Flowchart
This processing and qualifying leads example template can help you: - Visualize your leads qualifying process to capitalize on leads. - Accurately assign leads to the correct account manager. - Create a process for converting the leads. Open this template to view a detailed example of a processing and qualifying leads diagram that you can customize to your use case.
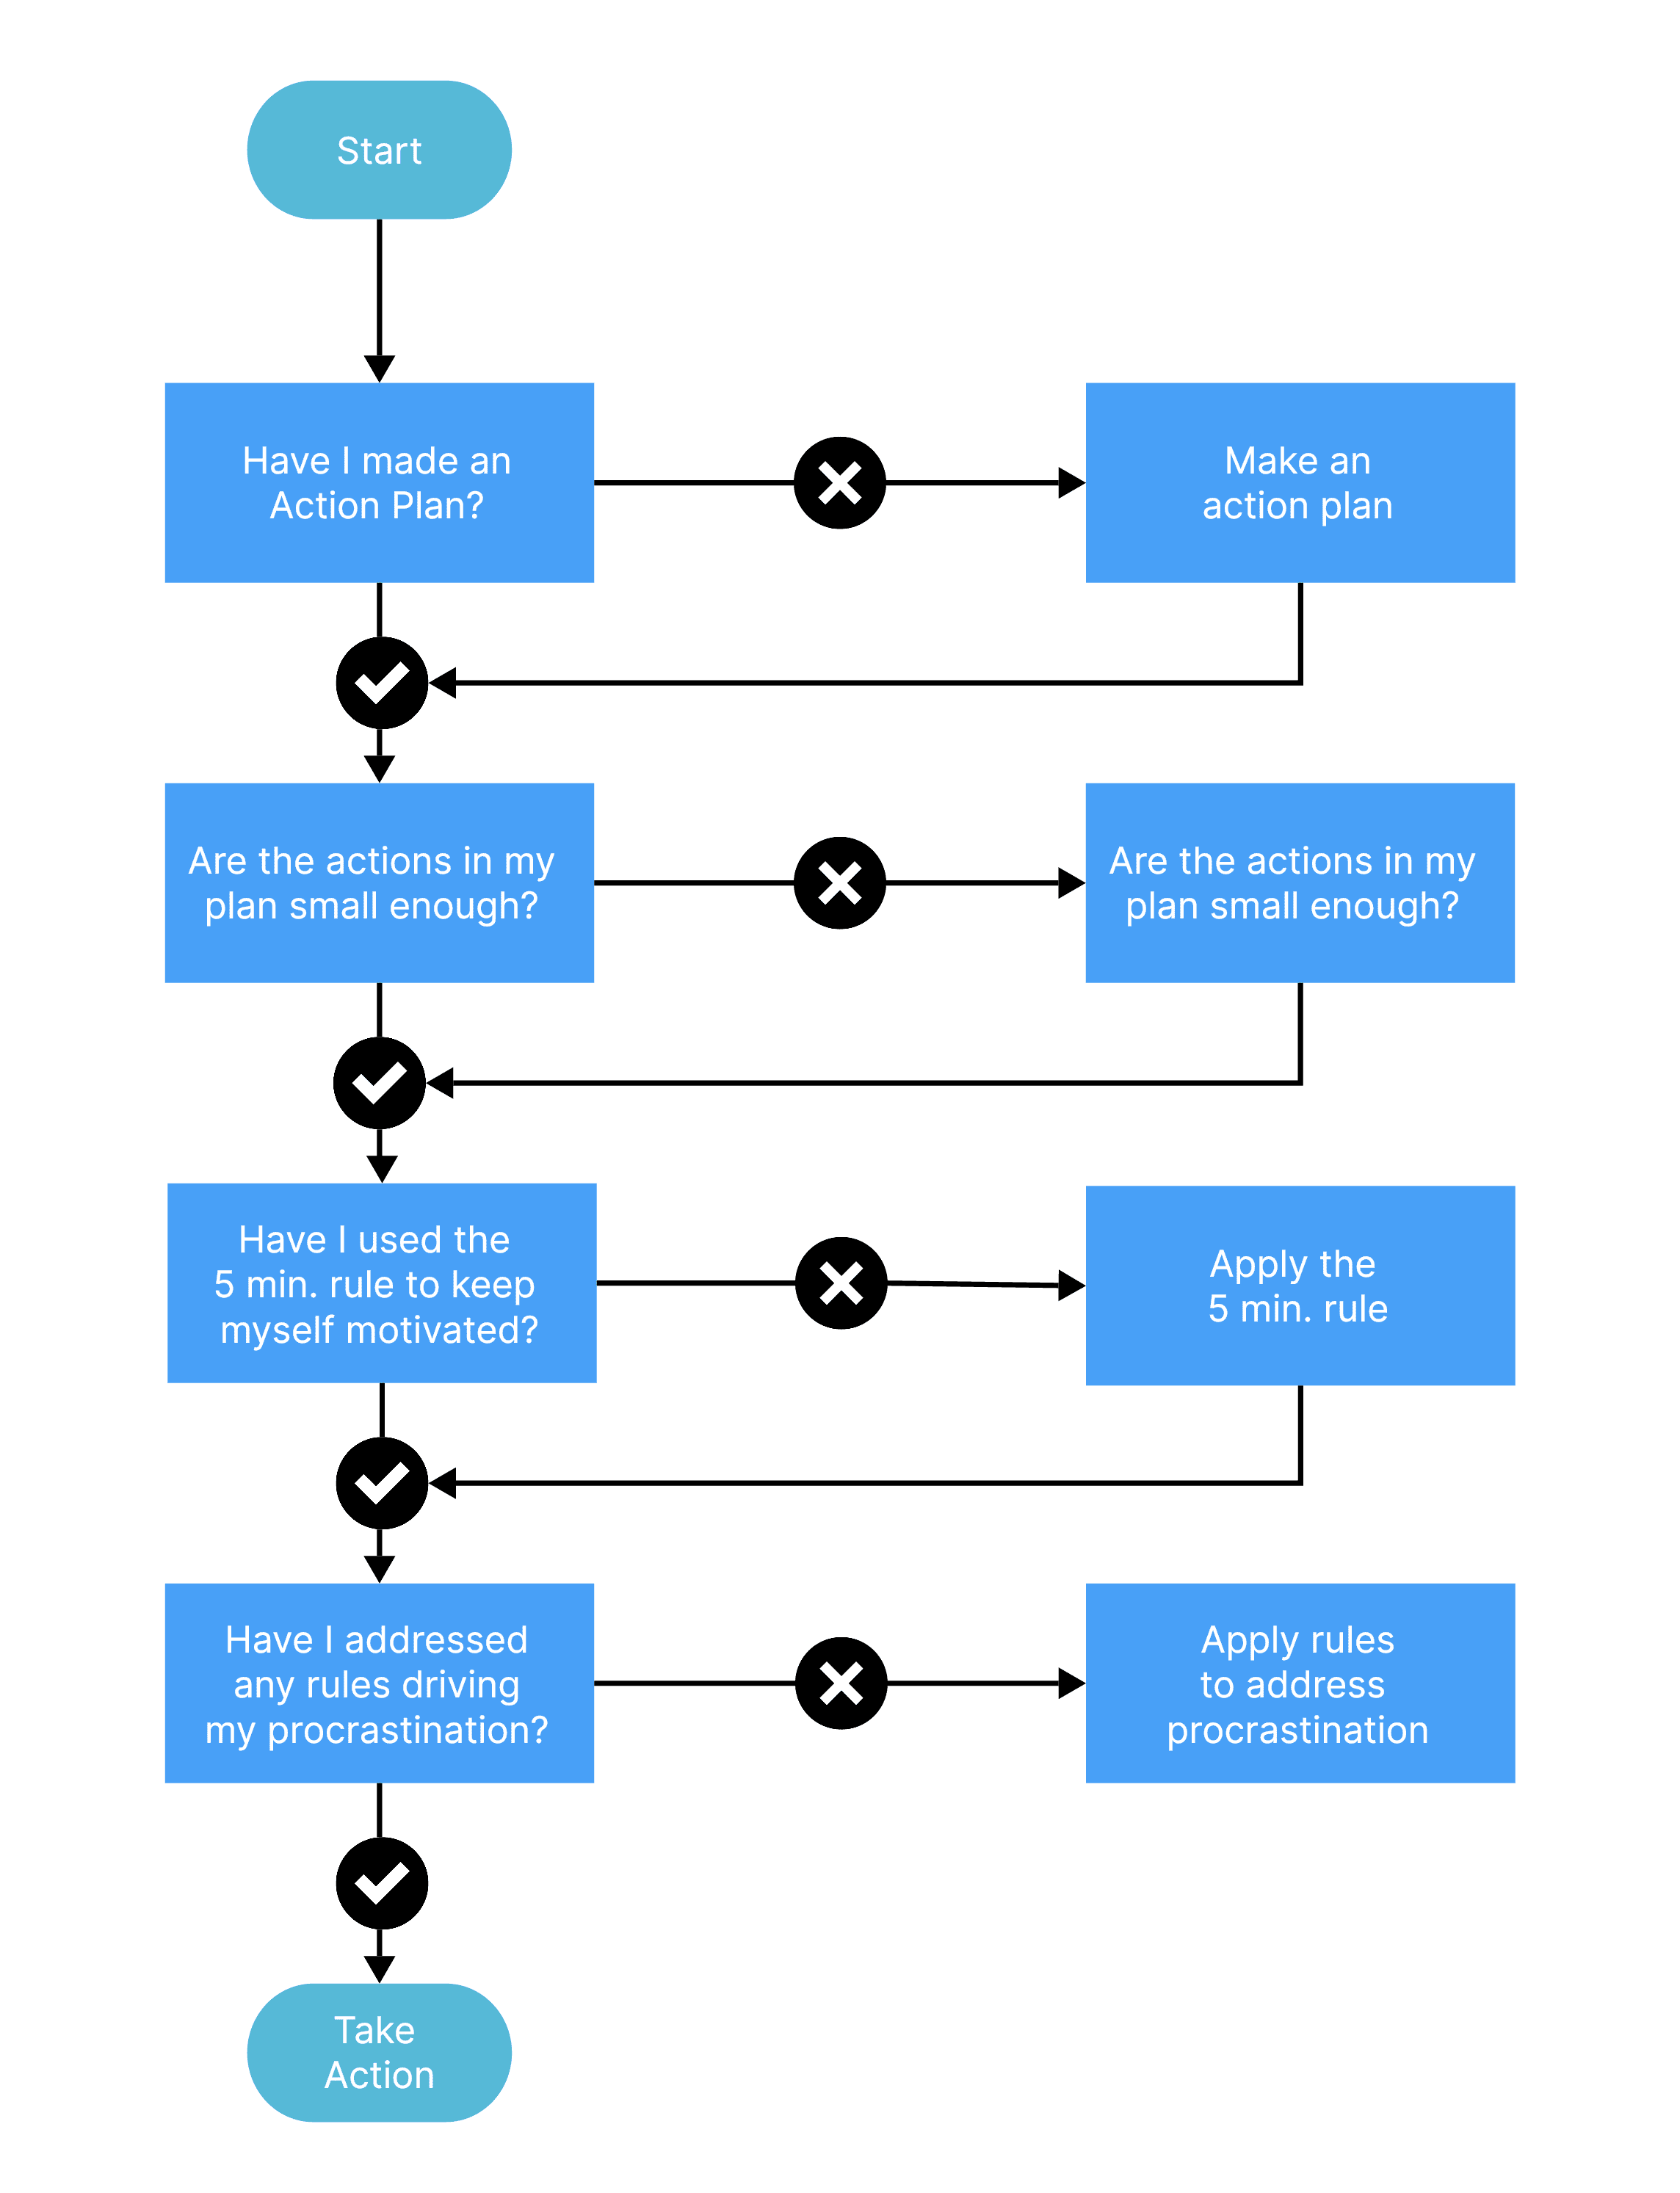
23. Action Plan Flowchart
If you find yourself with fewer words but more steps, consider using a flowchart example such as the one provided below. This can serve as a helpful starting point to outline your workflow. By following the flowchart, you can efficiently execute the action plan and make any necessary adjustments along the way.
24. Product Decision Tree
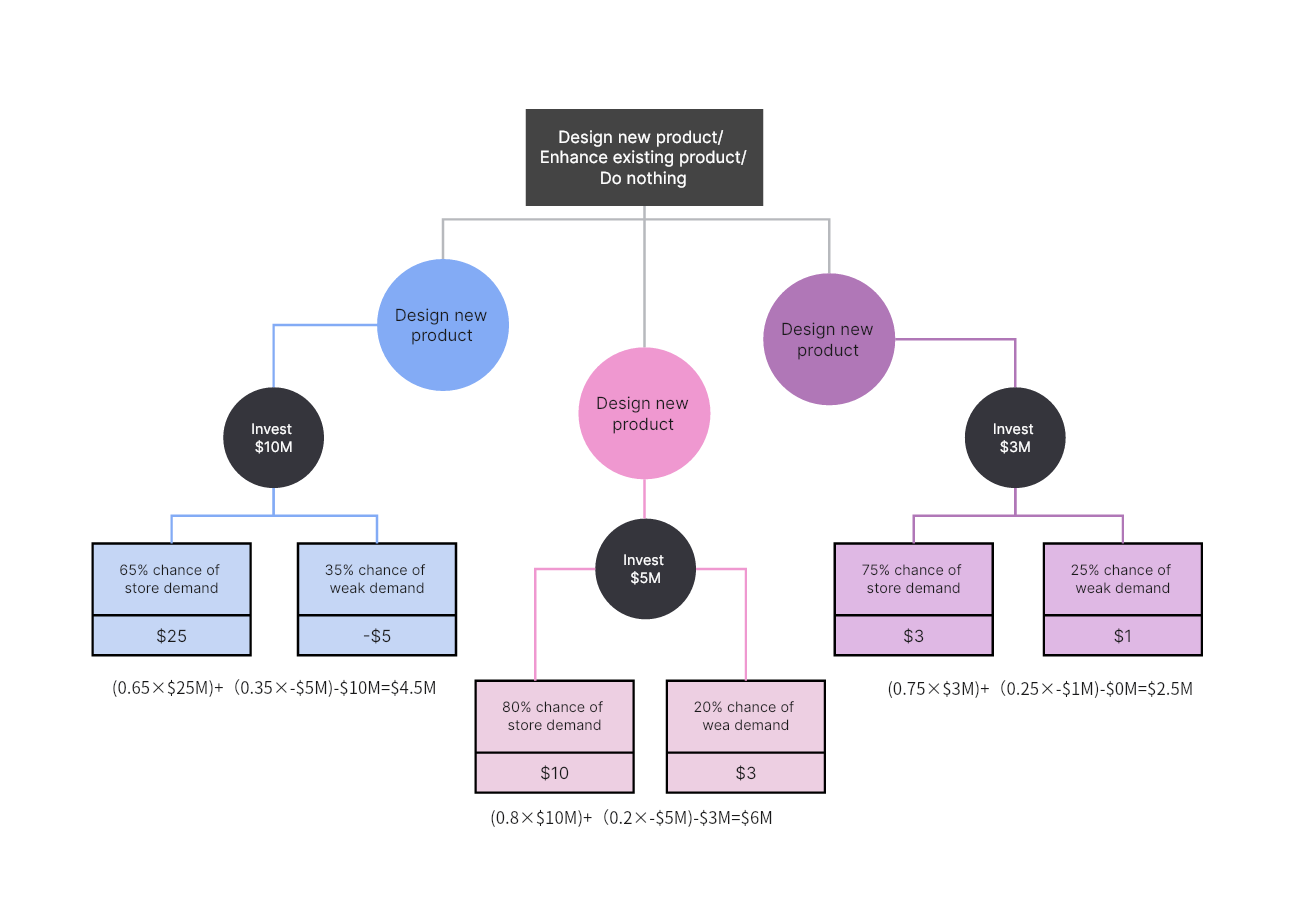
A flowchart can be used to break down a complex concept into smaller components. This could involve breaking down the various factors that contribute to a complete business spend, or projecting future earnings and budget. For instance, the following flowchart template depicts the return on investment for three options: Design new products, Enhance existing products, or Do nothing.
25. Communication Flowchart
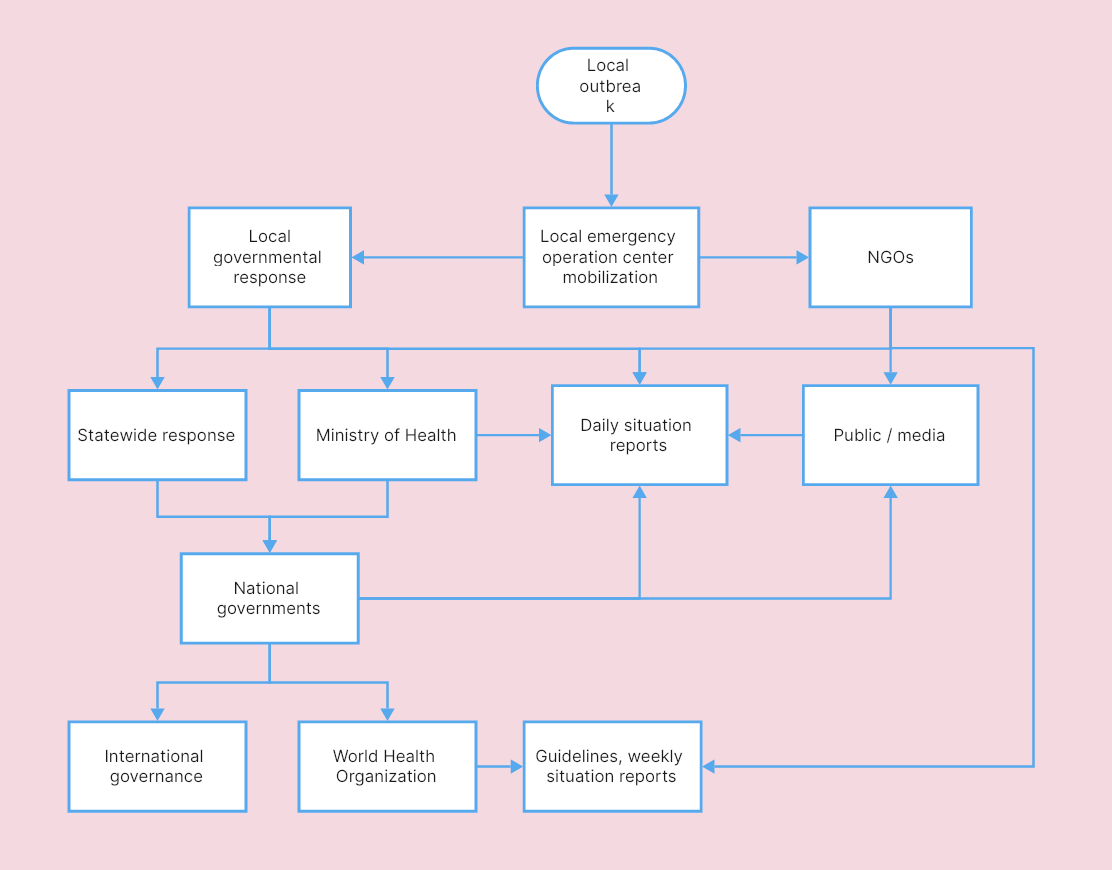
To encourage effective communication, it is crucial to ensure that individuals understand who should be involved, the roles they play, and the subsequent steps. The following example flowchart illustrates the various communication channels between different entities during a hypothetical public health crisis. Of course, you can customize the diagram to your specific scenario for seamless communication.
26. Construction Flowchart
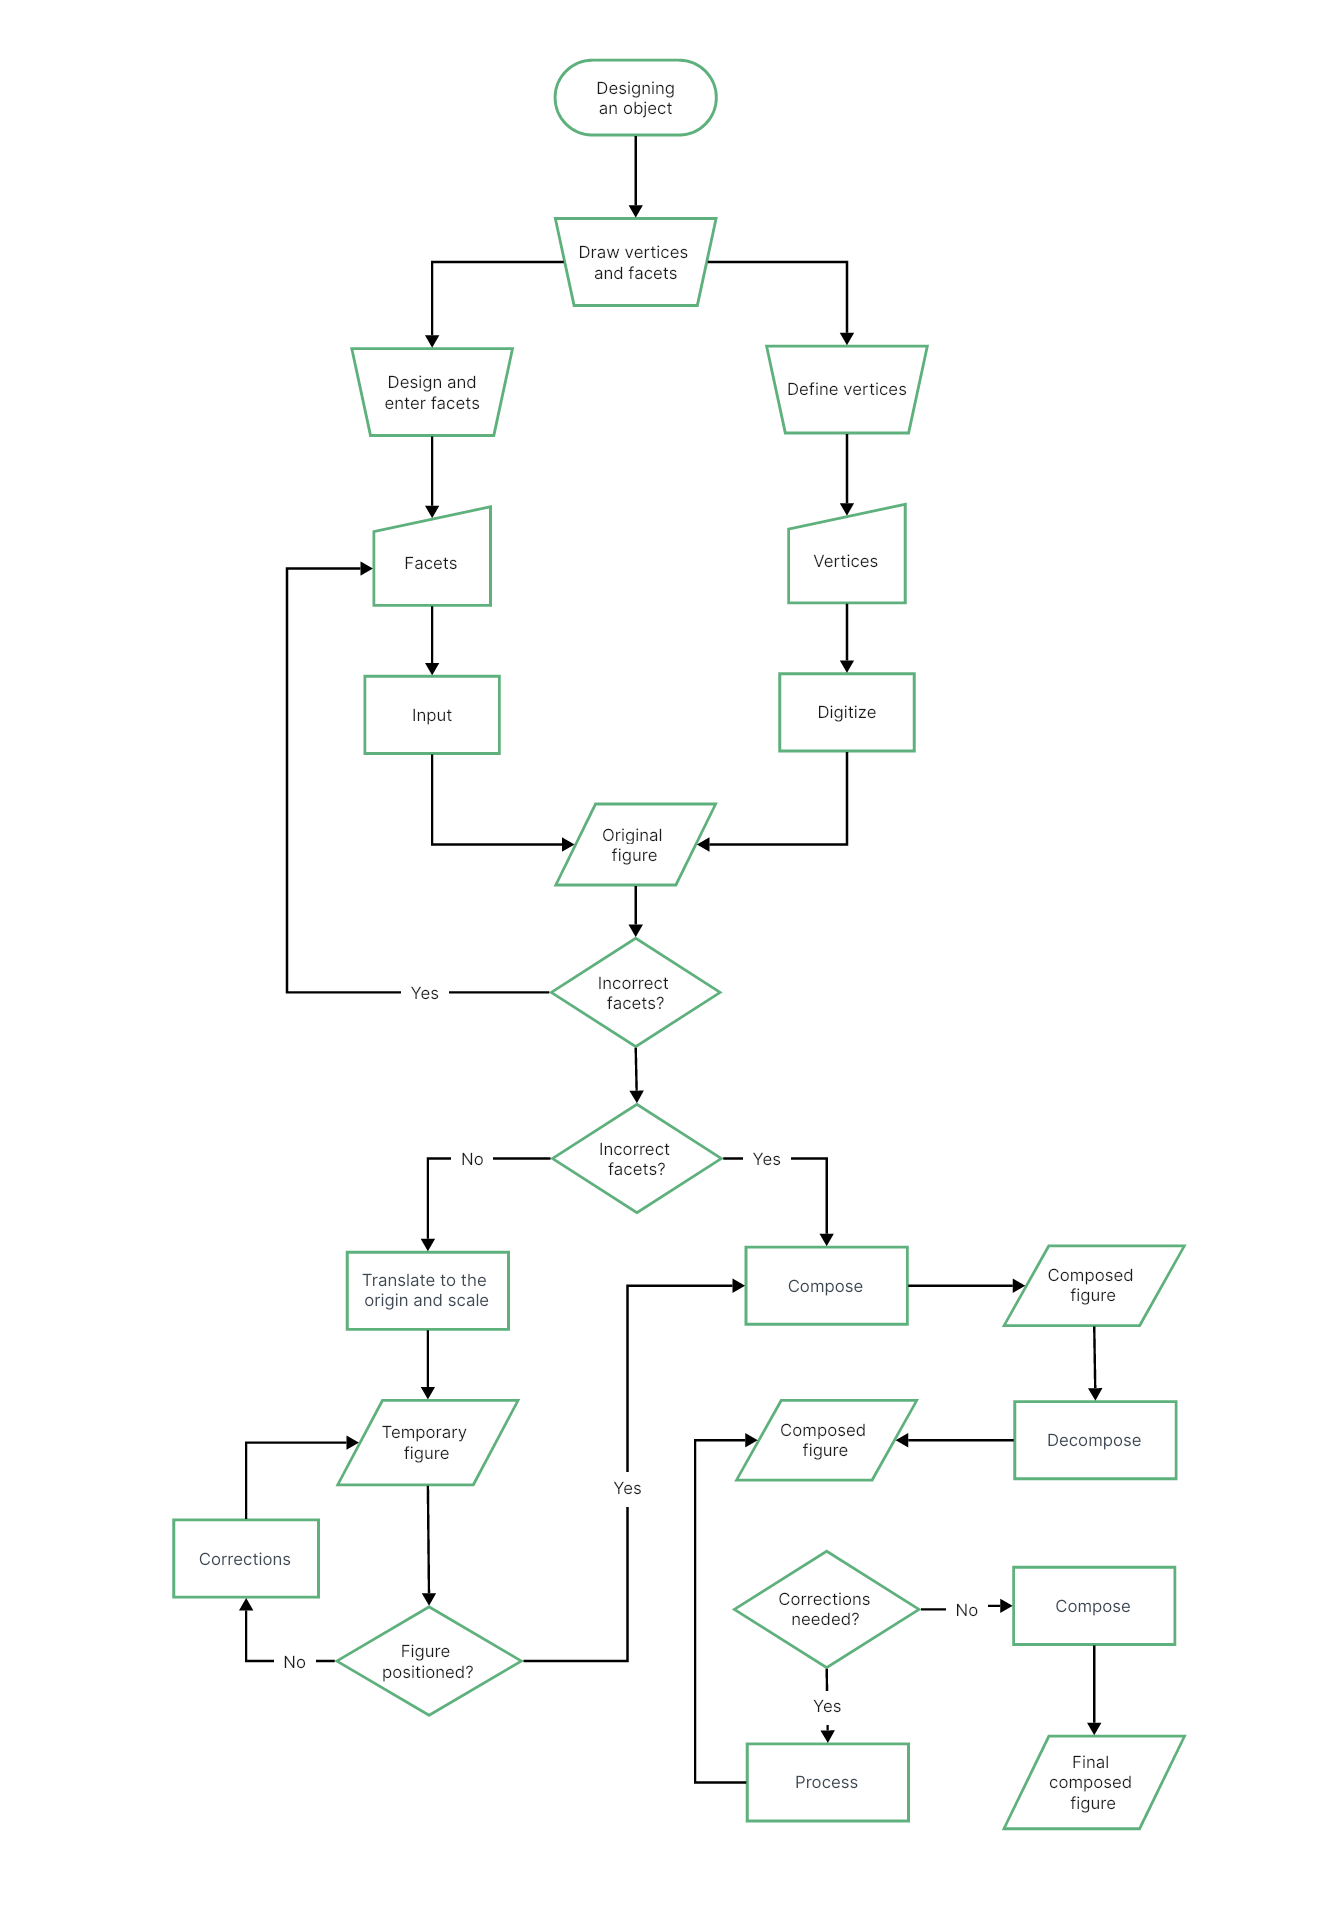
As demonstrated in this example, flowcharts prove invaluable in illustrating the various steps and potential outcomes required for the successful completion of a construction project. Feel free to personalize the construction flowchart template, encompassing interpersonal interactions and the most efficient methods to accomplish your specific project.
27. University Emergency Response Process Flowchart
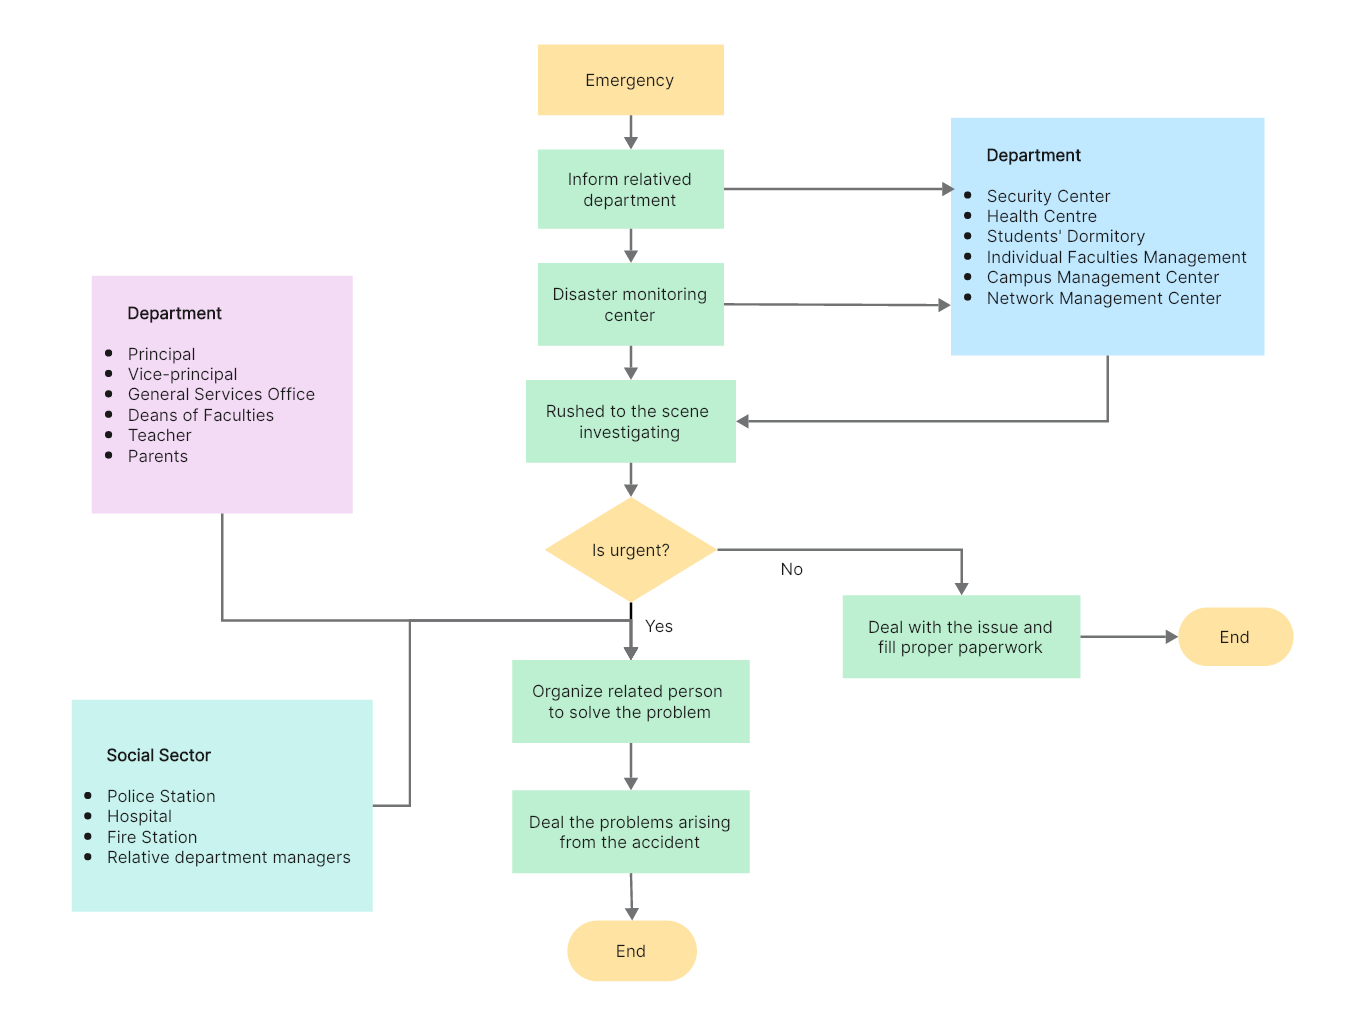
The Emergency Response Flowchart outlines the necessary steps to be taken when an emergency occurs, providing a clear and structured approach for responding effectively. By following these guidelines, universities can prioritize the safety and well-being of their students and employees while also minimizing the impact of emergencies.
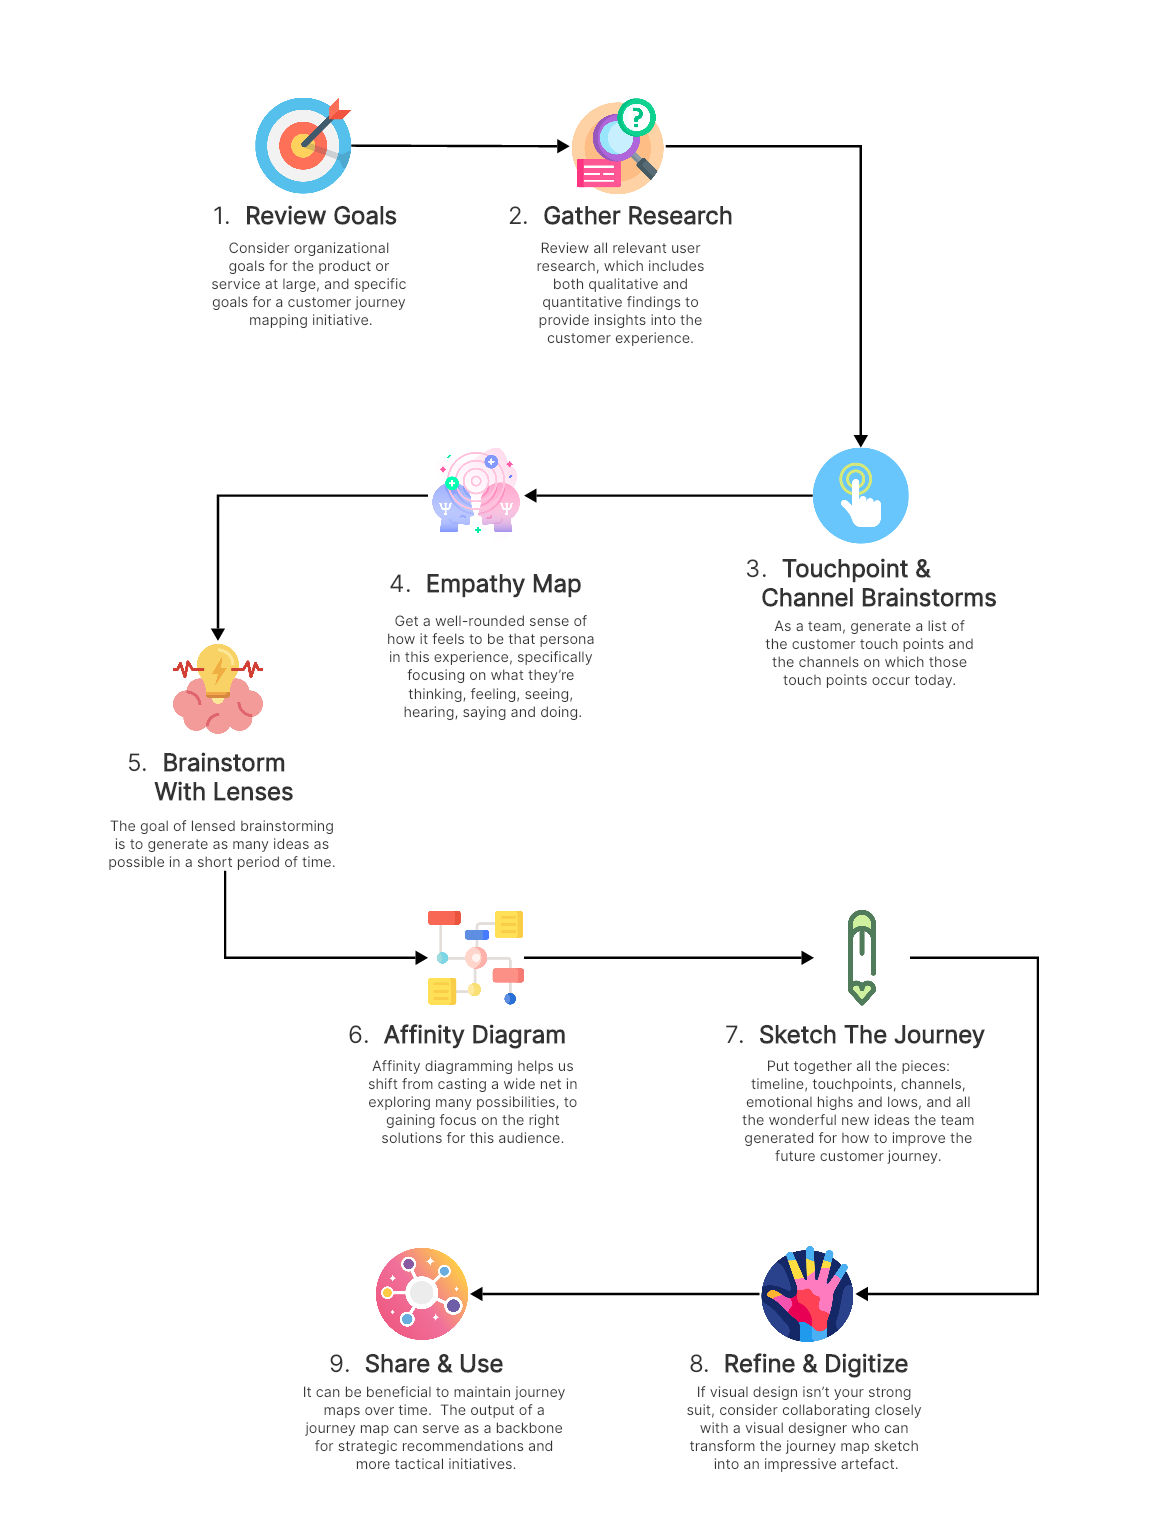
28. Customer Journey Map
A customer journey map is a visual story of a customer’s interactions with a company, allowing businesses to view their operations from the customer’s perspective, analyze different user scenarios, and identify areas for improvement. The map should be visually appealing, comprehensive, and customer-facing, having both statistical data and anecdotal insights. Customize this simple customer journey map to break down and enhance your understanding of the customers.
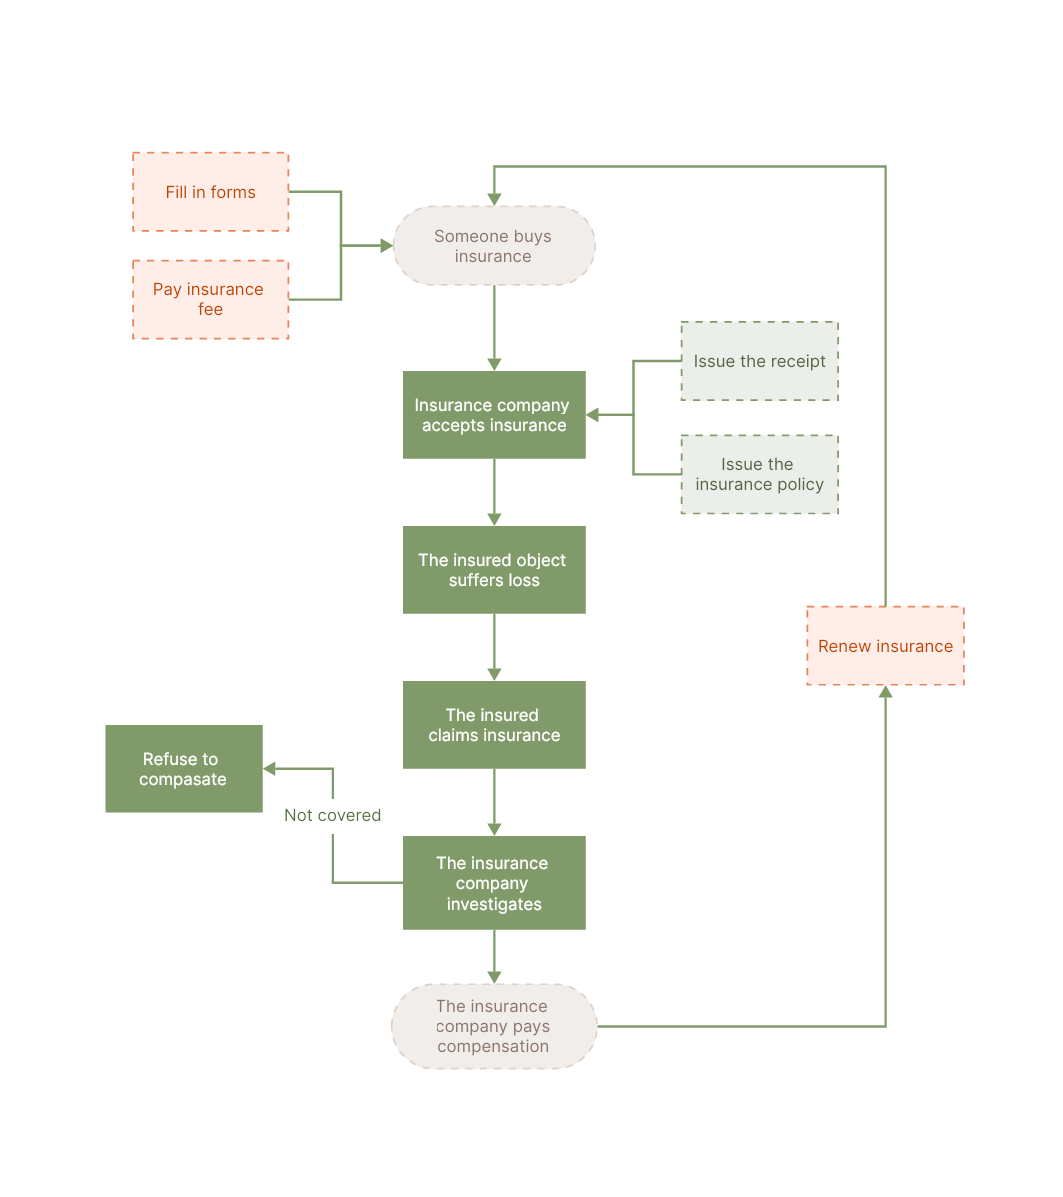
29. Insurance Claim Flowchart
The insurance claim flowchart outlines the process of purchasing an insurance policy and the subsequent steps to be taken in the event of a claim. It visually elaborates the whole process of an insurance claim, from insurance participation to the step of closing the case. The following flowchart example presents two potential outcomes: a) the insurance company refusing to compensate if the claim is not covered, and b) the insurance company providing compensation and renewing the insurance policy.
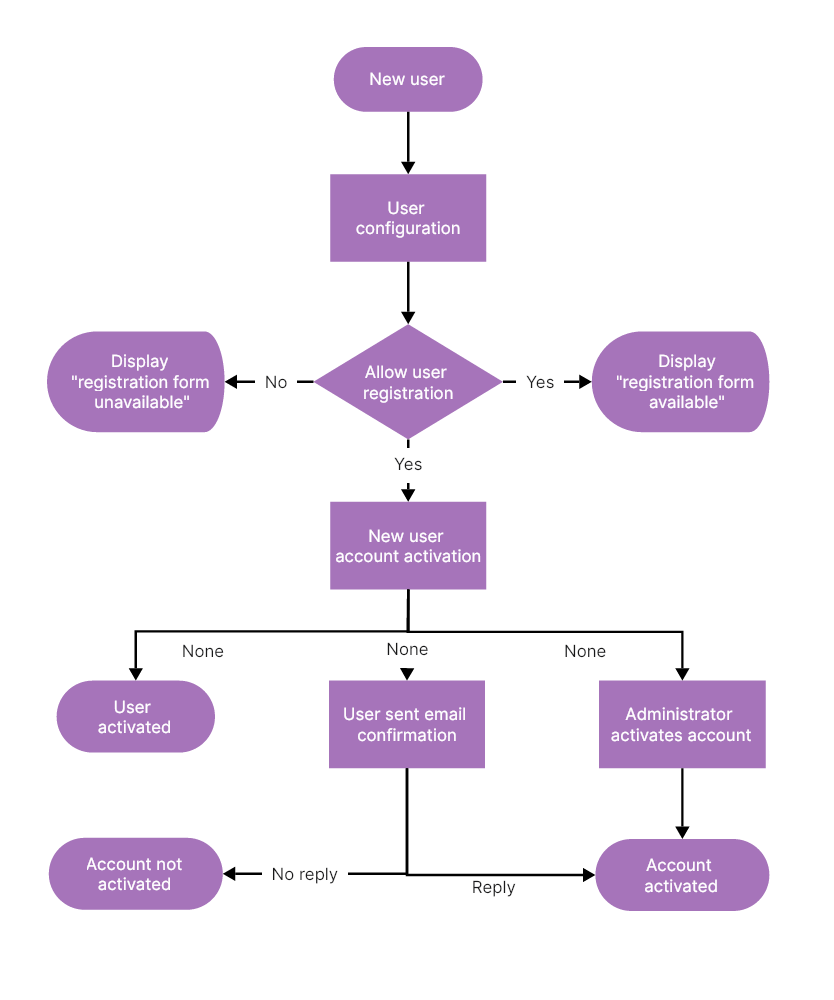
30. User Flowchart
A user flowchart illustrates the path a user will follow in an application to complete a task. Product teams build user flows to intuitive design products, present the right information to users at the right time, and streamline the completion of desired tasks with minimal steps. For instance, before developing a web or mobile app, it is essential to use a flowchart, as shown below, to visualize the user flow within the app first. By doing so, you can ensure your users have the best possible experience and increase the likelihood of user sign-ups.
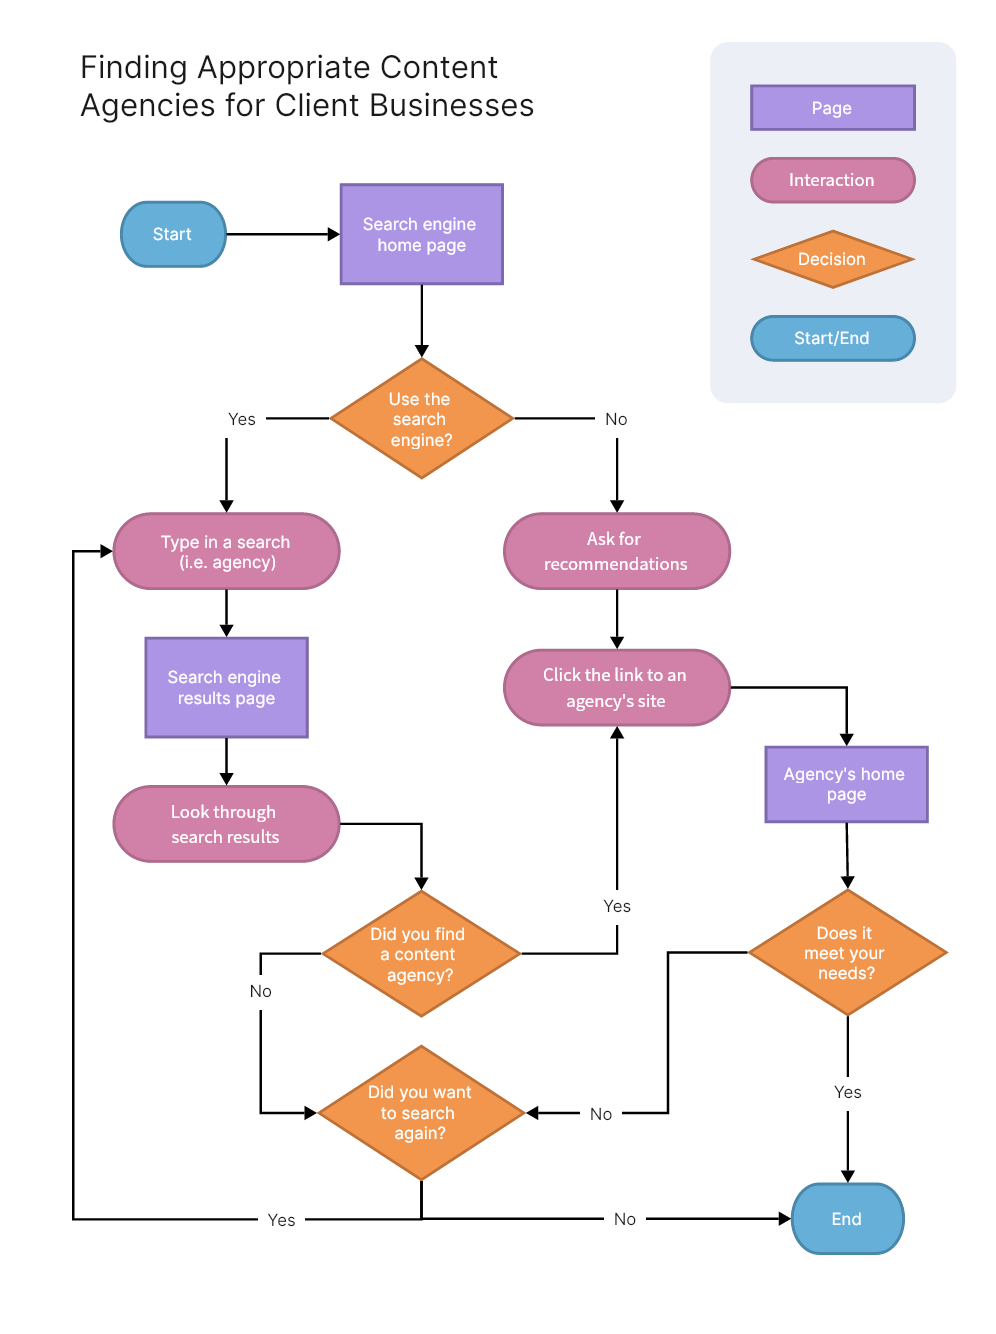
31. Task Flow Diagram
A task flow is designed to achieve a specific task in a streamlined and straightforward manner. It could involve signing up for a service or adding an item to a user’s cart. Task flows are useful in situations where data analytics have shown that users face difficulties in completing specific tasks. Here is an example of a task flow that illustrates the process of finding content agencies for client businesses. By following these steps, you can locate a content agency that understands your client’s business, delivers high-quality content, and contributes to their marketing success.
FAQs About Flowcharts
What are the basic flowchart rules?
There are a few key rules for all flowcharts:
- Always format your flow from left to right or top to bottom.
- Avoid any looping or bi-directional flow.
- Use the correct flowchart symbols for each specific purpose.
- Every decision point should have at least two outgoing arrows representing the different paths the process can take based on the decision.
- Keep the flowchart as simple and clear as possible.
What are the 5 basic symbols of a flowchart?
The various shapes used in a flowchart are referred to as flowchart symbols, each carrying its own meaning and context for appropriate usage. Below are the five basic flowchart symbols that are commonly used in almost every flowchart.
- The flowline shows the sequence of the steps and the relationships among them.
- The oval or pill shape represents the start or end.
- The rectangle shape represents a step in the process.
- The diamond shape represents a decision. It’s usually a true/false decision or a yes/no question that you need to answer.
- The parallelogram represents data input or output.


