


Venn Diagrams are a powerful tool for visualizing the relationships between different sets or groups of data. While two and three-circle diagrams are common, four-circle Venn Diagrams provide a more intricate view of the interrelationships between four sets of data. This article delves into the understanding of four-circle Venn Diagrams and discusses how they differ from other Venn Diagrams with real-world examples! Keep reading!
Understand 4-Circle Venn Diagrams
4-circle Venn diagrams allow for a more complex examination of interrelatedness between sets. They contain sixteen regions, each representing a possible intersection or disjointedness between four different sets.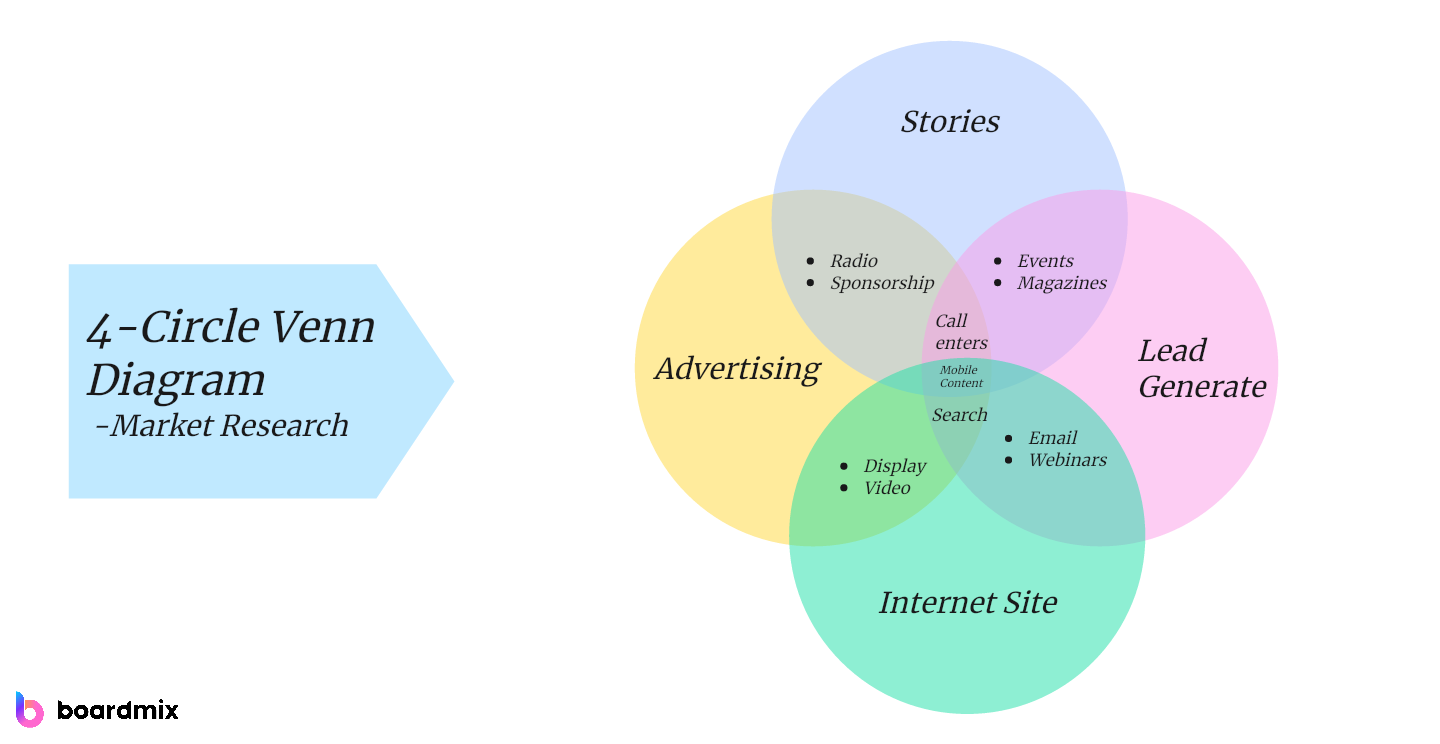
Creating a 4-circle Venn diagram involves four overlapping circles, each representing a unique set. The intersection points of these circles show common elements between the sets.
In the context of a 4-circle Venn diagram:
- Where no circles intersect, it shows elements not belonging to any of the sets.
- Where two circles intersect, it illustrates the common elements between two sets.
- Where three circles intersect, it denotes common elements among three sets.
- Where all four circles intersect, it represents elements common to all four sets.
Differences between 4-Circle Venn Diagrams and Others
Venn diagrams are crucial for visually representing and analyzing relationships between different sets. Based on the number of sets being compared, Venn diagrams can be categorized into 2-circle, 3-circle, or 4-circle diagrams. However, each one offers a unique perspective and level of complexity. Here are some differences between them.
- Number of Sets Represented
The first and most fundamental difference lies in the number of sets that each type of diagram can represent.
- 2-Circle Venn Diagrams: As the name suggests, these diagrams depict relationships between two sets.
- 3-Circle Venn Diagrams: These diagrams represent relationships among three distinct sets.
- 4-Circle Venn Diagrams: These more complex diagrams represent relationships among four sets.
- Complexity and Depth of Analysis
The complexity of the diagram and depth of the analysis can increase with the number of circles used.
- 2-Circle Venn Diagrams: These provide a basic comparison of two groups with three possible areas – one for each set and one shared.
- 3-Circle Venn Diagrams: These allow a comparison among three sets with seven potential areas.
- 4-Circle Venn Diagrams: These offer a more complex comparison with four sets having sixteen possible areas representing all potential overlaps.
- Suitability and Usage
The choice between these diagram types depends on the needs of the comparison or analysis.
- 2-Circle and 3-Circle Venn Diagrams: Due to their simplicity, they are frequently used in primary and secondary education for teaching set theory, problem-solving, logic, and critical thinking. They also find usage in presentations to compare products or concepts.
- 4-Circle Venn Diagrams: Due to their complexity, they are primarily used in higher education and professional settings, particularly for advanced data analysis and decision-making processes involving multiple variables.
While all types of Venn diagrams serve to visually represent the relationships between different sets, the choice between a 2-circle, 3-circle, or a 4-circle Venn diagram will depend on the complexity of the data sets and the depth of analysis required.
5 Real-World Applications of 4-Circle Venn Diagrams
4-circle Venn diagrams are an exceptional tool that enables intricate comparison and representation of relationships among four sets of data. While these diagrams might seem complex, they find practical use in various real-world applications, providing vital insights for decision-making. Here are five real-world applications where 4-circle Venn Diagrams can be utilized.
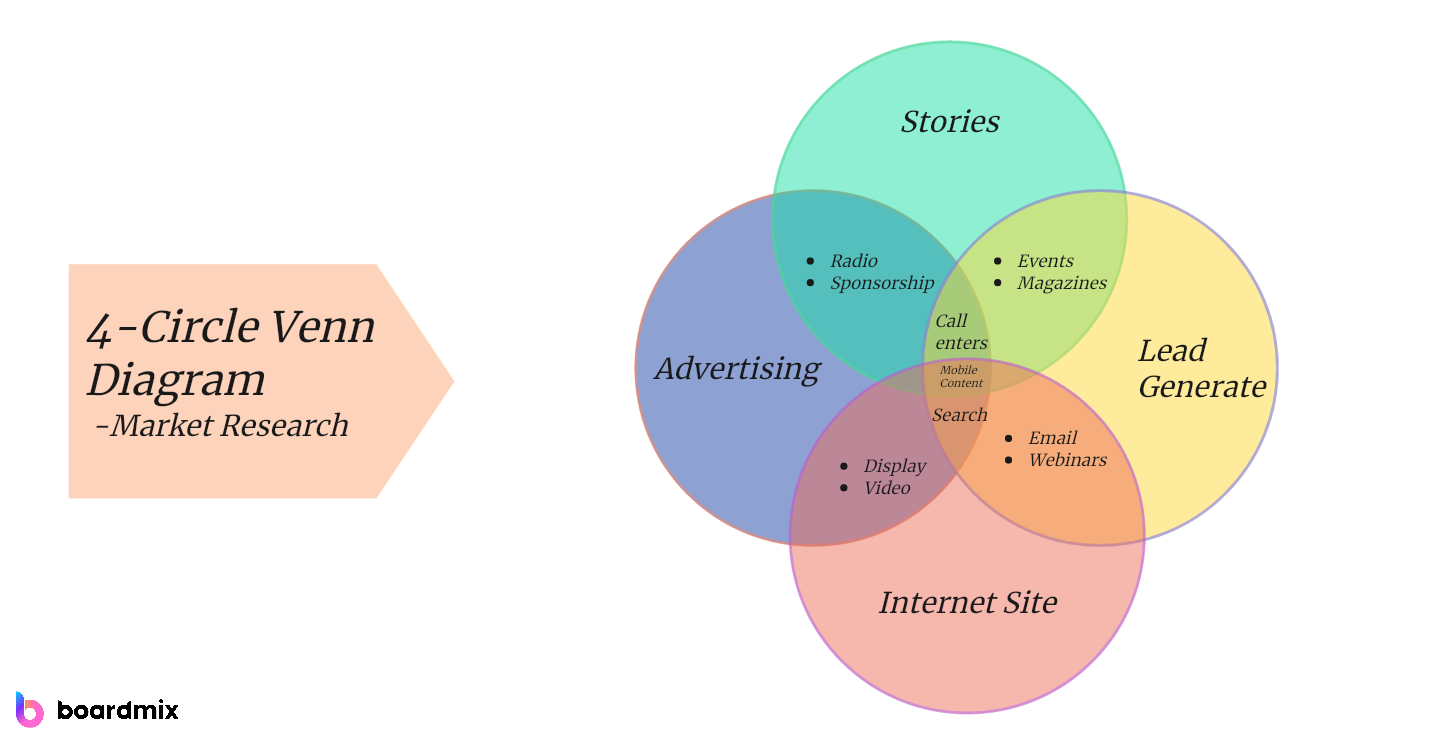
1. 4-Circle Venn Diagram in Market Research
In market research, 4-circle Venn diagrams can be utilized to compare and analyze four different market segments based on various criteria like age, income level, buying behavior, and location. This enables researchers to identify overlapping interests and behaviors, informing marketing strategies.
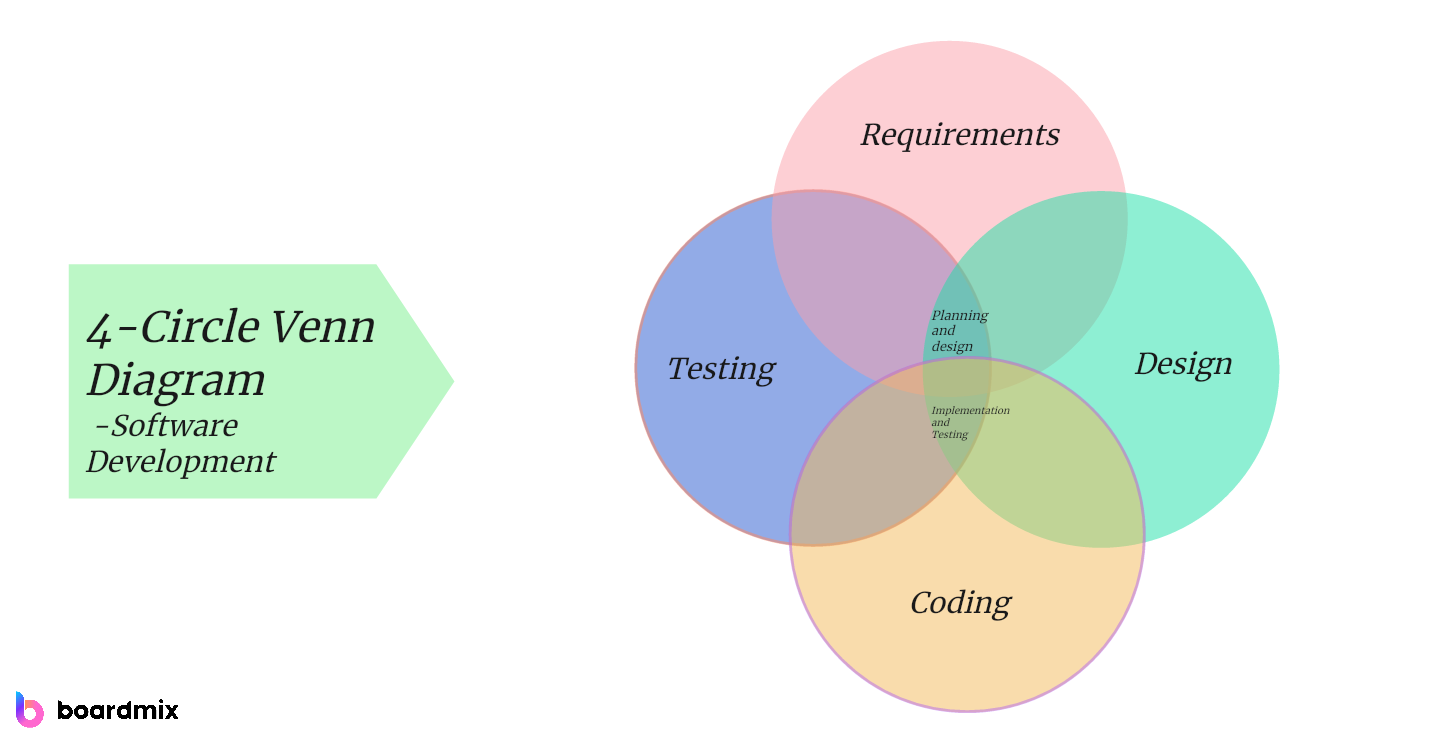
2. 4-Circle Venn Diagram in Software Development
Software developers often use 4-circle Venn diagrams when comparing different software solutions. They can present features, compatibility, cost, and user reviews of four software solutions, enabling an informed decision on the most suitable software to adopt or develop.
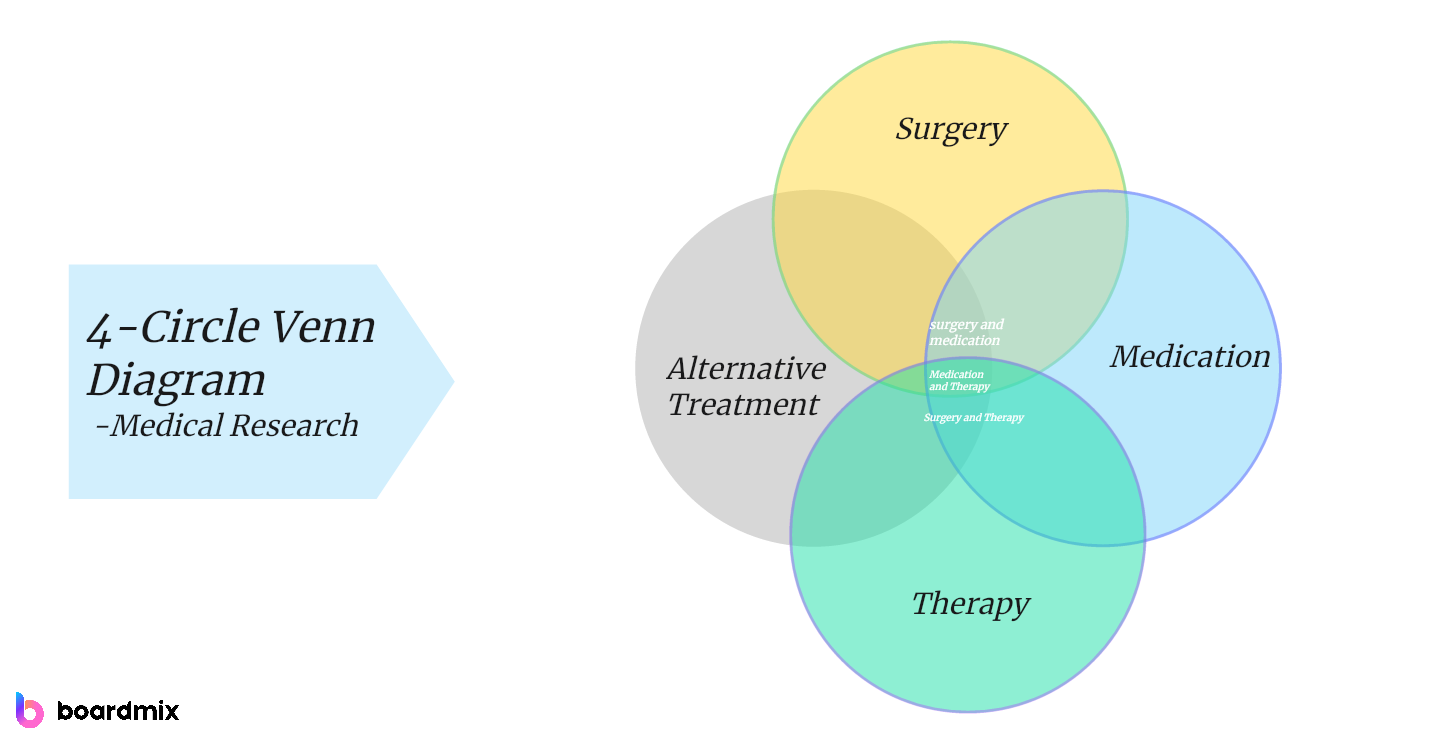
3. 4-Circle Venn Diagram in Medical Research
In the medical field, 4-circle Venn diagrams assist in comparing the effectiveness of four different treatment options on varied parameters like success rate, side effects, cost, and recovery time. It aids medical professionals in identifying the best treatment protocol.
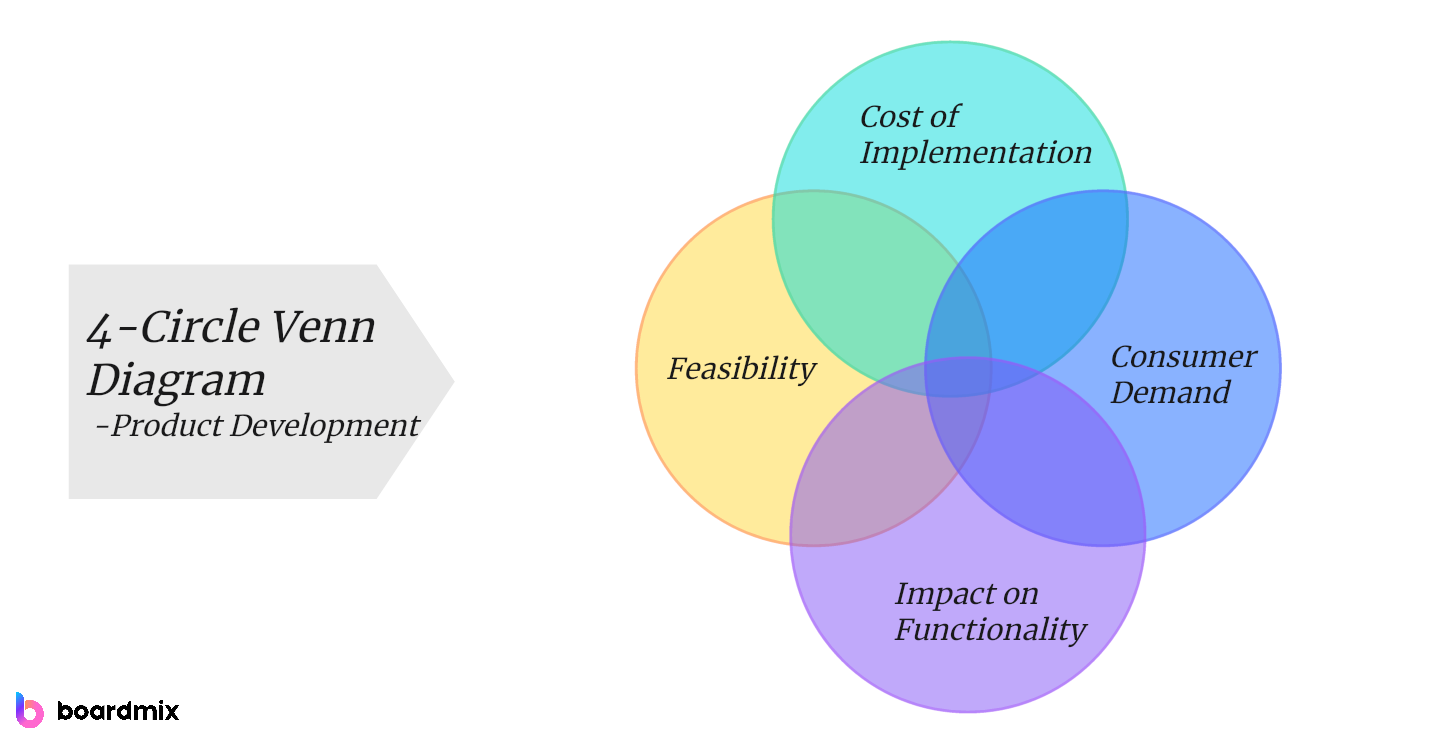
4. 4-Circle Venn Diagram in Product Development
During product development, a 4-circle Venn diagram can help in comparing four different potential features of a new product based on parameters like cost of implementation, consumer demand, impact on product functionality, and feasibility. This aids in prioritizing features for inclusion in the final product design.
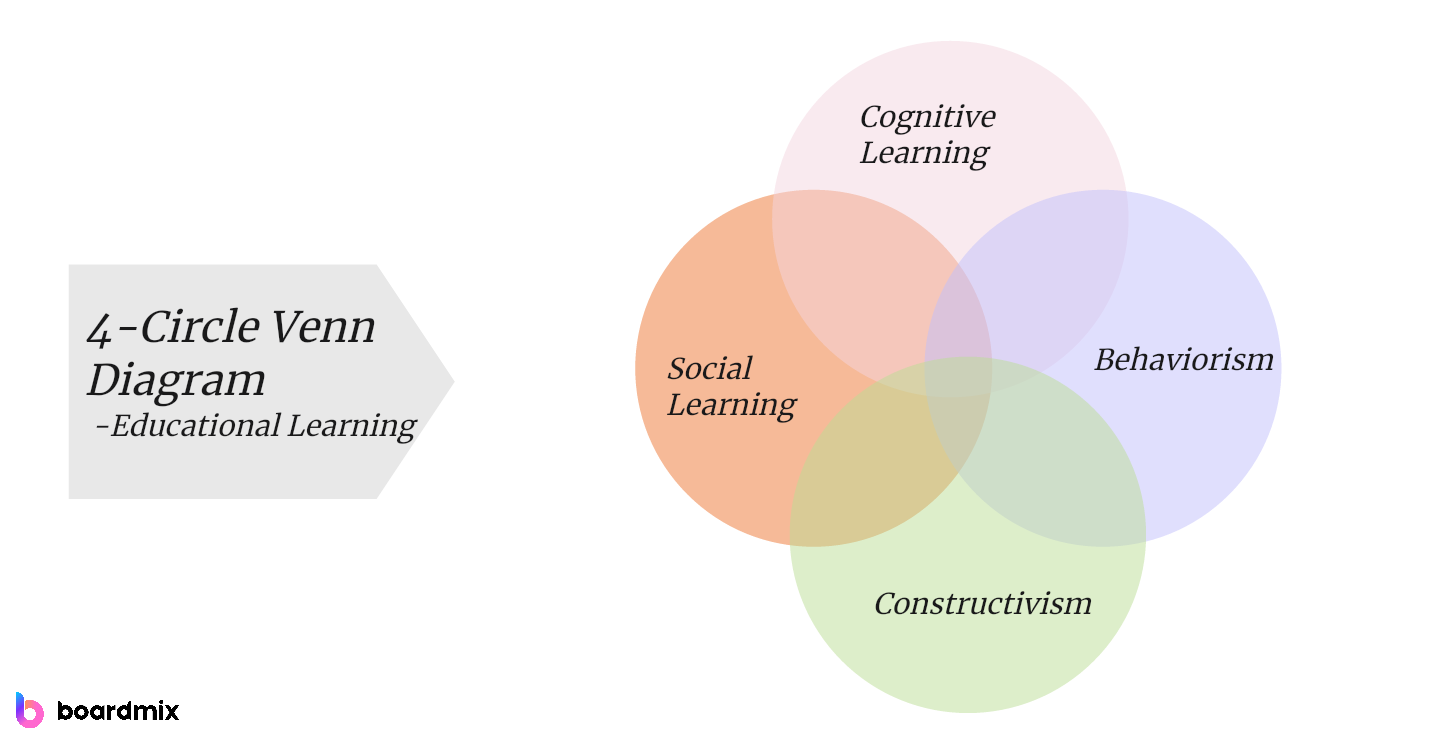
5. 4-Circle Venn Diagram in Educational Learning
In education, particularly in higher studies, 4-circle Venn diagrams can be employed to compare and contrast four different theories or concepts. It provides students with a visual guide to understand the commonalities and differences among the theories or concepts, aiding their comprehension and retention.
The versatility and functionality of the 4-circle Venn diagrams make them a preferred tool in multiple fields when intricate analysis of multiple data sets is required.
Guide on Creating a 4-Circle Venn Diagram
The use of 4-circle Venn diagrams is an efficient way to represent and analyze complex relationships between four data sets. With the aid of online tools like Boardmix, creating such diagrams becomes a seamless process.
Boardmix is a powerful online tool for creating and sharing visual content, including Venn diagrams. Its interactive, user-friendly interface allows even novices to generate professional-looking diagrams. Boardmix's flexible toolset lets users customize their diagrams for optimal clarity and presentation, making it a favorite among educators, researchers, marketers, and more.
Follow this step-by-step guide to creating your 4-circle Venn diagram using Boardmix:
Step 1: Register or Login
Begin by visiting the Boardmix website. If you're a new user, register for a free account. If you're already registered, log in with your credentials.

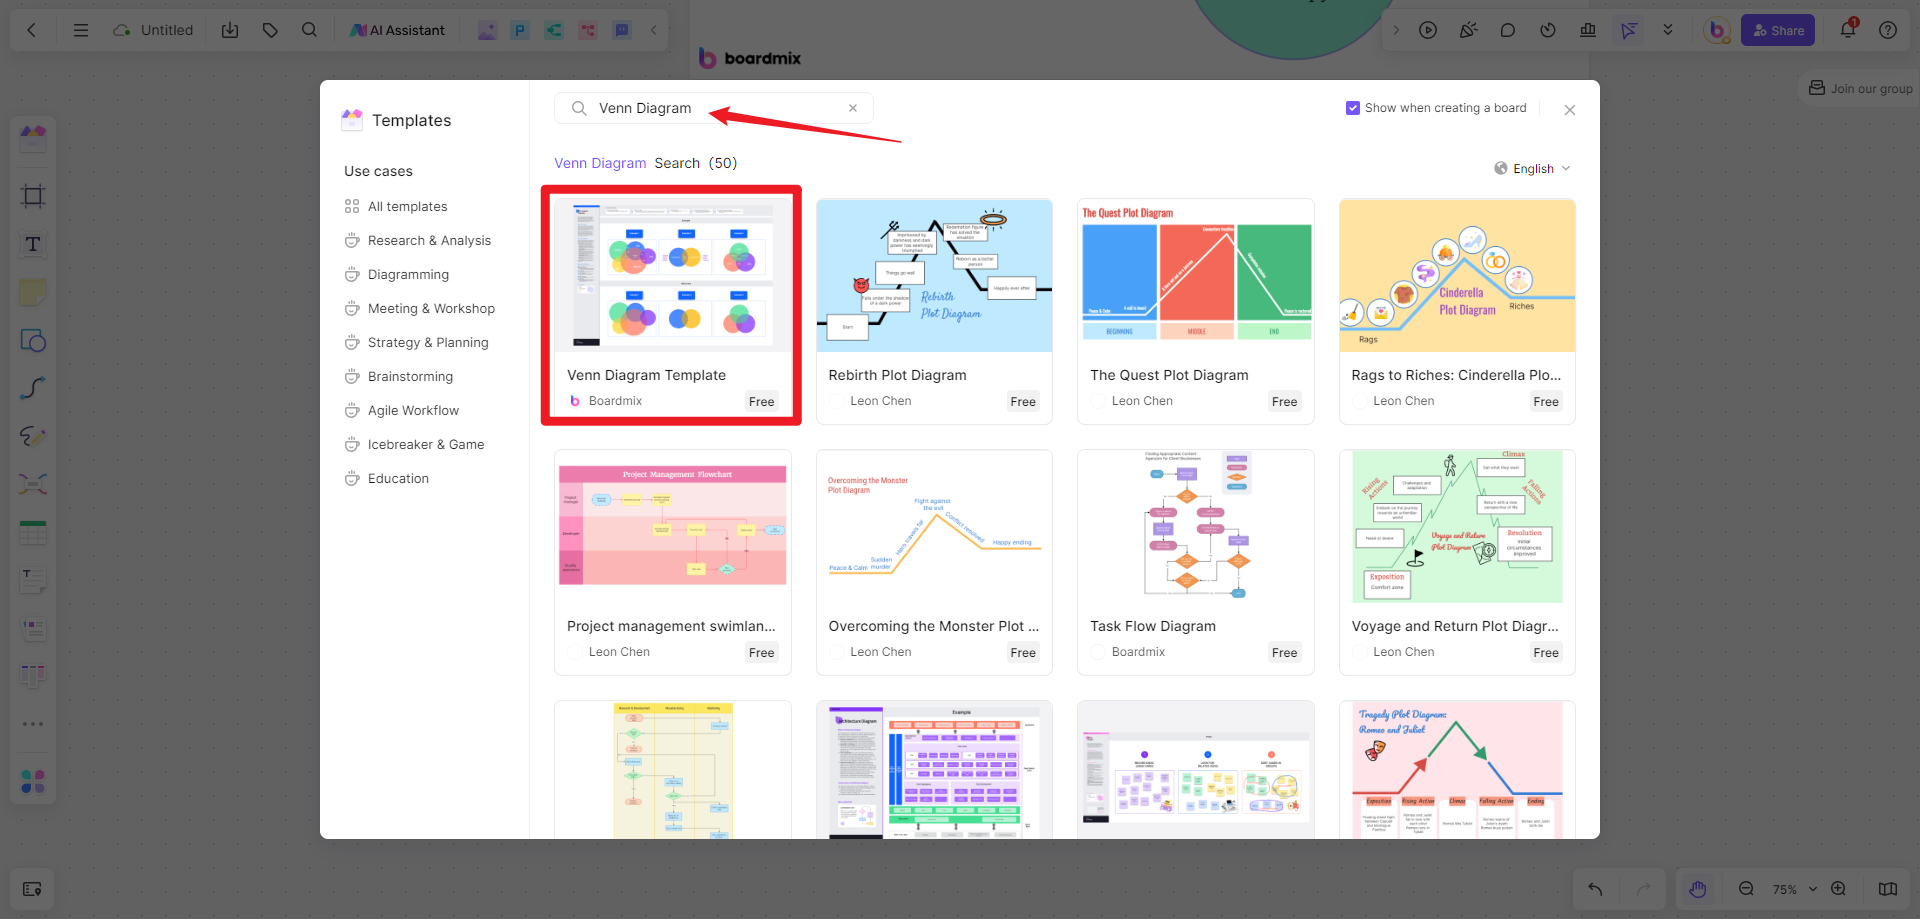
Step 2: Use the Venn Diagram Template
Once you're logged in, click on the “Templates” from the left panel and search "Venn Diagram" from direct use.
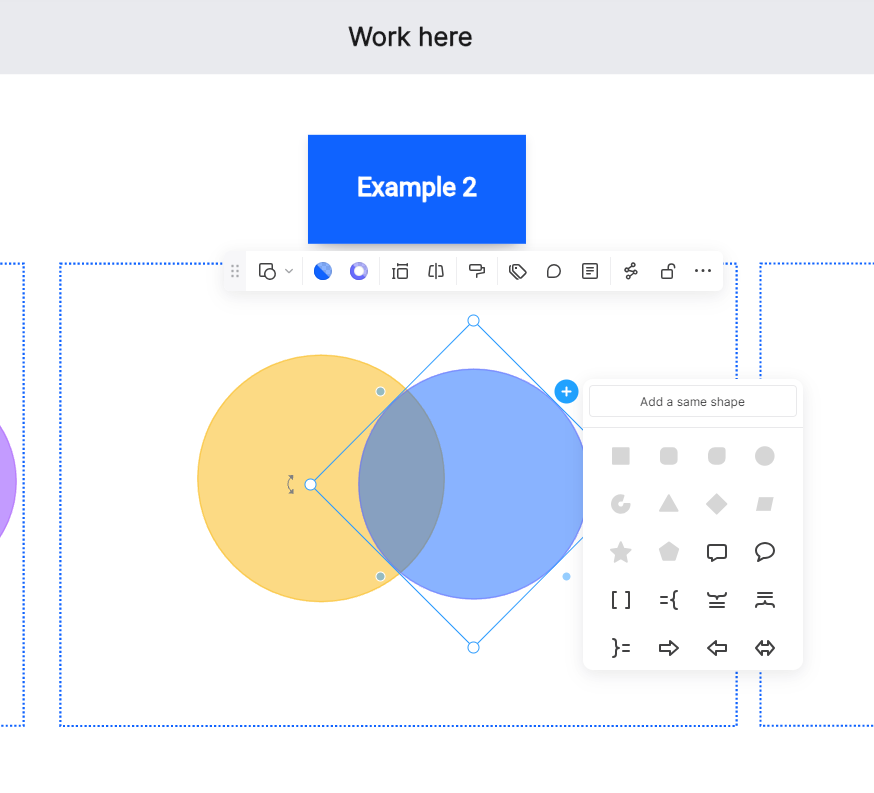
Step 3: Add Circles to Your Diagram
By default, Boardmix provides two circles for your diagram. Click on the plus sign to get four circles on your canvas.
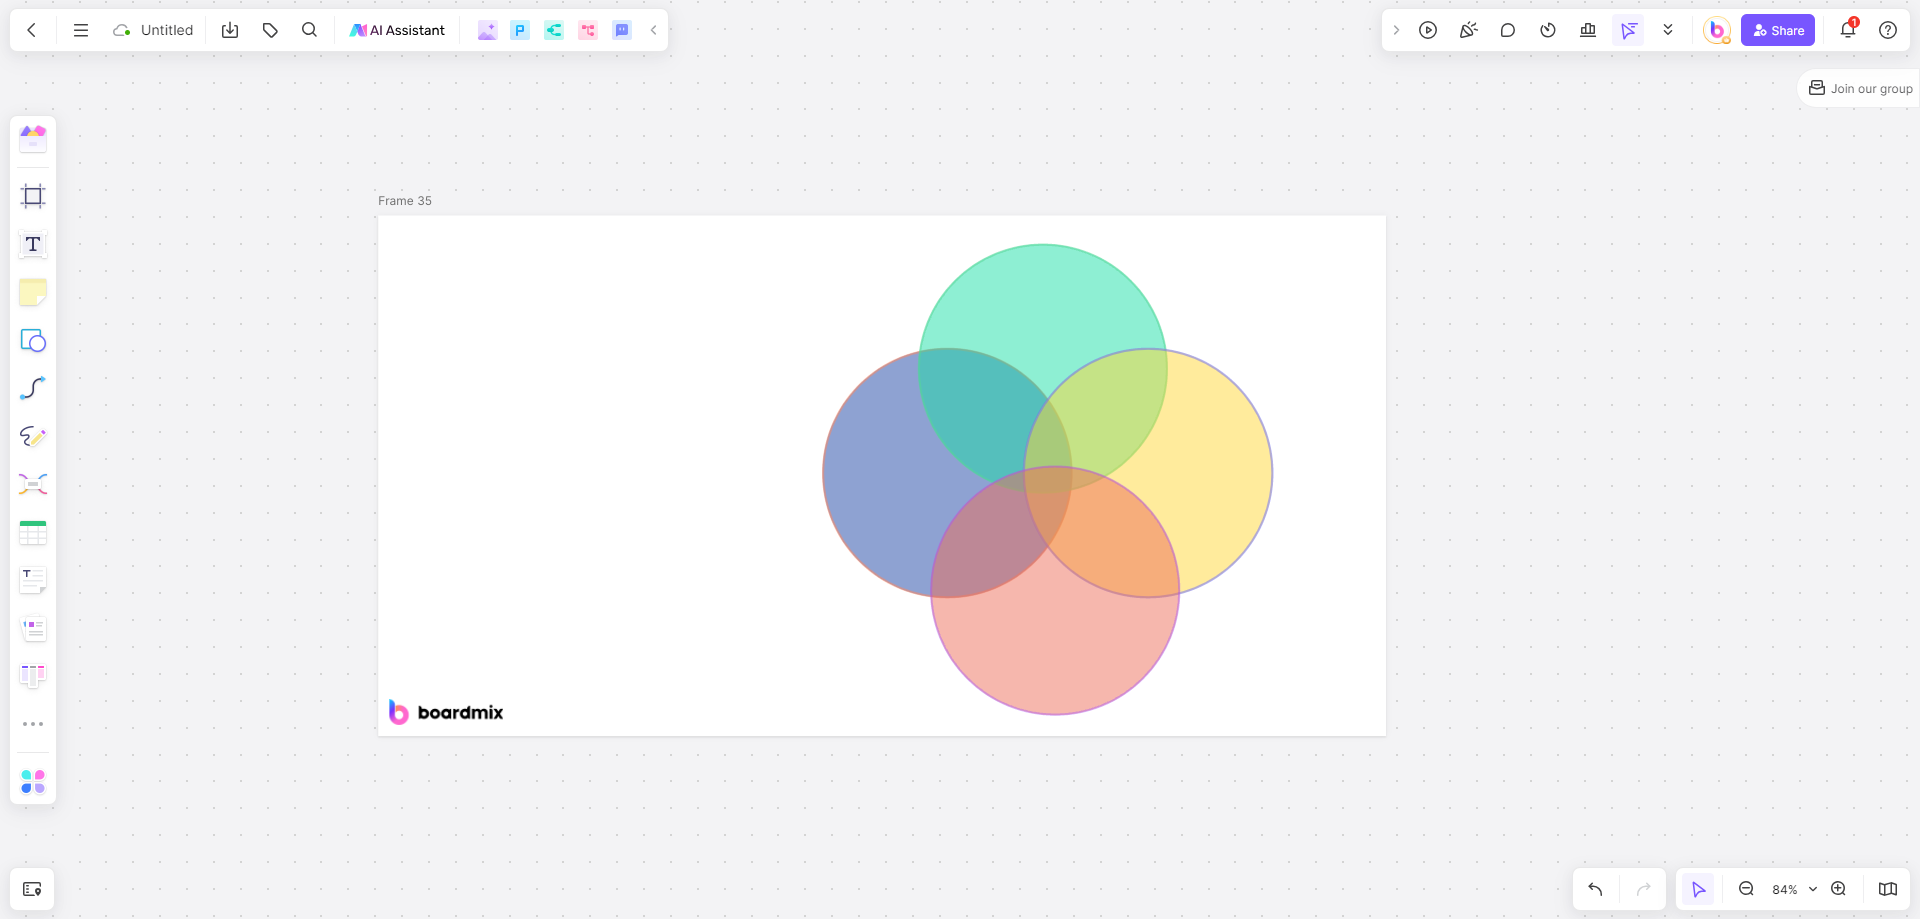
Step 4: Adjust the Size and Position of Your Circles
Resize and position your circles by clicking and dragging them across the canvas. The areas where the circles overlap will form the intersection sets of your Venn diagram.
Step 5: Label Your Circles
Next, use the text tool to add labels to your circles. Each label should represent a different set in your diagram.
Step 6: Add Data to Your Diagram
Click on each area of overlap (or non-overlap) in your diagram and type in the corresponding information or data. You can add as much detail as necessary for each section.
Step 7: Customize Your Diagram
Customize the colors, fonts, and sizes to suit your taste or to meet specific presentation requirements.
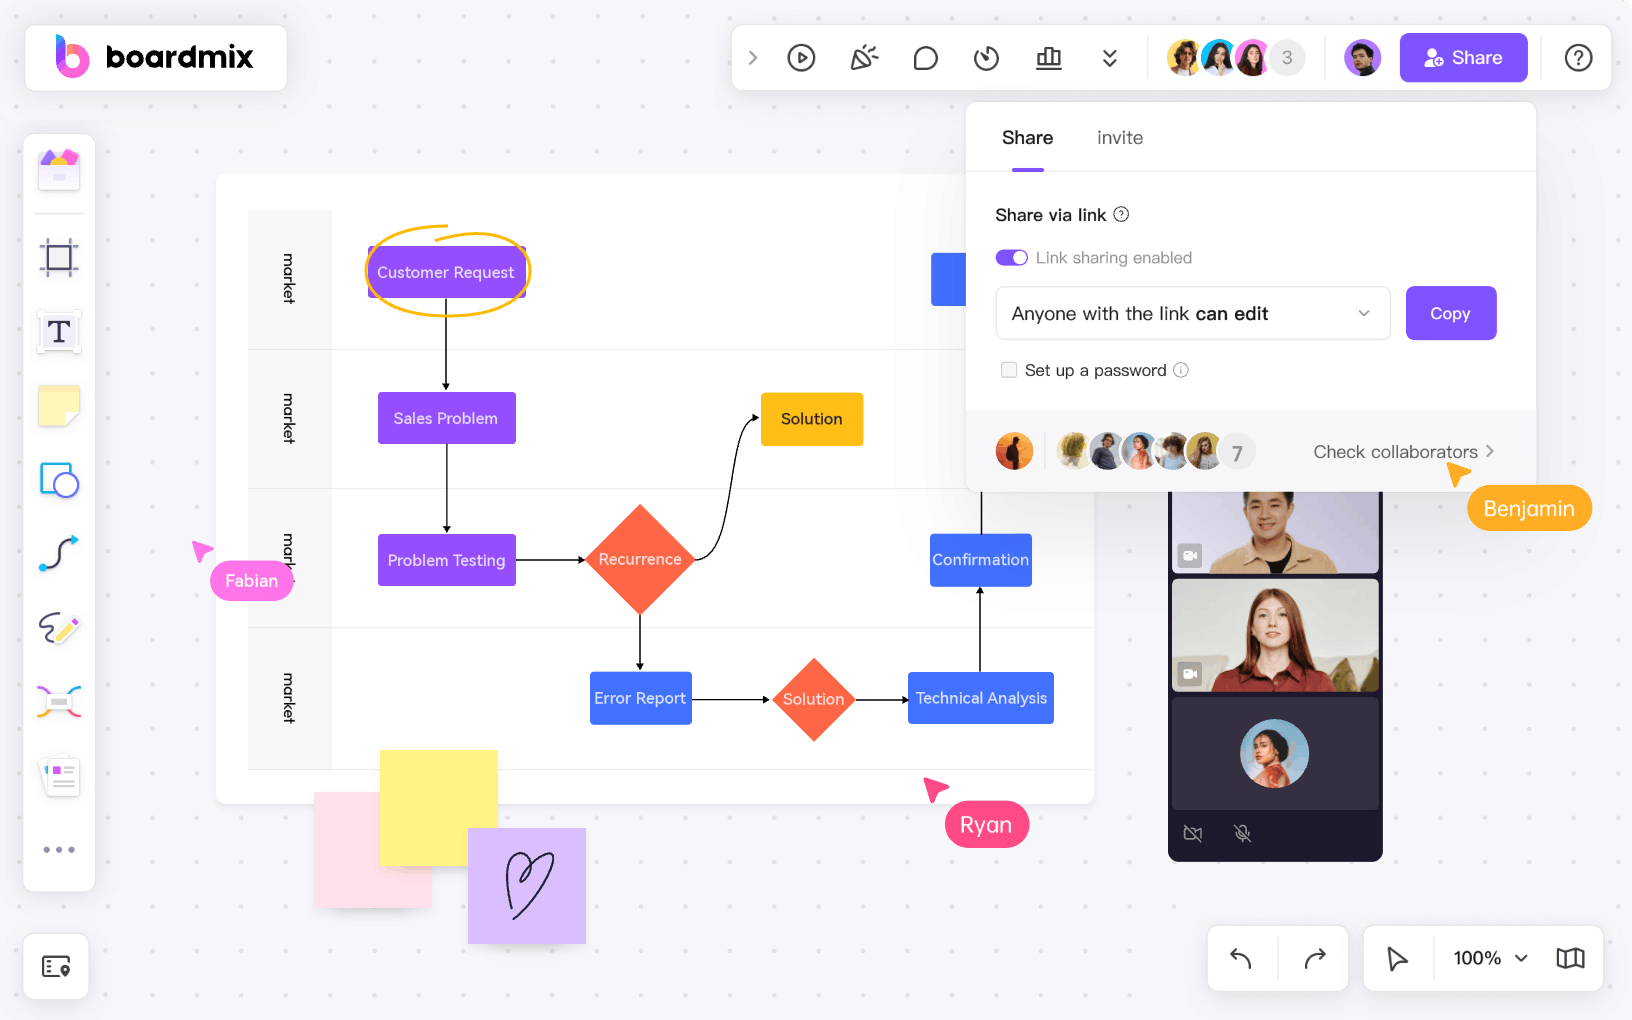
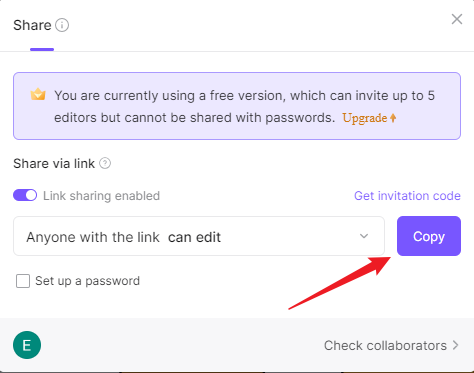
Step 8: Share and Export Your Diagram
Finally, once you're satisfied with your 4-circle Venn diagram, click on "Share" to invite your collaborators for co-creation. You can also export your finished diagram in various formats like JPEG, PNG, or PDF for future use.
With this easy-to-follow guide, creating detailed and customized 4-circle Venn diagrams with Boardmix becomes a straightforward task, even for beginners.
Tips for Presenting Data Effectively in 4-Circle Venn Diagrams
When presenting complex data sets, the use of visual tools like 4-circle Venn diagrams is key to conveying insights effectively. However, how the data is presented within these diagrams can impact their clarity and effectiveness. Here are some crucial tips for presenting data effectively in 4-circle Venn diagrams.
- Use Clear and Concise Labels
Each circle in your Venn diagram represents a distinct set of data. To avoid confusion, it's important to use clear, concise labels for each circle. Your audience should be able to understand at a glance what each set represents.
- Highlight Intersections Effectively
Intersections represent the common elements between the various data sets. Use contrasting colors, bolding, or underlining to make these areas stand out. This makes it easier for your audience to identify and understand the relationships between the different data sets.
- Keep the Design Simple
Although a 4-circle Venn diagram is complex by nature, keep the design as simple as possible. Avoid excessive use of different colors, fonts, and shapes that may confuse or distract your audience.
- Use a Logical Layout
Position your circles in a manner that reflects logical relationships between the data sets. This enhances your audience's ability to comprehend the relationships and overlap between the sets.
- Present Data Precisely
Ensure that the information within each area of the diagram is presented accurately and concisely. Too much information can be overwhelming, while too little can lead to misinterpretation.
- Provide an Interpretation
For complex data, consider providing an interpretation or summary of the diagram's key insights. This will help your audience understand the implications of the data presented.
- Review and Refine
Always review your diagram to ensure it effectively communicates the desired information. If necessary, refine your design and data presentation based on feedback from others.
With these tips in mind, you can harness the power of 4-circle Venn diagrams to present intricate data in a clear, engaging manner that aids decision making. Don’t forget to use Boardmix for a quick creation! Try it out right now!


