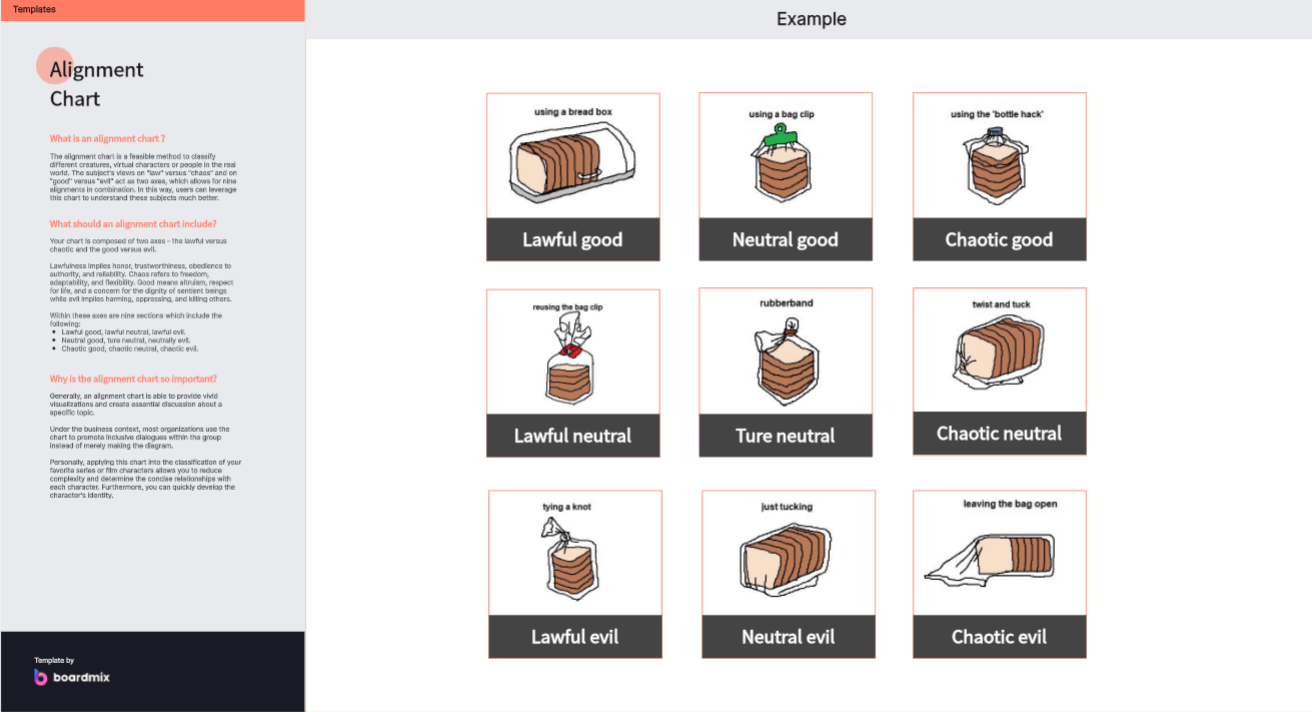
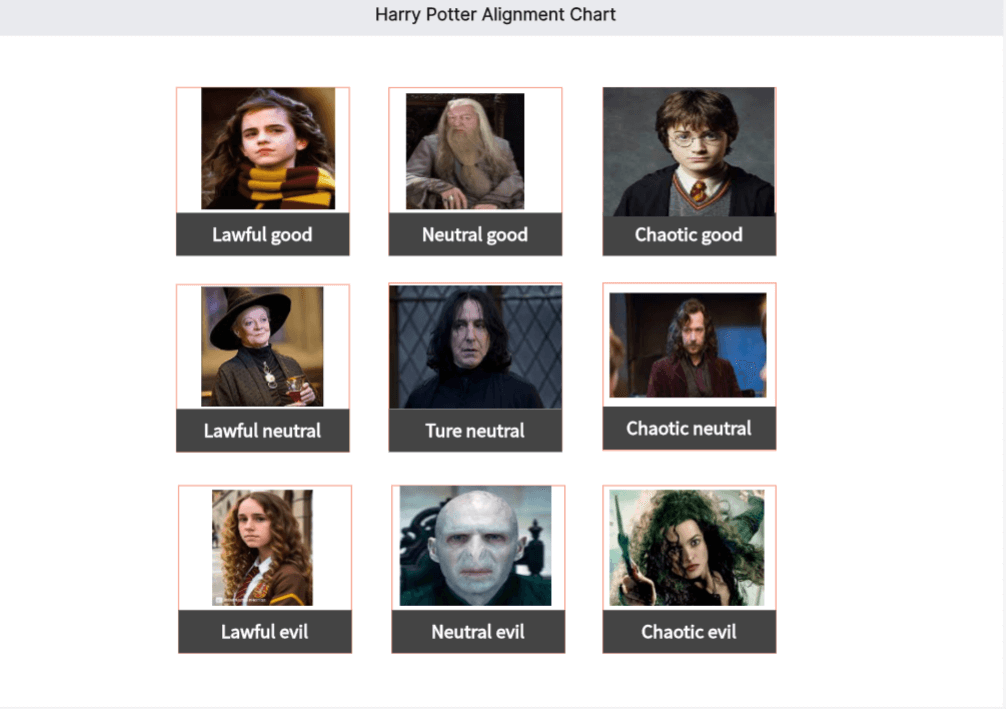
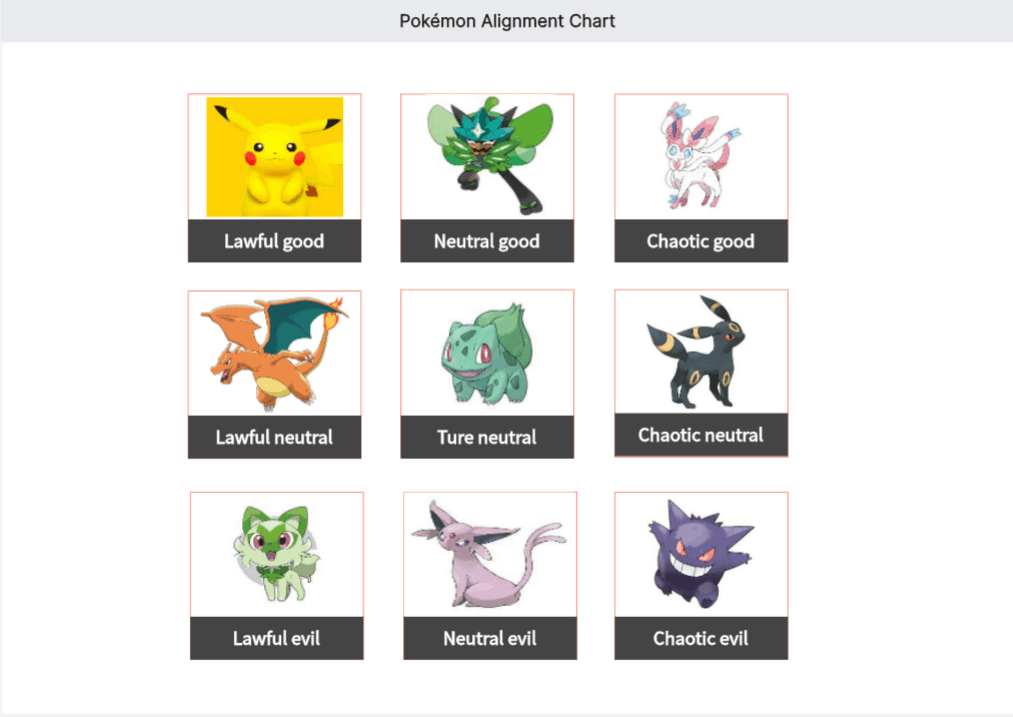
In the realm of design, project management, and strategic planning, the term "alignment chart" is often used to describe a visual tool that helps teams understand and organize how various elements of a project or business align with each other. An alignment chart is a versatile instrument that can be applied in multiple contexts, from aligning design elements within a graphic layout to ensuring that a company's strategic goals are in sync with its operational processes. This article will provide an in-depth look at what an alignment chart is, its applications, and how to create and use one effectively.

Understanding Alignment Charts
An alignment chart is essentially a diagram or chart that illustrates the relationship between different components, ensuring that they are aligned with a common goal or objective. It can be as simple as a Venn diagram showing overlapping areas of interest or as complex as a matrix that maps out multiple variables and their interdependencies.
Key Benefits of Alignment Charts
Alignment charts indeed offer numerous benefits across various aspects of business operations and project management. Let's delve deep into the five key benefits.
Clarity: One of the primary advantages of alignment charts is their ability to visually represent relationships between different elements. Whether it's aligning team members' roles with project goals or mapping out a company's strategic objectives against its operational activities, these charts provide a clear picture that can be easily understood by all stakeholders. This clarity helps eliminate confusion and ensures everyone is on the same page.
Efficiency: Alignment charts contribute significantly to efficiency in decision-making processes. By visually highlighting areas of agreement and potential conflict, they allow teams to quickly identify issues and address them proactively. This not only saves time but also prevents unnecessary disputes and misunderstandings down the line.
Collaboration: These charts play a crucial role in fostering communication and collaboration among team members. They serve as a common reference point that promotes dialogue and encourages collective problem-solving. By clearly delineating responsibilities and showing how each team member's work aligns with the overall goals, alignment charts help create a collaborative work environment where everyone feels valued and involved.
Strategic Planning: In strategic planning, alignment charts are invaluable tools. They provide a visual roadmap that aligns strategic goals with operational activities, ensuring that every step taken contributes towards achieving the overarching objectives. This alignment helps organizations stay focused on their mission and facilitates effective resource allocation.
Consistency: Lastly, alignment charts ensure consistency across all aspects of a project or business. They serve as a guiding tool that keeps every element - from individual tasks to departmental objectives - aligned with the overall vision. This consistency not only ensures coherence in operations but also strengthens brand identity and fosters trust among stakeholders.
Whether it's providing clarity, improving efficiency, fostering collaboration, aiding strategic planning, or ensuring consistency, alignment charts prove to be an indispensable tool for businesses and projects alike.
Applications of Alignment Charts
Alignment charts indeed have wide-ranging applications across various fields and disciplines. Let's take a closer look at the five applications of Alignment charts.

Design Alignment
In the realm of graphic design, alignment charts are instrumental in maintaining a consistent design language. They can help designers ensure that all visual elements - from typography and images to layout and color schemes - are cohesive and aligned with the overall design objectives. This coherence not only enhances aesthetic appeal but also improves usability and user experience.
Project Management
Project managers often use alignment charts as a visual tool to map out tasks, resources, and timelines. These charts provide a clear overview of the project's progression, helping ensure that all team members are working towards the same objectives. They can also highlight potential bottlenecks or conflicts, enabling proactive problem-solving.
Strategic Alignment
For businesses, alignment charts can serve as a crucial tool for strategic planning. By aligning their mission, vision, and core values with their strategic goals and operational plans, businesses can ensure that every action taken contributes towards achieving their overarching objectives. This strategic alignment fosters organizational coherence and enhances business performance.
Marketing and Sales
In marketing and sales, alignment charts can offer valuable insights into how different marketing channels and campaigns support each other. They can illustrate how each initiative contributes to the overall brand strategy, helping teams optimize their efforts for maximum impact. Moreover, these charts can facilitate better collaboration between marketing and sales teams by aligning their goals and activities.
Product Development
Lastly, in product development, alignment charts can be used to illustrate how various aspects of a product - from features and user experience to technical requirements - align with customer needs and market trends. By visually mapping out these alignments, product teams can ensure that their products meet customer expectations while staying competitive in the market.
Whether it's in design, project management, strategic planning, marketing, or product development, alignment charts provide an effective way to visualize alignments and contribute significantly towards achieving cohesion and consistency across various elements.
How to Create an Alignment Chart in Boardmix
Here's a step-by-step guide on how to create an alignment chart in Boardmix:

1. Login to your Boardmix account. Log in to your Boardmix account or create a new account if you don't have one already.
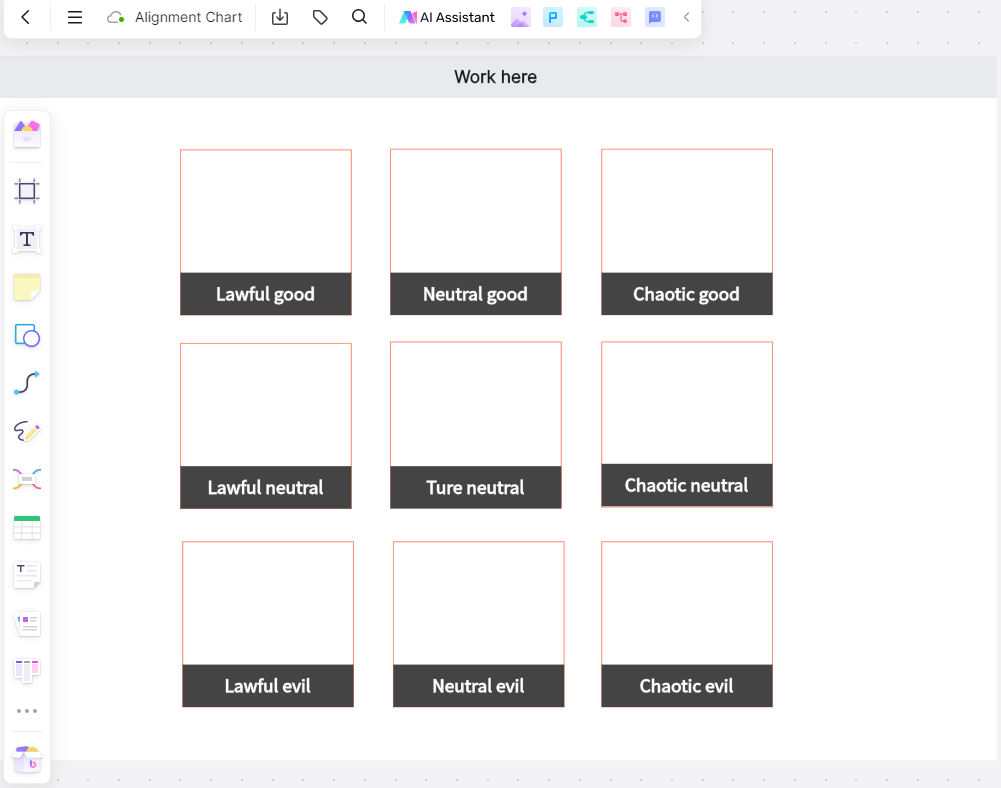
2. Create a new board for Alignment chart. Once you've logged in, click the New Board button to start creating your alignment chart.
3. Choose a template or start from scratch: Boardmix offers various templates for different types of alignment charts, such as SWOT analysis, decision matrices, and more. Select the most appropriate format for your alignment chart. This could be a simple Venn diagram, a matrix, a flowchart, or a custom design. You can choose a template that best suits your needs or start with a blank canvas.
4. Define the axes: Determine the criteria or attributes that you want to compare and represent on the X and Y axes of the chart. For example, if you're comparing different software options, the X-axis could represent cost, and the Y-axis could represent features.
5. Add options: Input the options or alternatives that you want to compare. Each option should be represented as a separate row or column on the chart.
6. Evaluate and score: Assess each option based on the defined criteria and assign scores or rankings accordingly. You can use a numerical scale, such as 1 to 5, or customize the scoring system based on your needs.
7. Customize the chart: Boardmix provides various customization options to make your alignment chart visually appealing and easy to understand. You can change the colors, and font styles, add icons or images, and more. Consider the following when customizing your chart.
-Define the Objectives: Clearly identify the goals and objectives you want to achieve with the alignment chart.
-Identify Components: Determine the key components or elements that need to be aligned. These could be design elements, project tasks, strategic goals, etc.
-Map Relationships: Visually map out the relationships between the components, showing how they align or intersect.
8. Analyze the results: Once you have completed scoring and customization, analyze the chart to identify patterns or trends. Look for options that consistently score high or low across multiple criteria.
9. Share and collaborate: Boardmix allows you to share your alignment chart with others for collaboration and feedback. You can invite team members or stakeholders to view or edit the chart, depending on your preferences.
10. Review and update regularly: Alignment charts are dynamic tools that may require regular updates as new information becomes available or circumstances change. It's important to review and update the chart regularly to keep it relevant and accurate.
By following these steps, you can easily create an alignment chart in Boardmix to compare options, evaluate criteria, and make informed decisions.
By following these steps, you can easily create an alignment chart in Boardmix to compare options, evaluate criteria, and make informed decisions.
How to Use Alignment Charts Effectively
Here are some tips on how to use alignment charts effectively:

1. Understand the concept: Alignment charts are visual tools that help you analyze and compare different elements based on their characteristics or qualities. They are often used in decision-making processes or when evaluating options.
2. Define the criteria: Before creating an alignment chart, it's important to define the criteria or attributes that you want to compare. For example, if you're comparing different software options, the criteria could include cost, features, user-friendliness, and customer support.
3. Identify the options: Once you have defined the criteria, identify the different options that you want to compare. These could be different software products, job candidates, or any other set of alternatives.
4. Create the chart: Use a grid or table format to create your alignment chart. The criteria should be listed on one axis, and the options should be listed on the other axis. This will allow you to easily compare and evaluate each option based on the defined criteria.
5. Assign scores or rankings: Assign scores or rankings to each option based on how well they meet each criterion. This could be done using a numerical scale, such as 1 to 5, or by assigning labels such as "high," "medium," or "low."
6. Analyze the results: Once you have completed the alignment chart, analyze the results to identify patterns or trends. Look for options that consistently score high or low across multiple criteria. This will help you make informed decisions or identify areas for improvement.
7. Use visual cues: To make the alignment chart more visually appealing and easier to understand, consider using color coding or symbols to represent the scores or rankings. For example, you could use green for high scores, yellow for medium scores, and red for low scores.
8. Review and update regularly: Alignment charts are not static documents. As new information becomes available or circumstances change, it's important to review and update the chart regularly. This will ensure that it remains relevant and accurate.
9. Regularly Update: As projects evolve, so should your alignment charts. Regular updates ensure that everyone remains on the same page.
10. Facilitate Discussions: Use the chart as a starting point for discussions, allowing team members to provide input and suggestions.
11. Make It Accessible: Ensure that the alignment chart is easily accessible to all relevant stakeholders, whether it's a physical chart in a meeting room or a digital version shared via a project management tool.
12. Incorporate Feedback: Be open to feedback and willing to adjust the chart based on input from your team or stakeholders.
13. Link to Action: Use the insights gained from the alignment chart to inform action plans and decision-making processes.
By following these tips, you can effectively use alignment charts to analyze and compare different options, make informed decisions, and improve your overall decision-making process.
Conclusion
Alignment charts are powerful tools that can help individuals and organizations achieve a higher level of clarity, efficiency, and collaboration. By understanding the objectives, identifying components, and choosing the right format, anyone can create an alignment chart that serves their specific needs. Whether you're a designer looking to create a cohesive visual identity, a project manager aiming to streamline workflows, or a business leader ensuring strategic alignment, an alignment chart can be an invaluable asset in your toolkit.


