

Finding the right strategies to grow your business is a challenging task. One strategy might work for one organization and fail when used by another. This is where you can use the Ansoff matrix to help you. This invaluable tool allows you to write down and explore all the options at your disposal for getting the most out of your business.
The examples below use Apple, Starbucks, and Nestle to illustrate the four growth options. You will also find a template and a smaller business example to help classify your own ideas.

What Are the 4 Strategies of the Ansoff Matrix
The Ansoff matrix compares growth options using existing or new products and markets. The framework is named after Igor Ansoff, who introduced it in 1957.
Visually, an Ansoff matrix is rather simple as it consists of two axes, the X-axis refers to the products, and the Y-axis to the markets. Then, what the Ansoff growth matrix does is add four different strategies, represented by the four quadrants. These four strategies show you how to grow your business based on existing products and markets and new products and markets. This means that you can also use the Ansoff matrix to see the risk of possible future moves.
The four strategies of the Ansoff growth matrix are:
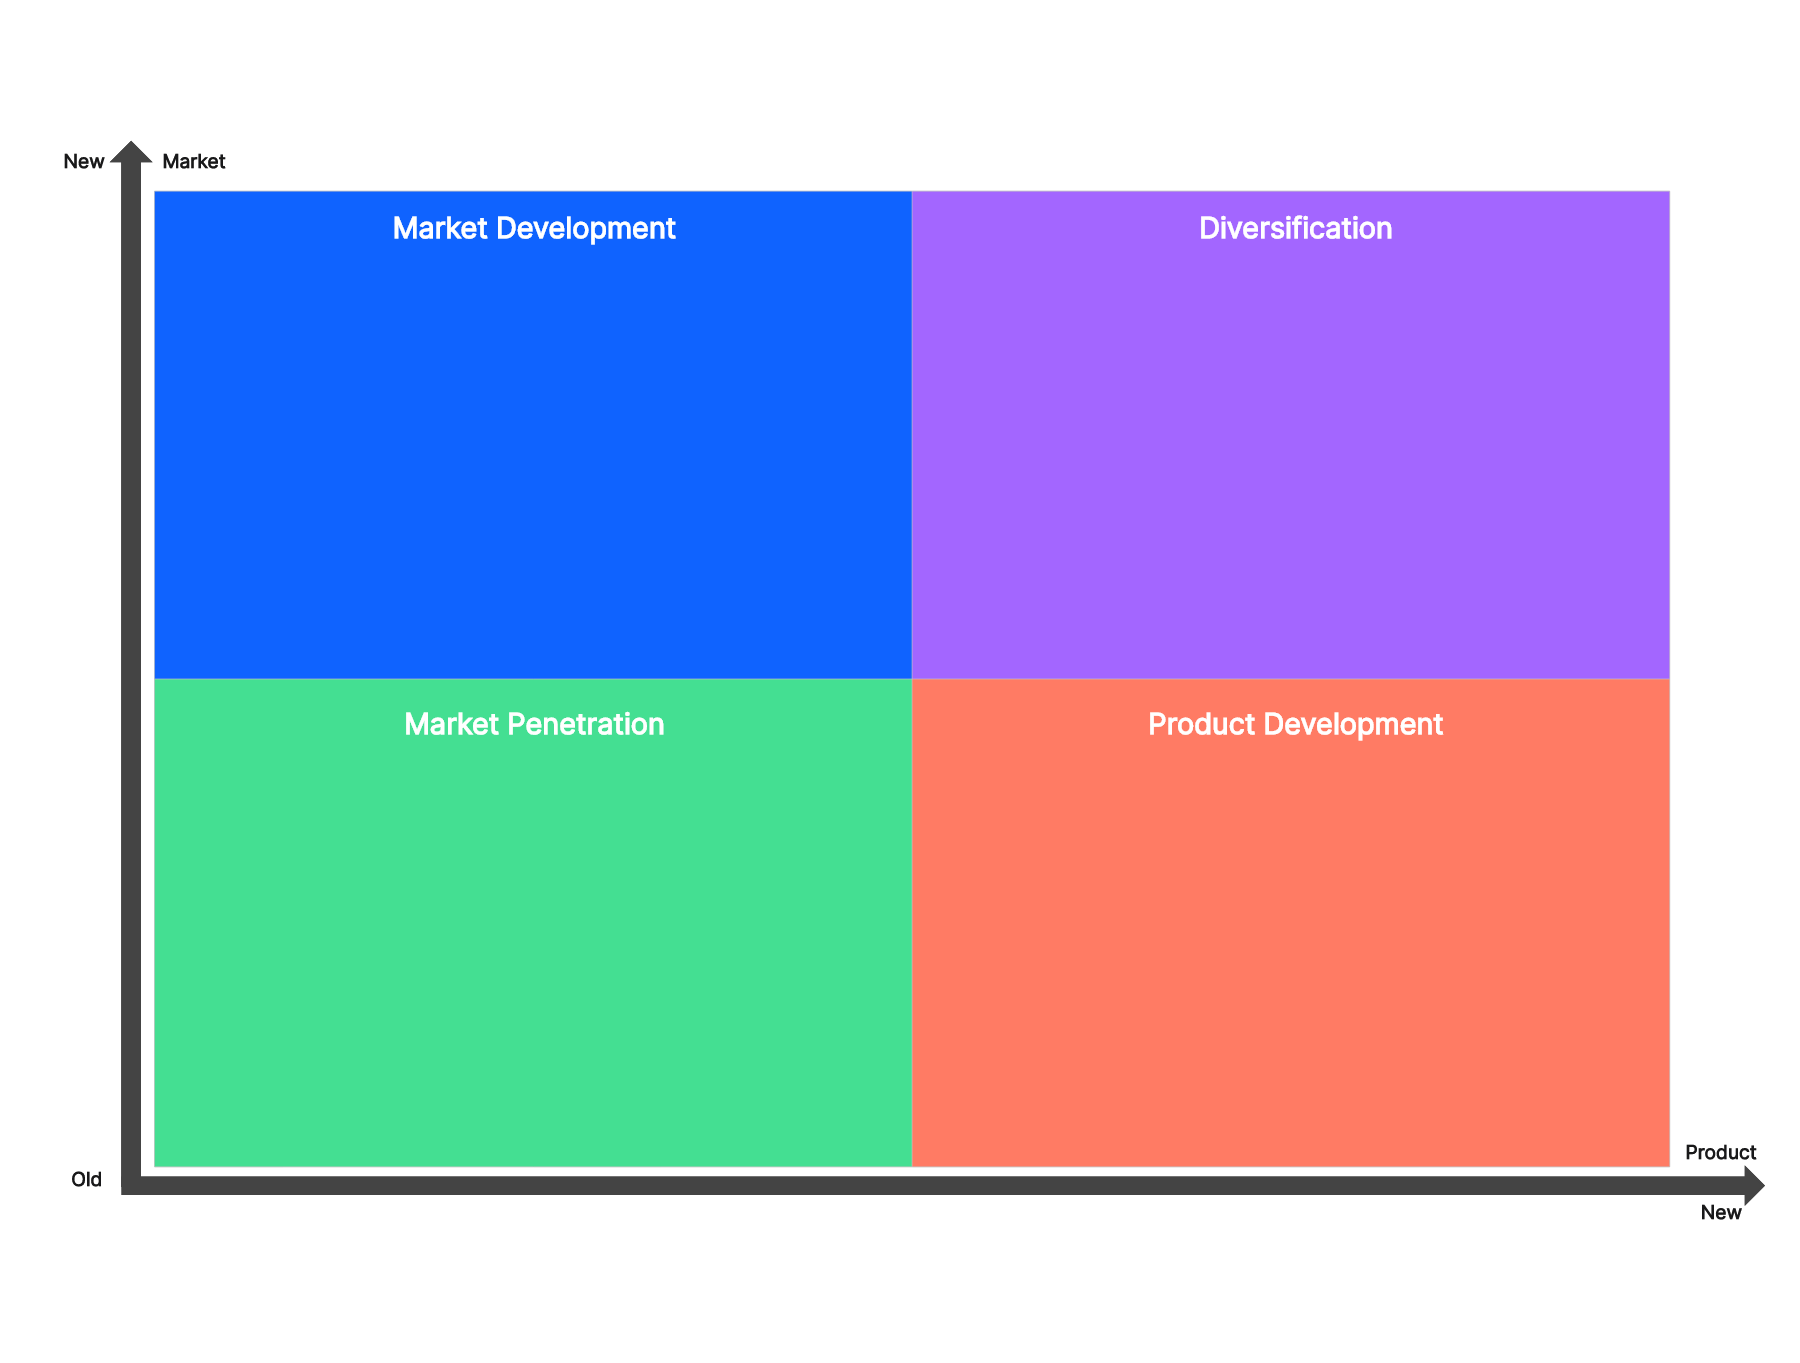
- Market Penetration – sell more existing products to the existing market. Familiarity with the product and customers can reduce uncertainty, but the strategy still involves competitive, pricing, and execution risks.
- Market Development – the next quadrant in the Ansoff matrix is when you are trying to market your existing products to a new market. In an Ansoff matrix, a new market can be either a new geographical region or a new customer segment. Of course, this comes with greater risk as you need to perform thorough market research before you try anything.
- Product Development – this quadrant of the Ansoff matrix refers to the strategy when you want to develop and launch a new product in an existing market. This strategy should focus on Research and Development, as well as finding the market’s gaps in order to introduce an innovative product that satisfies their needs.
- Diversification – diversification combines uncertainty about both a new product and a new market. As its name suggests, this strategy is about launching a new product in an entirely new market.
What Is the Ansoff Matrix Used for
An Ansoff growth matrix is a strategic tool that can help companies recognize potential in existing and new markets. That’s why it is widely used in the corporate world as it allows businesses to analyze the risks and rewards from various strategies.
In more detail, the Ansoff matrix is used for:
- Market analysis – first of all, an Ansoff matrix will show you where you are in the market right now, and whether there are opportunities to expand into a new market or launch a new product.
- Identification of new markets – in this matrix, you can determine if your company is in a position to try for a new market.
- Risk assessment – since you can see all four strategies in the Ansoff matrix, you are in a position to compare the risks associated with each one. This will allow you to make an informed decision before you invest in a strategy.
- Strategic decision-making – this framework as a whole, supports strategic decision-making as it enables you to think about how to evolve your business in the long run.
Pros and Cons of the Ansoff Matrix
The Ansoff growth matrix has become such an invaluable framework because it has numerous benefits for businesses. Namely, these are:
- It is a simple and intuitive tool – the matrix is very easy to create and understand. Therefore, all team members can recognize at a glance what each strategy entails.
- It prompts a discussion of risk – entering a new market or building a new product introduces different uncertainties. The matrix itself does not calculate their probability or financial impact.
- It compares different growth directions – seeing four options together can reveal alternatives that a single proposal misses. Competitor research, cost estimates, and customer evidence are still needed to evaluate them.
Nevertheless, as with every other tool, the Ansoff growth matrix also has its drawbacks. Realizing them will help you better utilize the tool. The most noteworthy limitations of this framework are:
- It doesn’t include the competition in the market – as you already know, what your competitors are doing influences your strategies. That’s why you should make sure that you also consider that before taking any action.
- It doesn’t consider the timing – another crucial factor for a strategy’s success is the timing.
- It shifts your emphasis on growth – even though growth is important, it’s not the only thing that a business should focus on. For example, you also need to consider cost control and operational efficiency among others.
3 Ansoff Matrix Examples for Business Growth
Ansoff Matrix Example – Apple
The first Ansoff matrix example that we are going to examine is about Apple. The tech giant is already a dominating force in the industry. However, there are still ways to grow and become even more powerful. Here is this Ansoff matrix example:
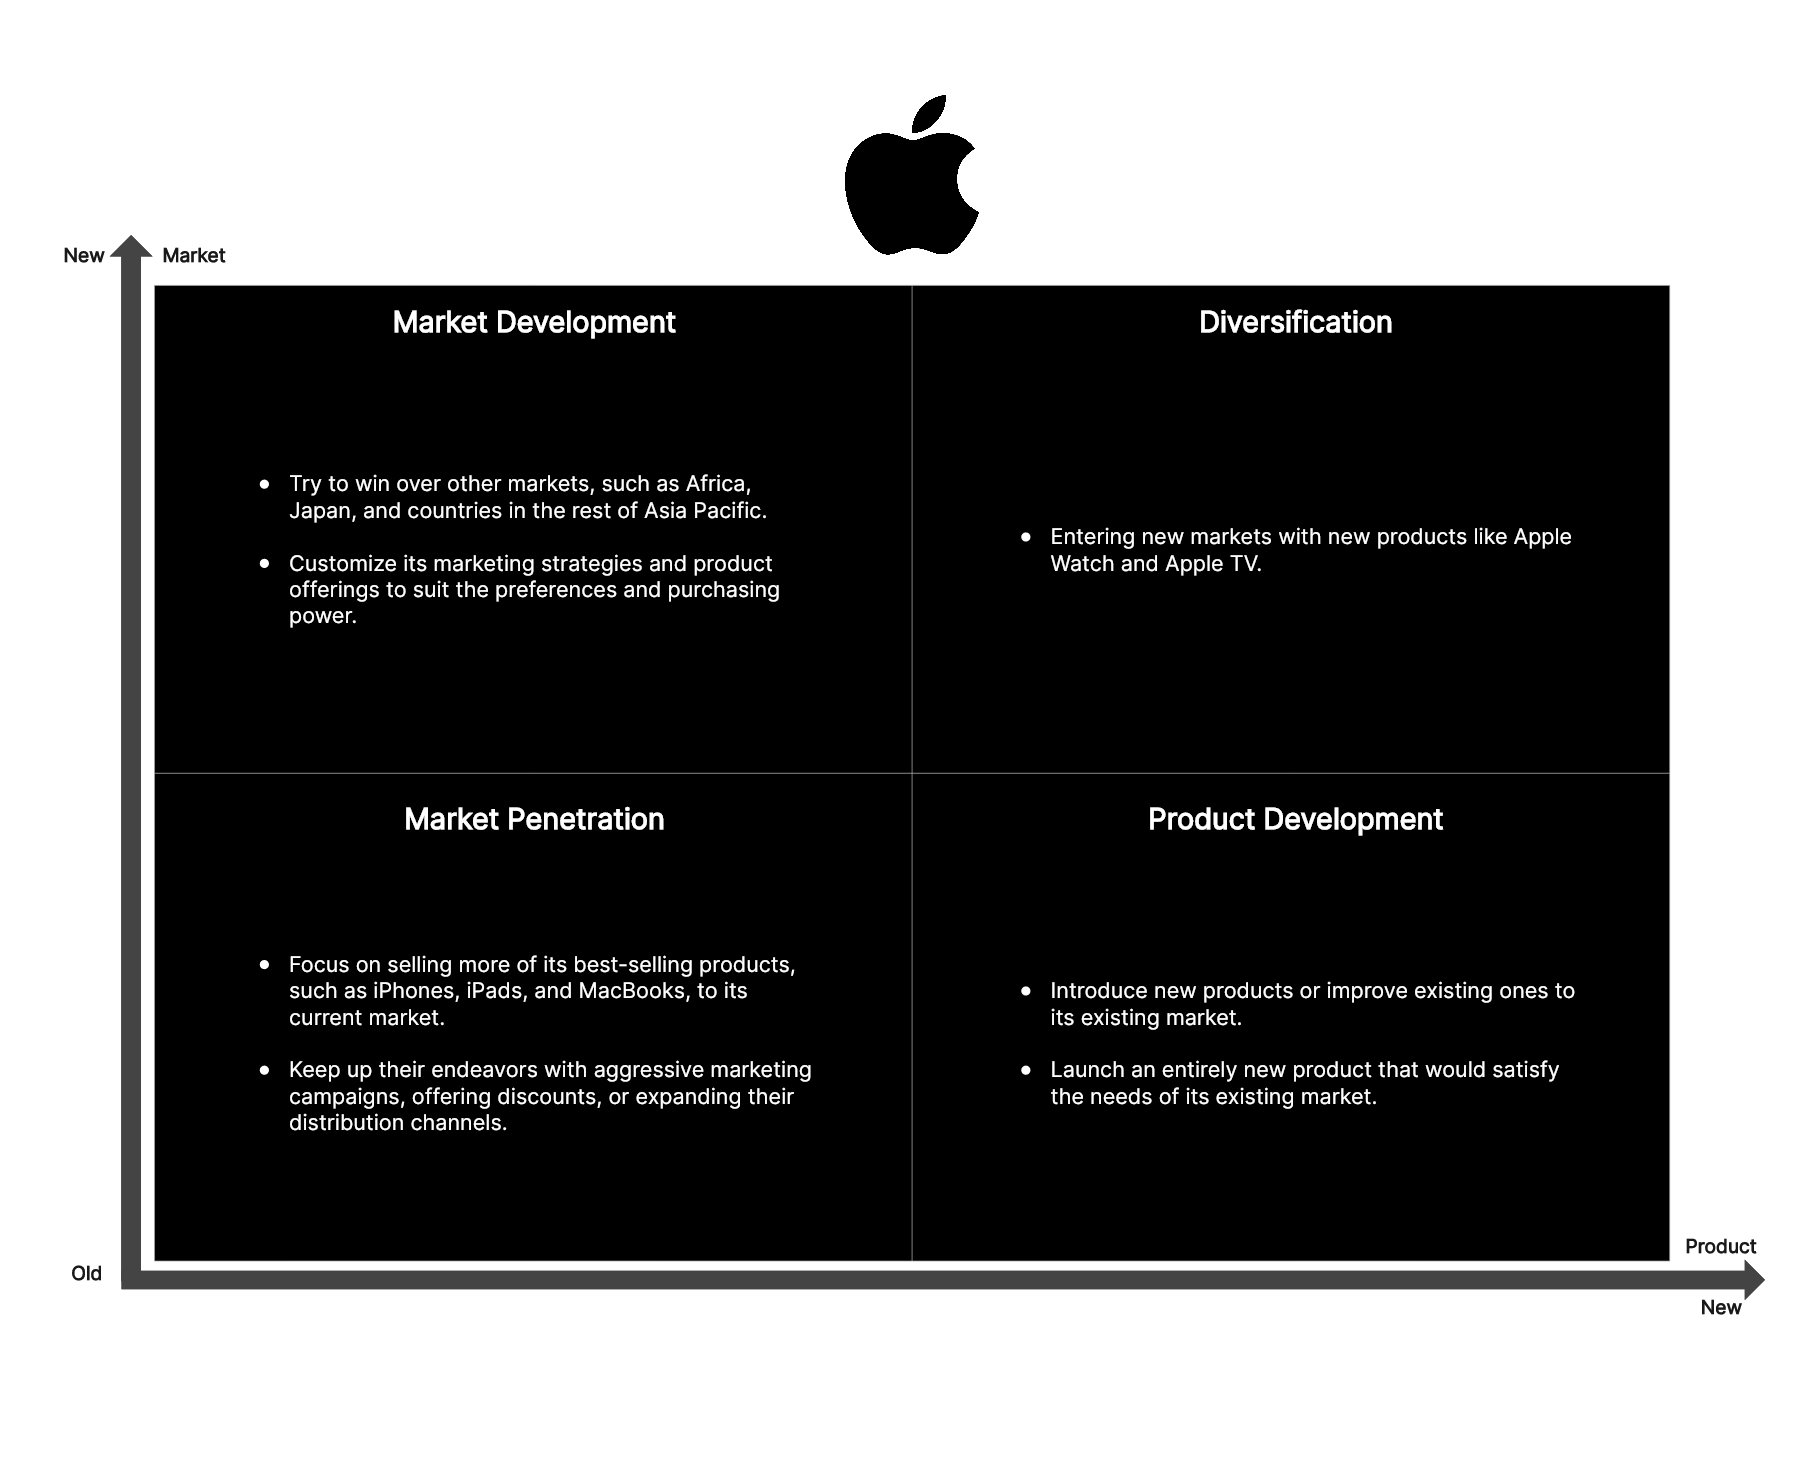
Market Penetration: Apple could focus on selling more existing iPhones, iPads, and MacBooks to its current market through promotions or stronger distribution.
Market Development: Apple could sell an existing product to a customer segment it does not yet serve. Merely increasing sales in a country where the same product already reaches the same audience would be market penetration, not market development.
Product Development: Another strategy would be for Apple to introduce new products or improve existing ones to its existing market. For instance, the new iPhone models have advanced features that increase the market’s hype. Another idea would be to launch an entirely new product that would satisfy the needs of its existing market.
Diversification: A new product aimed at a genuinely new customer market would qualify. A new device sold to existing customers is usually product development. Apple Watch or Apple TV+ cannot be classified solely by being new product names; the analysis also needs to define the target market.
Ansoff Matrix Example – Starbucks
The following Ansoff matrix example is about Starbucks, another powerful company in its industry. Let’s see what this framework will look like for this type of company:
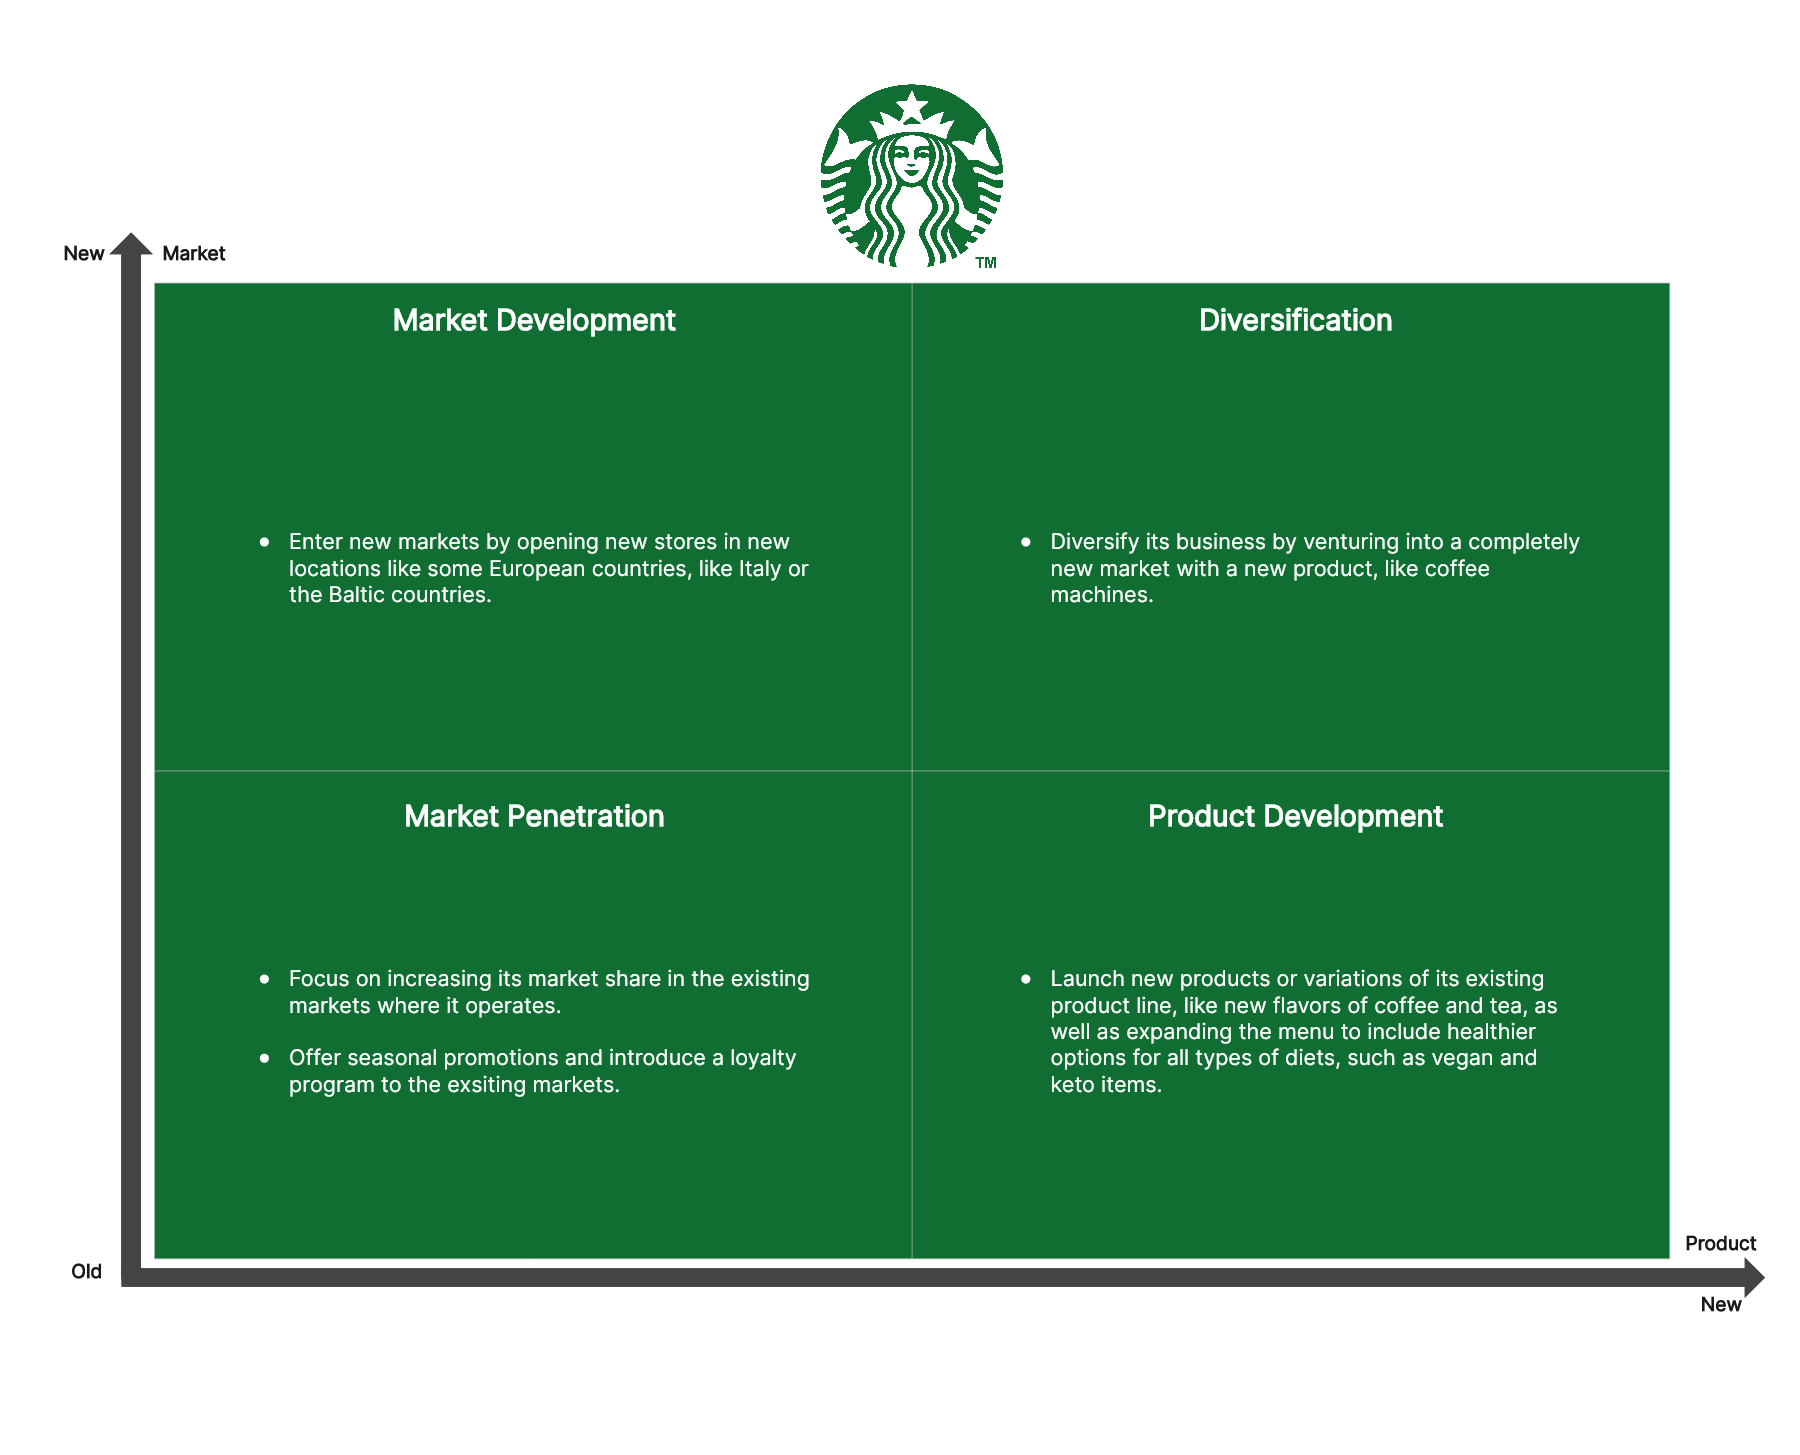
Market Penetration: Starbucks could increase repeat purchases of existing drinks in its current markets through seasonal promotions and customer retention activity. Opening more stores for the same customer segment may also support penetration.
Market Development: Starbucks could take an existing offer into an unserved region or customer segment. Before selecting a location, the team would need evidence of demand, purchasing habits, and delivery costs rather than assuming that a new store automatically means a new market.
Product Development: Another strategy is for Starbucks to launch new products or variations of its existing product line. For instance, this could include the introduction of new flavors of coffee and tea, as well as expanding the menu to include healthier options for all types of diets, such as vegan and keto items.
Diversification: Starbucks could also diversify its business by venturing into a completely new market with a new product. For example, it could create its own coffee machines that other cafés could buy.
Ansoff Matrix Example – Nestle
The final Ansoff matrix example that we are going to see is about Nestle. This multinational company is in the food and beverage industry and has solidified itself as one of the key players. This is how this framework can be applied to this giant company:
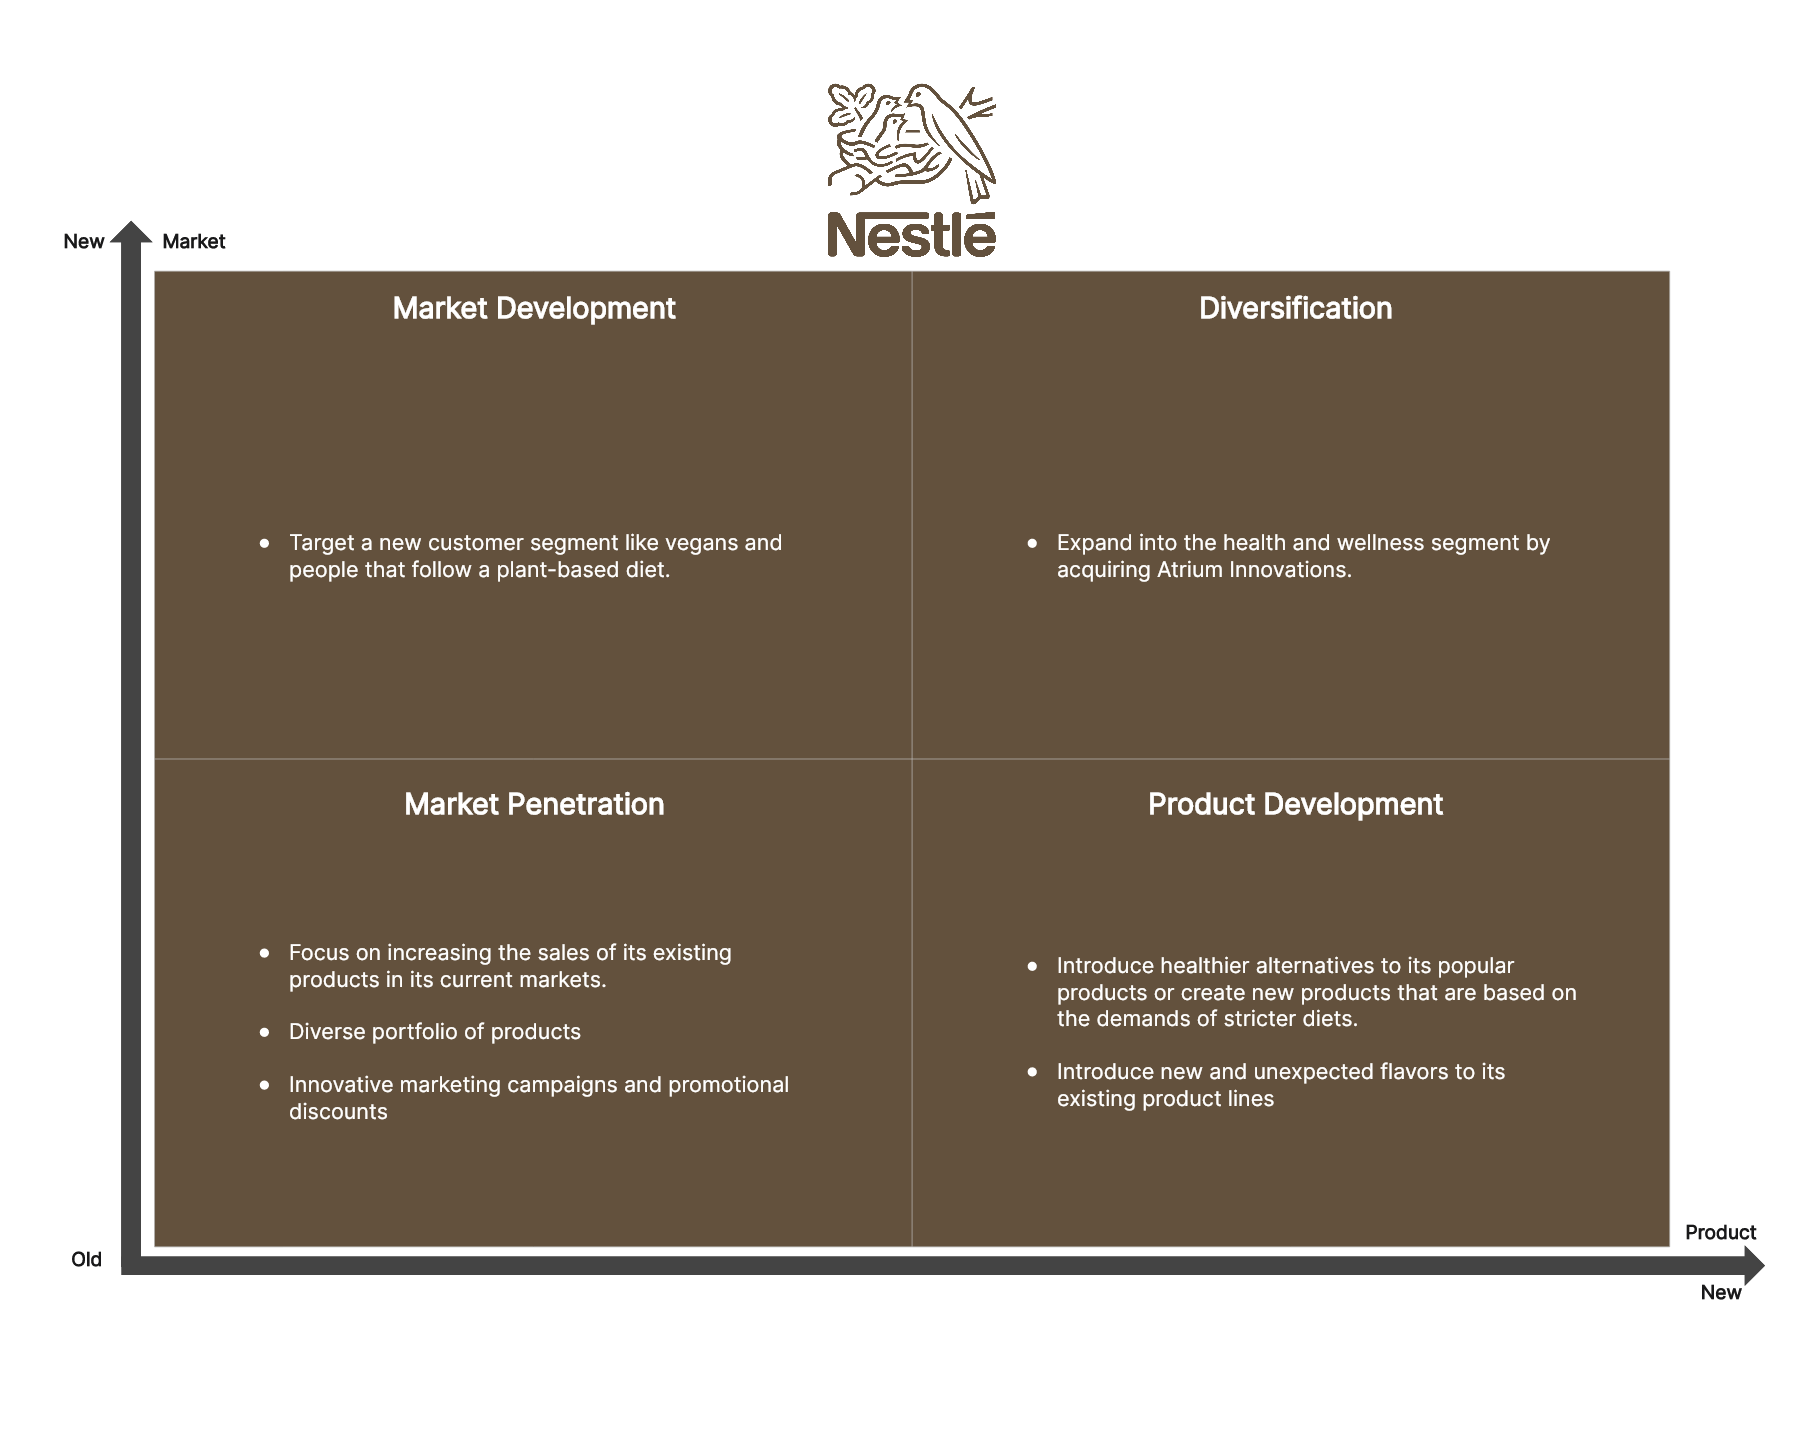
Market Penetration: Nestle could increase sales of existing products in its current markets through distribution improvements and promotional campaigns. This option uses the current portfolio rather than requiring a new product line.
Market Development: Nestle could offer an existing product to a new customer segment. Selling an existing plant-based product to a previously unserved audience could fit this quadrant; developing a new plant-based product for current customers would instead be product development.
Product Development: Nestle could also develop new products to cater to evolving consumer preferences. For instance, it could introduce healthier alternatives to its popular products or create new products that are based on the demands of stricter diets. Another idea could be to introduce new and unexpected flavors to its existing product lines.
Diversification: An acquisition can add products and customers outside a business unit’s existing scope. Nestle’s 2018 results report the acquisition of Atrium Innovations. Whether an acquisition represents diversification or an extension of an existing health business depends on the product and market boundaries used in the analysis.
How to Use the Ansoff Growth Matrix
Before filling in the matrix, define the business unit, current products, and current customers. Otherwise, the same proposal may appear in different quadrants because team members mean different things by “new.” The steps for using the Ansoff growth matrix are:
- Create the empty matrix – you can either start from scratch or find a template that will make the creation of your Ansoff matrix much faster. Customize the matrix to fit your needs.
- Analyze your strategies – then, write down all four strategies into the relevant quadrants. Don’t hesitate to think big as all available options can inspire you to find the right strategy for your company.
- Perform a risk analysis – before deciding on a strategy from the Ansoff growth matrix, it is important to understand the risks associated with it.
- Prepare for any outcome – along with the risk analysis, you can also prepare for any outcome. This will work as damage control in the case where your strategy didn’t go as planned.
- Select which strategy is the best – now you can make an informed decision and start implementing the strategy you’ve chosen.
A small-business example: a neighborhood bakery
Suppose a bakery currently sells bread and pastries to neighborhood walk-in customers. Keeping that baseline fixed makes the choices easier to compare:
| Growth idea | Strategy | Question to test before investing |
|---|---|---|
| Offer the same bread to current customers more often | Market penetration | Will repeat demand cover the promotion cost? |
| Sell the current range to offices in a new district | Market development | Will office buyers order often enough to cover delivery? |
| Add a new pastry for existing walk-in customers | Product development | Do existing customers want it, and can the kitchen produce it consistently? |
| Create baking classes for a new audience of hobbyists | Diversification | Is there demand for classes, and can the team teach as well as bake? |
Choose a small demand test for the most promising option, estimate the resources it needs, and decide what evidence would justify a larger investment.
Ansoff Growth Matrix Template & Tool
The easiest way to create your own Ansoff matrix is to use a ready-made template. Boardmix has created a well-designed and professional Ansoff matrix template that you can immediately start using. Find the template in Boardmix’s large library and create your matrix with just a few, simple steps.
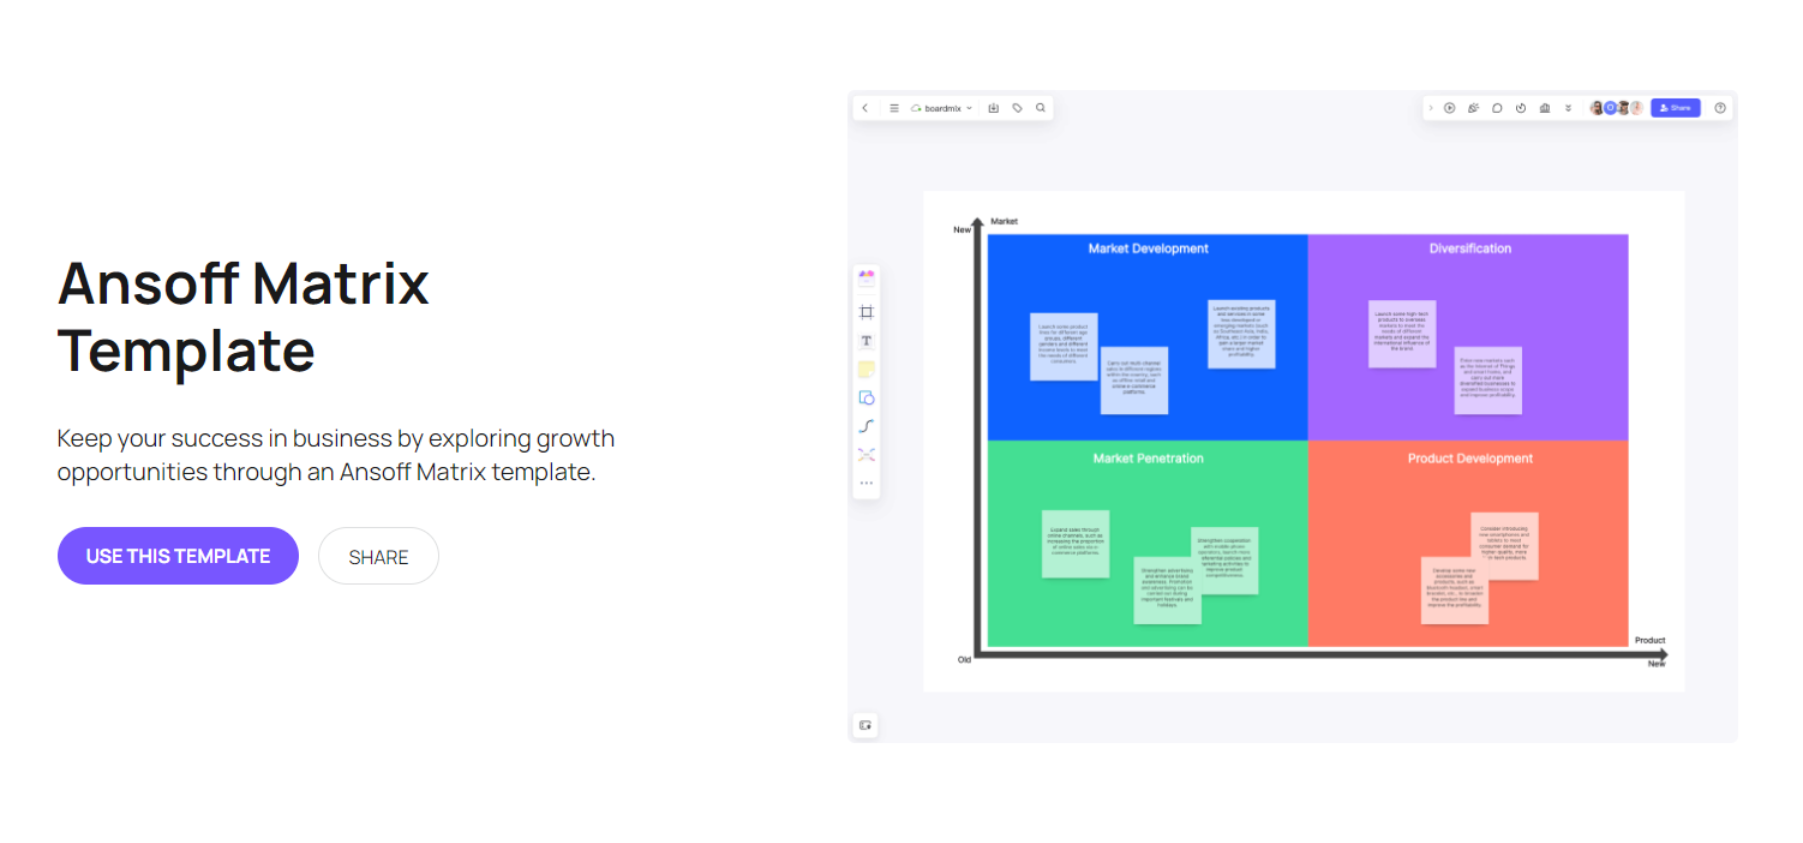
Moreover, Boardmix provides various tools that can help you analyze data and enrich your matrix. Create your account in Boardmix for free to access your workspace and create any type of diagram you need for your business.
FAQs about Ansoff Matrix
Which Ansoff Matrix growth strategy is considered the riskiest?
Diversification is generally treated as the most uncertain direction because both the product and the market are new to the defined business. That does not mean every diversification proposal is riskier than every penetration proposal. Relevant experience, partnerships, demand evidence, and the size of the investment can change the risk.
What is the difference between SWOT analysis and Ansoff Matrix?
Even though both the SWOT analysis and the Ansoff matrix are tools used for strategic planning, they are quite different. The most significant difference is that they focus on separate things. The Ansoff matrix primarily focuses on growth strategies, while the SWOT analysis has a broader view since it analyzes all internal and external factors.