


In our visual-centric world, understanding and retaining information is significantly improved when data is presented graphically. One such visualization tool is the Bubble Map, a simple yet effective instrument for elucidating concepts and ideas. This article delves into the essence of Bubble Mapping, its application, pros and cons as well as examples. Let’s get started!
What Is Bubble Mapping
Bubble Mapping, often referred to as Bubble Charting, is a graphical tool used to visualize and compare data points in terms of their values, positions, and sizes. Each entity of data is represented as a bubble where the size and color of the bubble depict different dimensions of data, and its placement on the graph represents its value along the axes. This multivariate display allows for a comparison of data along multiple dimensions, offering comprehensive insights at a glance.
Applications of Bubble Mapping
Bubble Mapping finds utility across various sectors and disciplines due to its capacity to represent multifaceted data succinctly. Here are some areas where it's extensively applied:
- Project Management: Bubble Maps help evaluate projects on parameters such as cost, benefits, risks, and timelines, aiding project managers in prioritization and decision-making.
- Business Analysis: Companies use Bubble Maps to assess markets or to conduct SWOT (Strengths, Weaknesses, Opportunities, Threats) analysis, positioning various factors on dimensions of importance and performance.
- Education: In schools and colleges, Bubble Maps facilitate understanding of relationships between concepts by visually grouping related items together.
Benefits and Challenges in Bubble Mapping
Advantages of Using Bubble Maps for Visualizing Concepts
Bubble Maps offer several distinct advantages:
- Multidimensional Visualization: Bubble Maps can visualize up to four dimensions of data—two on the axes, one using bubble size, and another using bubble color.
- Easy Comprehension: The visual nature of Bubble Maps helps quickly grasp complex data patterns and correlations.
- Aesthetically Appealing: Colorful and engaging, Bubble Maps can make dull numerical data look interesting, helping maintain audience attention.
Common Issues Encountered in Bubble Mapping and How to Address Them
Despite its merits, Bubble Mapping comes with its set of challenges:
- Overlapping Bubbles: When there's a significant amount of data, bubbles can overlap, making the map confusing. To mitigate this issue, consider adjusting bubble size or implementing interactive features like zoom or hover-over tooltips to provide detailed information.
- Perception Error: The human eye tends to compare areas rather than diameters of circles. This can lead to misinterpretation of bubble sizes. You can address this by providing clear legends that explain how bubble size relates to data magnitude.
- Absence of Standard Grid: Unlike bar or line graphs, Bubble Maps don't have a grid system to accurately locate each data point. To combat this issue, use axes labels accurately depicting the range of values they represent.
While Bubble Mapping offers a powerful means to visualize complex data, its usage needs to be tailored to ensure clear and accurate data representation.
Components of a Bubble Map
A Bubble Map consists of the following key components:
- Bubbles: Each bubble represents a single entity or data point. The size, color, and placement of the bubble correspond to various aspects of the data it represents.
- Axes: The x and y-axes define the dimensions that the bubbles' placement represents. Usually, they indicate numerical or quantitative data.
- Bubble Size: The size of a bubble usually corresponds to a specific quantitative value. Larger bubbles typically indicate greater values.
- Bubble Color: The color of the bubbles is often used to represent categorical data or distinguish between different data groups.
- Legends: Legends help decode the meaning of different bubble sizes and colors, making the map easier to interpret.
Gain Insights from Bubble Mapping Examples
Let's delve into some practical examples where Bubble Mapping has been effectively used:
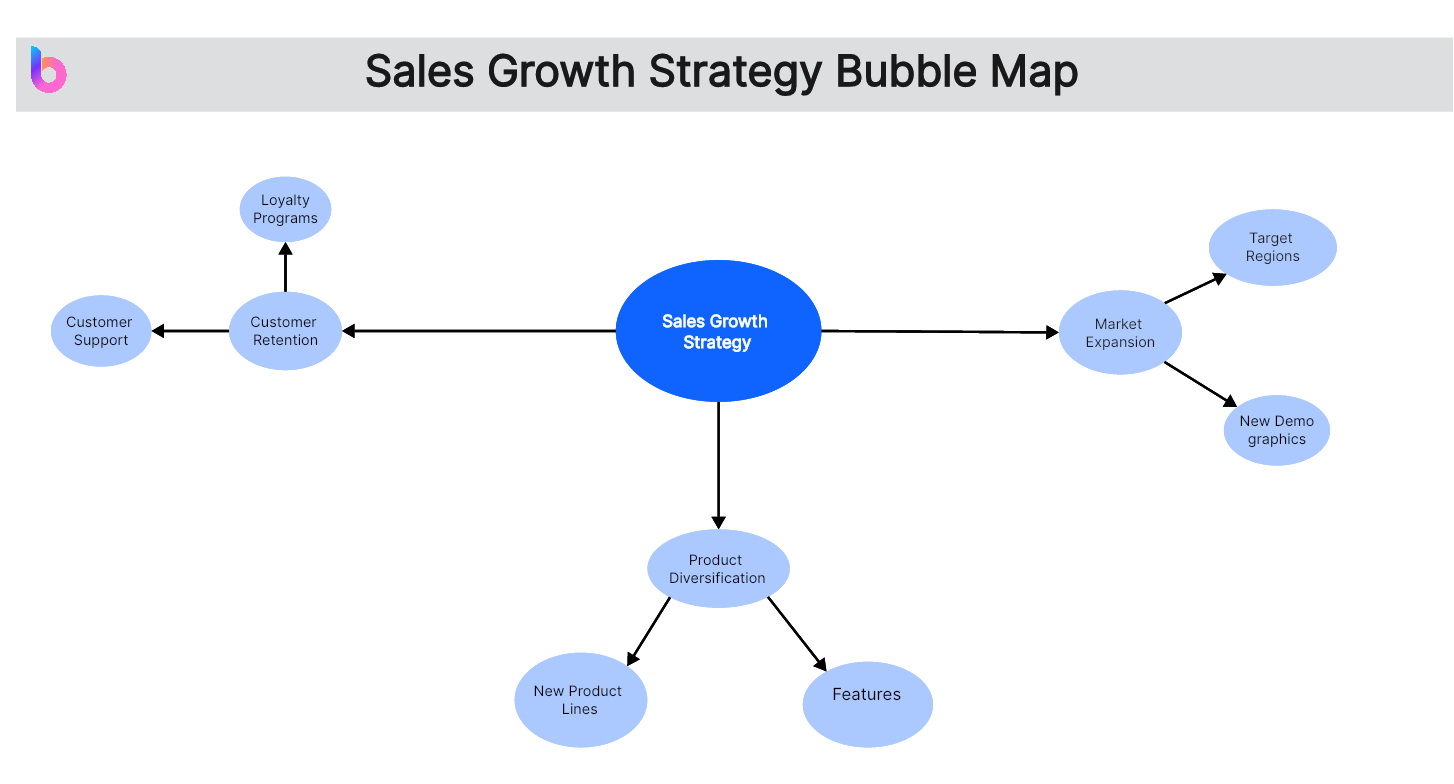
Sales Growth Strategy Bubble Map
This bubble map focuses on developing a comprehensive sales growth strategy. The main bubbles include Market Expansion, Product Diversification, and Customer Retention. Under Market Expansion, you can delve into specifics like Target Regions and New Demographics. Similarly, Product Diversification includes details about introducing New Product Lines and Features. The Customer Retention bubble can be expanded to include initiatives such as Loyalty Programs and Customer Support.
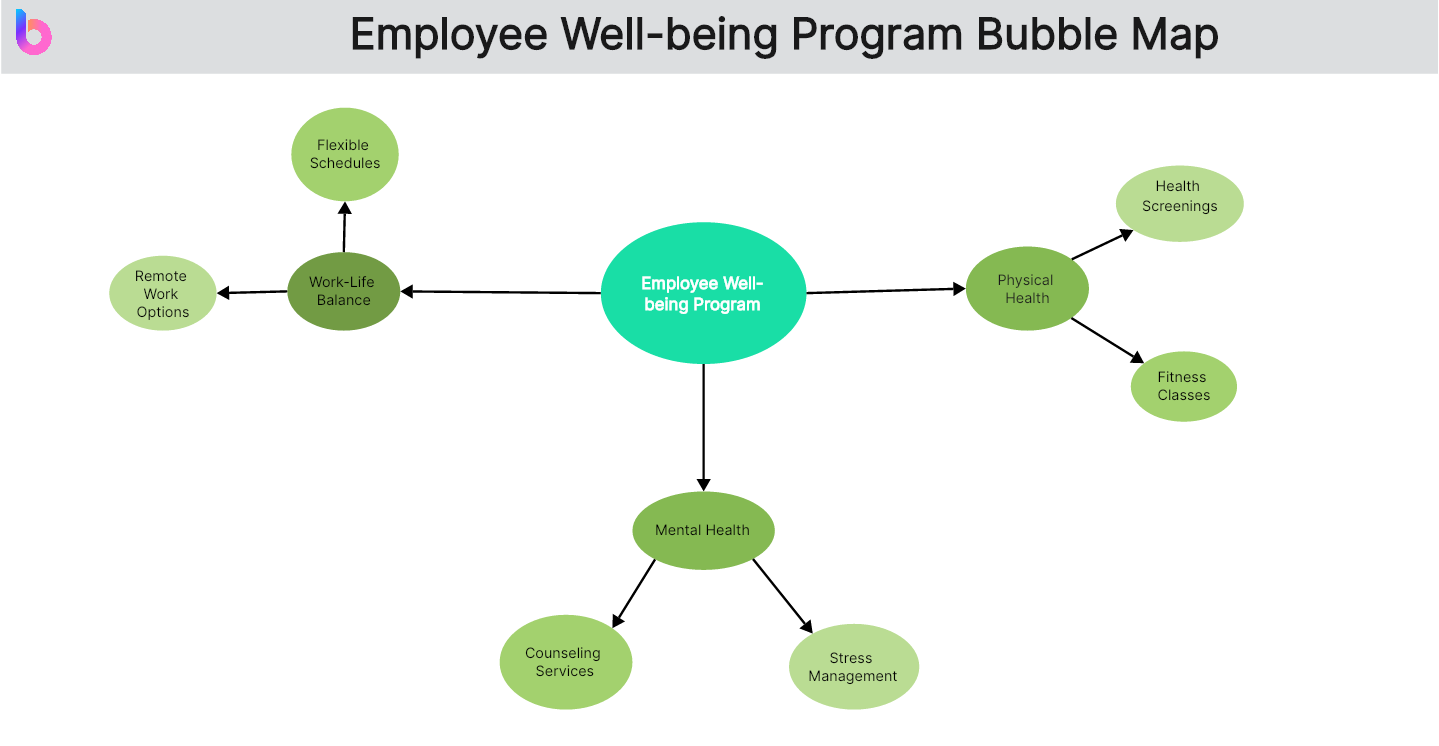
Employee Well-being Program Bubble Map
This bubble map revolves around creating an effective Employee Well-being Program. The main bubbles encompass Physical Health, Mental Health, and Work-Life Balance. For instance, under Physical Health, you can explore Fitness Classes and Health Screenings. Mental Health can be further detailed with offerings like Counseling Services and Stress Management. The Work-Life Balance bubble includes features like Flexible Schedules and Remote Work Options.
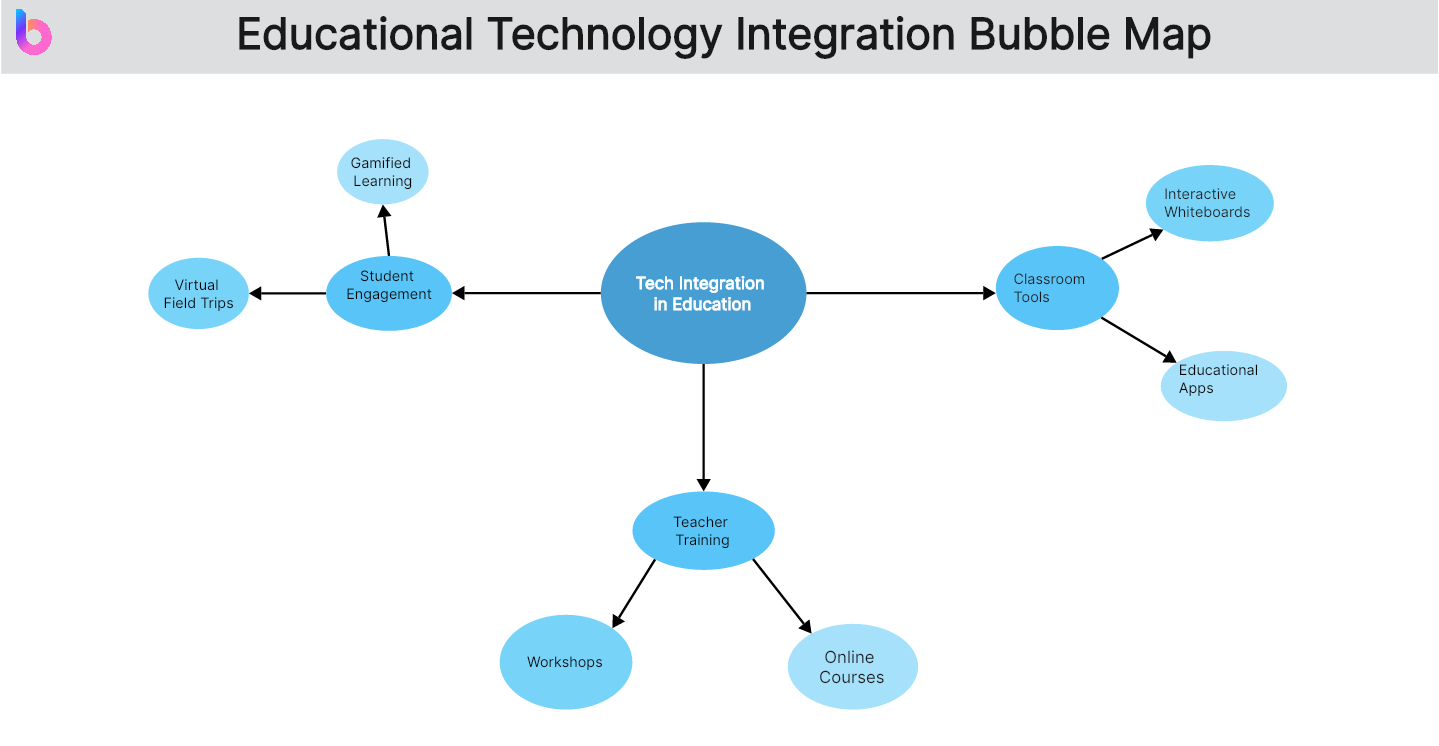
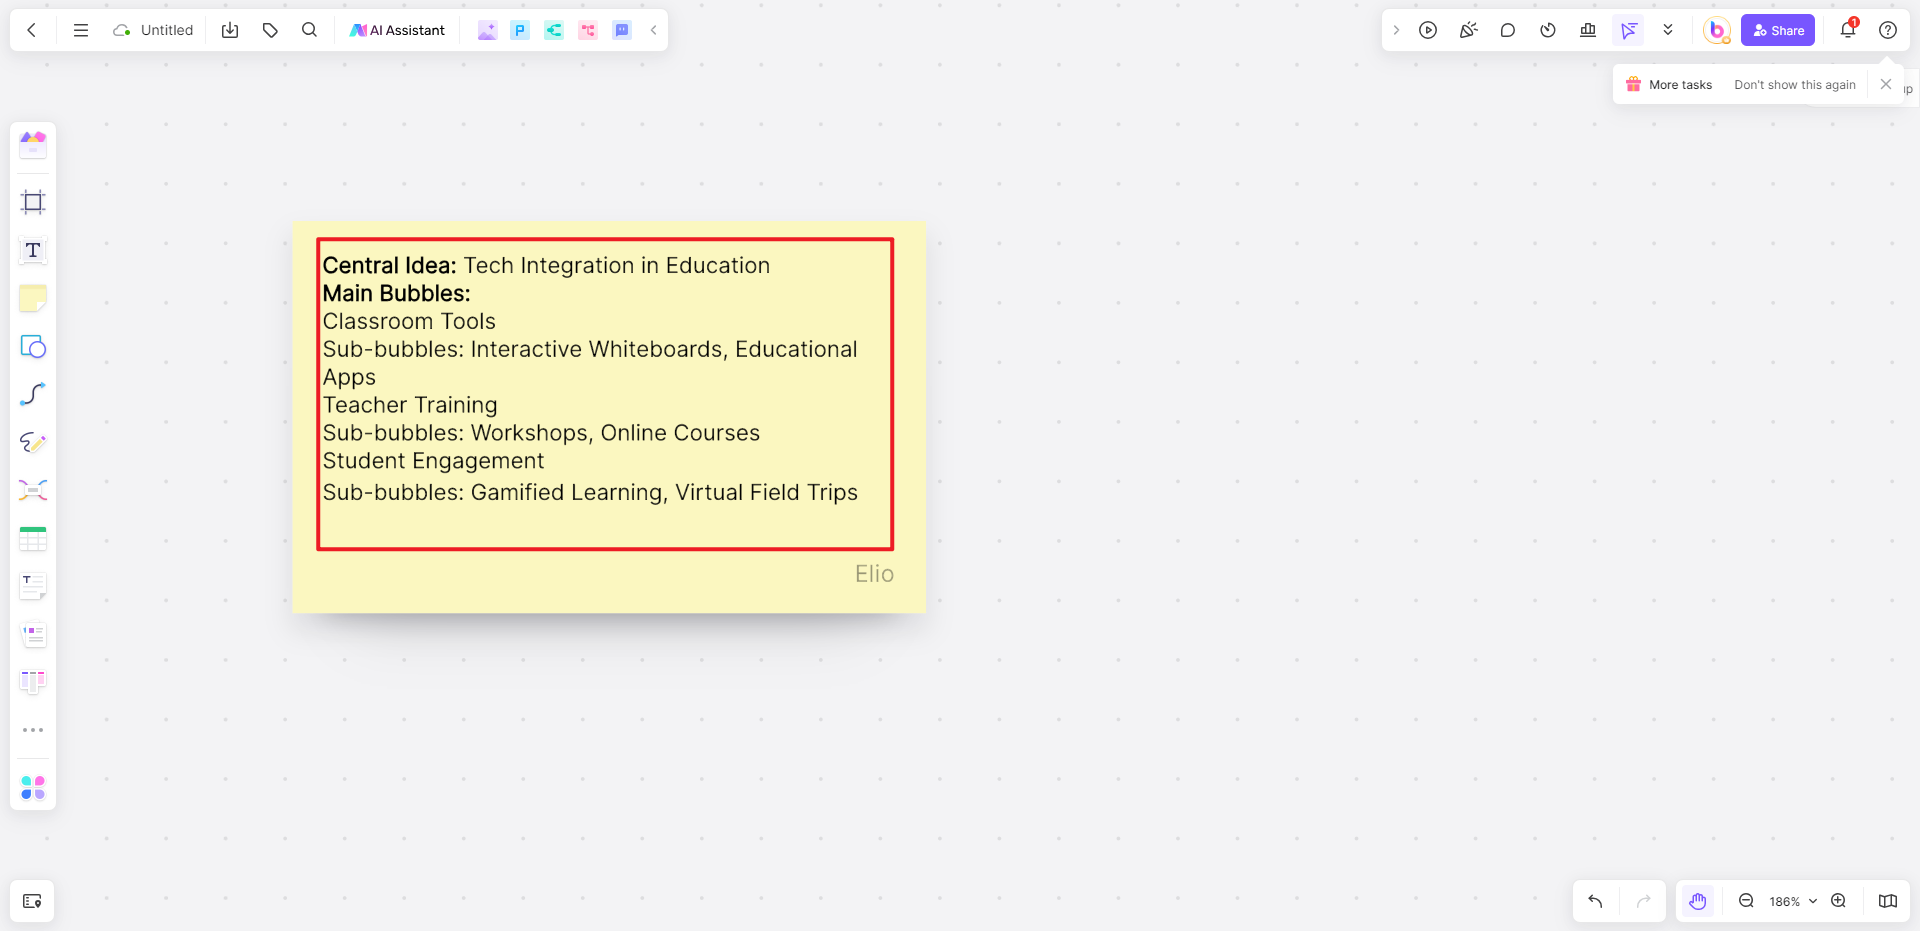
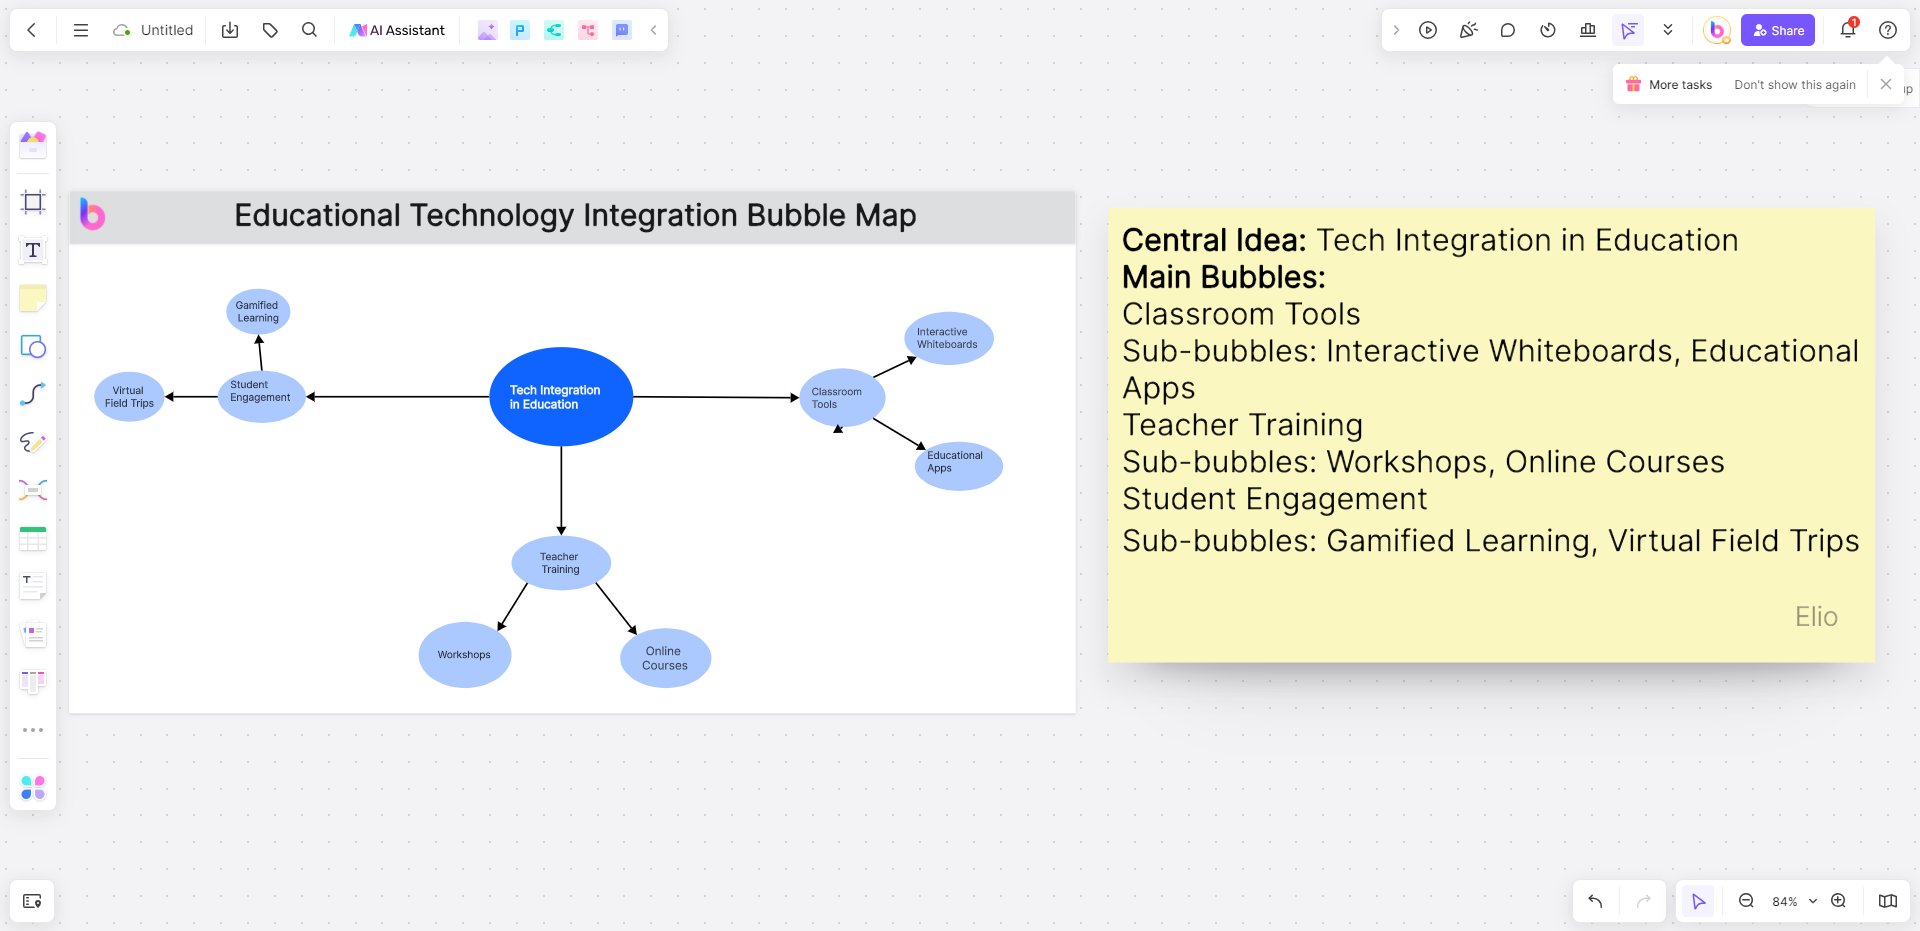
Educational Technology Integration Bubble Map
This bubble map outlines the integration of technology in education. The main bubbles consist of Classroom Tools, Teacher Training, and Student Engagement. Within Classroom Tools, you can specify Interactive Whiteboards and Educational Apps. Teacher Training may include details about workshops and online courses. Student Engagement can be broken down into components like Gamified Learning and Virtual Field Trips.
As these examples illustrate, Bubble Maps can transform complex multi-dimensional data into an easily interpretable visual format. By understanding the components and learning from practical implementations, we can harness the power of Bubble Mapping to glean profound insights across various disciplines and industries.
How to Make a Bubble Map with Template
Visual representation of data has become a norm in today's data-driven world, and bubble maps play a significant role in it. A bubble map offers a visually appealing way to display complex, multi-dimensional data. Boardmix, a well-renowned corporate management solution provider, offers an excellent template for creating bubble maps. Here's a detailed guide on how to make a bubble map using the Boardmix template.
Step 1: Gather Your Data
The first step in creating a bubble map is gathering and organizing your data. For a bubble map, you typically need data for at least three variables - the x-axis, y-axis, and the size of the bubbles. If you wish to add a fourth dimension to your map, you'll need another variable to denote bubble color.
Step 2: Access the Boardmix Bubble Map Template
After gathering and preparing your data, access the Boardmix platform and locate the bubble map template. The user-friendly interface of Boardmix makes it easy to find and select templates. Choose the Bubble Map template from the selection.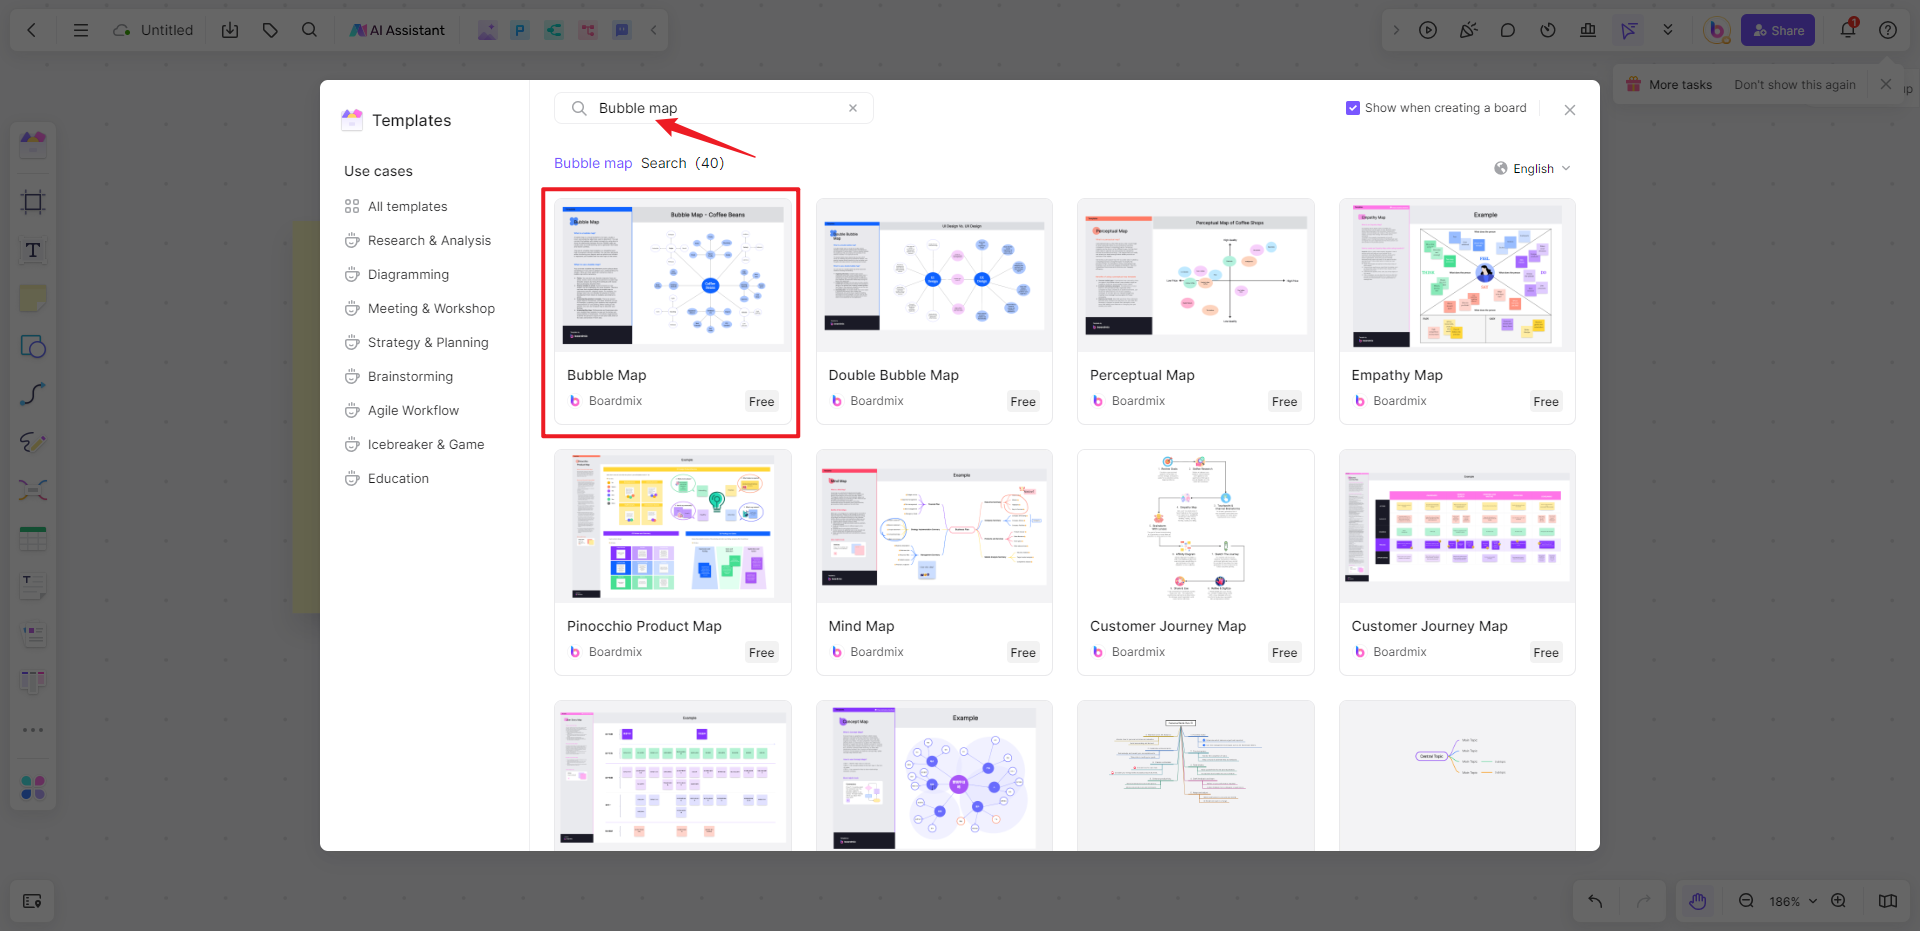
Step 3: Input Your Data
Once you've selected the bubble map template, it's time to input your data. You can do this by manually entering the values into the corresponding fields. Ensure that you've matched the right variables with the correct dimensions - x-axis, y-axis, bubble size, and (if applicable) bubble color.
Step 4: Customize Your Bubble Map
After feeding in your data, it's time to customize your map to match your requirements. You can adjust the sizes of the bubbles, choose different color schemes, and customize the labels for clarity and aesthetic appeal. Boardmix allows you to tweak several aspects of your map to best represent your data.
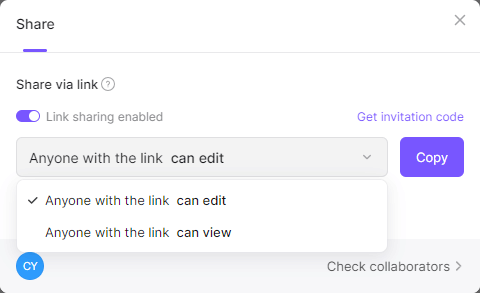
Step 5: Share Your Bubble Map
Finally, share your bubble map with other stakeholders. Boardmix allows you to share files via a link with specialized permission. In this way, you can work with others in real time and update the file regularly.
By using the Boardmix template, you can create a sophisticated, clear, and insightful bubble map with relative ease. This tool allows you to explore trends, relationships, and patterns in your data visually, making it easier to draw conclusions and make informed decisions. Just sign up and give it a try!
FAQ. What are bubble maps for brainstorming?
Bubble maps, also known as mind maps or concept maps, are a visual tool used for brainstorming and organizing ideas. They are effective in capturing and representing thoughts, concepts, and relationships in a non-linear and creative way. Here's how bubble maps work for brainstorming:
Central Idea or Topic
Start with a central idea or topic placed in the center of the map. This is the main concept around which your brainstorming will revolve.
Main Bubbles
Create main bubbles around the central idea, each representing a key aspect or category related to the topic. These main bubbles are like branches stemming from the central concept.
Sub-bubbles
Extend from each main bubble to create sub-bubbles. These sub-bubbles represent specific details, ideas, or subcategories related to the main concept. Sub-bubbles can be further expanded as needed.
Keywords and Images
Use keywords or short phrases within each bubble to capture essential information. You can also include images or symbols to enhance understanding and make the map visually engaging.
Connections
Connect bubbles with lines to show relationships between different ideas. Arrows or lines can indicate dependencies, influences, or the flow of concepts.
Color Coding
Use colors to differentiate between categories or highlight important points. This can make the map visually appealing and aid in organizing information.
Flexible and Non-linear
One of the strengths of bubble maps is their non-linear nature. Ideas can be added, rearranged, or expanded easily, allowing for a flexible and dynamic brainstorming process.
Collaboration
Bubble maps are great for collaborative brainstorming. Multiple team members can contribute ideas, and the visual representation helps everyone understand the connections between various concepts.
Review and Refinement
Periodically review the bubble map during the brainstorming session. Refine and reorganize ideas as needed to create a coherent and comprehensive representation of the topic.
Bubble maps are versatile and can be applied to various brainstorming scenarios, from project planning to creative problem-solving. They provide a structured yet flexible approach to organizing thoughts and fostering creativity.


