


In the realm of data visualization, a variety of chart types serve unique purposes based on the nature and volume of data at hand. One such chart type is the column chart, a widely-used tool for illustrating comparisons among distinct categories. This article will guide you through an understanding of column charts, their benefits, the various types, and how to create one. Let’s get started.
What Is a Column Chart
A column chart, also known as a vertical bar graph, is a graphical representation that utilizes rectangular bars to display and compare data. These bars are plotted vertically with the height equivalent to the data it represents.
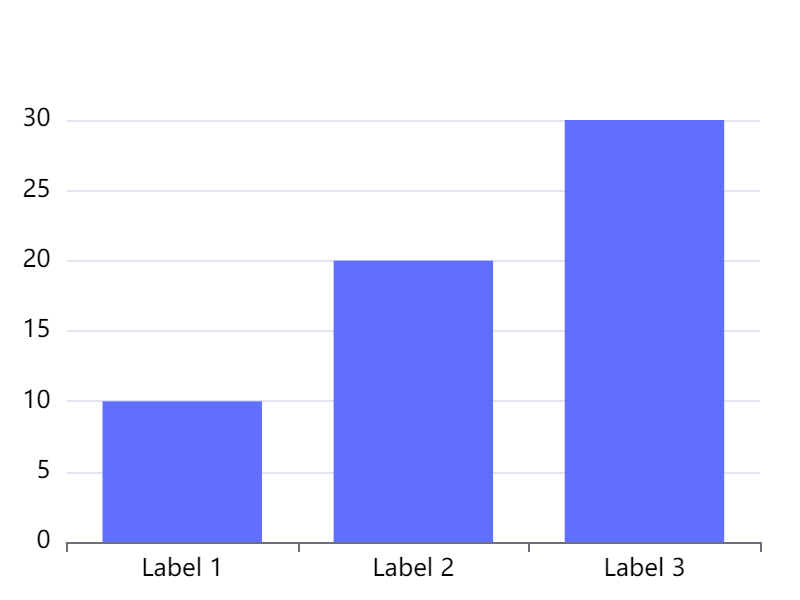
The x-axis, or horizontal axis, commonly lists the categories being compared, while the y-axis, or vertical axis, denotes the scale or values each category represents. These charts are highly effective when comparing a single category of data between individual sub-items.
Benefits of Column Charts
Column charts provide several advantages in data visualization:
- Easy to Interpret: The simplicity of column charts makes it easy for viewers to comprehend the information presented, regardless of their data literacy level.
- Effective Comparison Tool: With visual height variations in bars, column charts provide an immediate comparison between different categories.
- Versatility: They can be utilized in numerous areas such as sales reporting, survey results, and population growth analysis.
- Visual Clarity: As a visually intuitive tool, column charts can depict a narrative effectively in a limited space.
Types of Column Charts
There are several variations of column charts tailored for different data presentation needs:
- Standard Column Chart: Displays a single series of data in vertical bars.
- Stacked Column Chart: Displays multiple series of data in stacked vertical bars, showcasing the cumulative effect of multiple data series.
- 100% Stacked Column Chart: Similar to the stacked column chart but shows relative percentages at each column, not absolute values.
- Clustered Column Chart: Displays multiple series of data in grouped vertical bars, each of which corresponds to a specific category.
- 3D Column Chart: Adds a third dimension for a visual depth effect, though it may complicate data interpretation.
How to Make a Column Graph
Creating a column graph involves several steps:
Step 1. Compile the necessary data you wish to visualize and ensure it is accurate and sorted properly.
Step 2. Choose the type of column chart that best fits your data from standard, stacked, 100% stacked, clustered, or 3D options.
Step 3. Input your data into the chosen software's chart functionality, ensuring it aligns properly with the x-axis and y-axis.
Step 4. Customize your chart's design by adjusting color schemes, adding labels or titles, and modifying other visual elements for clarity and appeal.
Step 5. Review your completed chart to ensure it accurately represents your data and make any necessary adjustments.
In conclusion, column charts serve as an effective tool for displaying and comparing categorical data. By choosing the appropriate column chart type and ensuring accurate data input and visualization, you can leverage this tool to deliver powerful data narratives.
A Versatile Column Graph Maker You Should Try - Boardmix
Data visualization has become a necessity in today's data-driven world. With a myriad of tools available, finding one that is versatile, user-friendly, and powerful can be a challenge. One tool that fits the bill and stands out among its peers is Boardmix, a potent column graph maker. This part will delve into the features and benefits of using Boardmix for creating engaging and insightful column graphs.
Boardmix - An Overview
Boardmix is an innovative and versatile graph maker that enables you to create and design column graphs with ease. Designed with a user-friendly interface, it simplifies the process of chart creation and makes it accessible to users of all skill levels. Whether you are a student, an educator, a researcher, or a business professional, Boardmix has got you covered.

Why Choose Boardmix
There are several reasons why Boardmix stands out as an excellent choice for creating column graphs:
- Easy to Use: With its intuitive interface, you can create your graph in minutes. The drag-and-drop feature allows for easy placement and adjustment of columns in your chart.
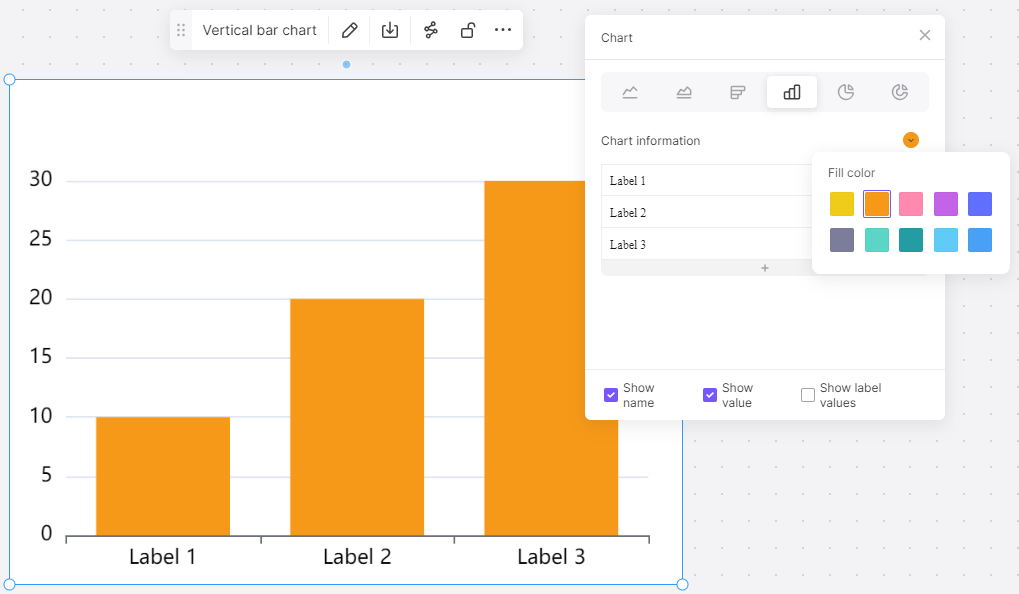
- Customizable: Boardmix offers extensive customization options. You can modify the colors, sizes, and styles of your columns, add labels, and customize the axes to make your graph unique.
- Versatility: Whether you need a simple column chart or a more complex stacked column chart, Boardmix can handle it all.
- Shareable: Boardmix provides options to export your graphs in various formats or share them directly via email or social media.
- Support and Resources: Comprehensive resources and support are available to help you navigate and use the tool effectively.
Creating Column Graphs with Boardmix
Creating a column graph with Boardmix is a straightforward process:
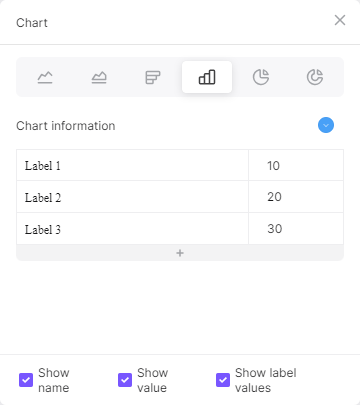
Choose Graph Type: Begin by selecting 'Column Graph' from the variety of graph types available. To do it, you can create a new board, click the 3-dot menu from the left sidebar, choose ‘Chart’ and find the one you like.

Import Data: importing your data into Boardmix. The software supports data import from various formats such as CSV, XLSX, and more.
Customize Your Graph: Customize your graph by adjusting the colors, adding labels, setting the axes scales, and more.
Review and Share: Once your graph is ready, you can preview it before sharing or exporting. Boardmix allows for one-click sharing on various platforms or exporting in multiple formats for use in reports or presentations.

To sum up, if you're looking for a versatile, powerful yet easy-to-use tool for creating column graphs, look no further than Boardmix. With its rich features and user-friendly design, it simplifies data visualization while empowering you to create insightful and engaging column graphs.


