As businesses and projects become increasingly complex, there is a growing need for tools that facilitate clear, concise communication and understanding of processes. Among the various visual tools available, one stands out for its ability to depict the process flow across different functional units or teams within an organization - the cross functional flowchart. This comprehensive guide will walk you through the concept, usage, benefits, symbols and creation steps of cross functional flowcharts. Keep reading.
What Is a Cross Functional Flowchart
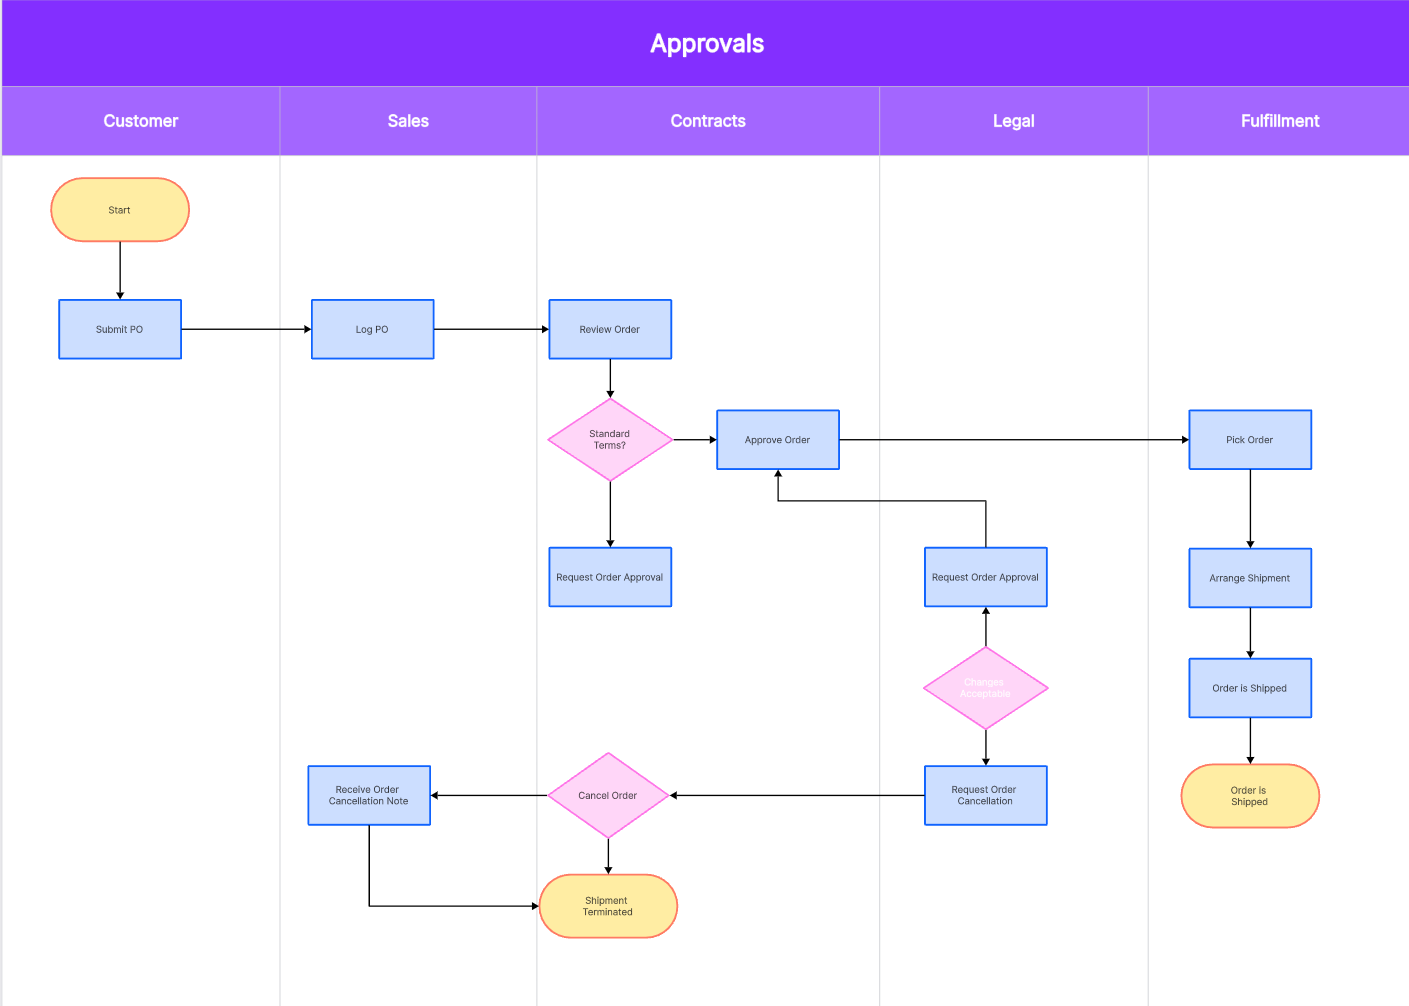
A cross functional flowchart, also known as a swimlane diagram or process map, is a type of flowchart that visually represents a process while clearly delineating the responsibilities of different departments or roles within an organization.
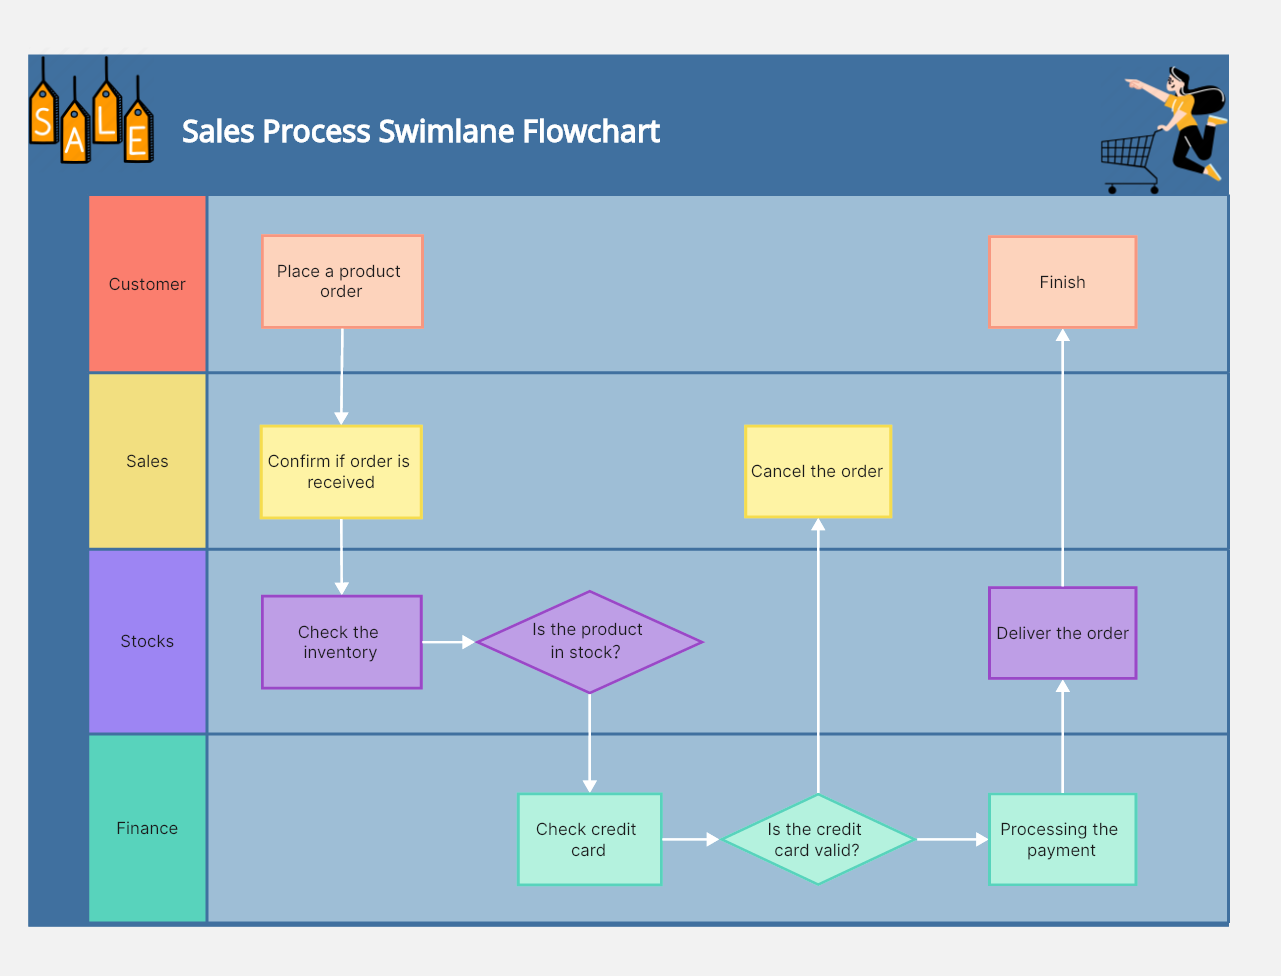
Each 'swimlane' in this diagram represents a different department or role. The tasks and activities associated with each are located within their respective swimlane, creating a comprehensive picture of who does what in a particular process.
By offering a bird's eye view of the process and clearly marking out responsibilities, cross functional flowcharts help eliminate ambiguity and foster better understanding among all stakeholders.
When to Use a Cross Functional Flowchart
Cross functional flowcharts can be useful in a variety of situations:
- Process Analysis: They help visualize and understand processes across various departments or roles.
- Problem Identification: By illustrating the entire process, they can highlight bottlenecks or issues that might be hampering efficiency.
- Training: They serve as an excellent training resource for new employees to understand processes and their role in them.
- Process Improvement: They provide a clear snapshot of the process, which is essential when planning process improvement initiatives.
Benefits of Cross Functional Flowcharts
Using cross functional flowcharts provides numerous benefits:
- Clear Communication: These flowcharts clearly define roles and responsibilities, minimizing confusion and promoting clear communication.
- Increased Efficiency: They can identify bottlenecks or inefficiencies in the process, which can then be addressed to boost efficiency.
- Improved Collaboration: By providing visibility into tasks managed by other teams, these charts promote cross-departmental understanding and collaboration.
- Better Decision Making: A thorough understanding of the process leads to informed decision making.
Cross Functional Flow Diagram Symbols
There are several standard symbols used in cross functional flowcharts:
- Rectangles: Represent steps or tasks in the process.
- Diamonds: Indicate decision points.
- Arrows: Denote the direction of workflow.
- Ovals: Signify the start or end of a process.
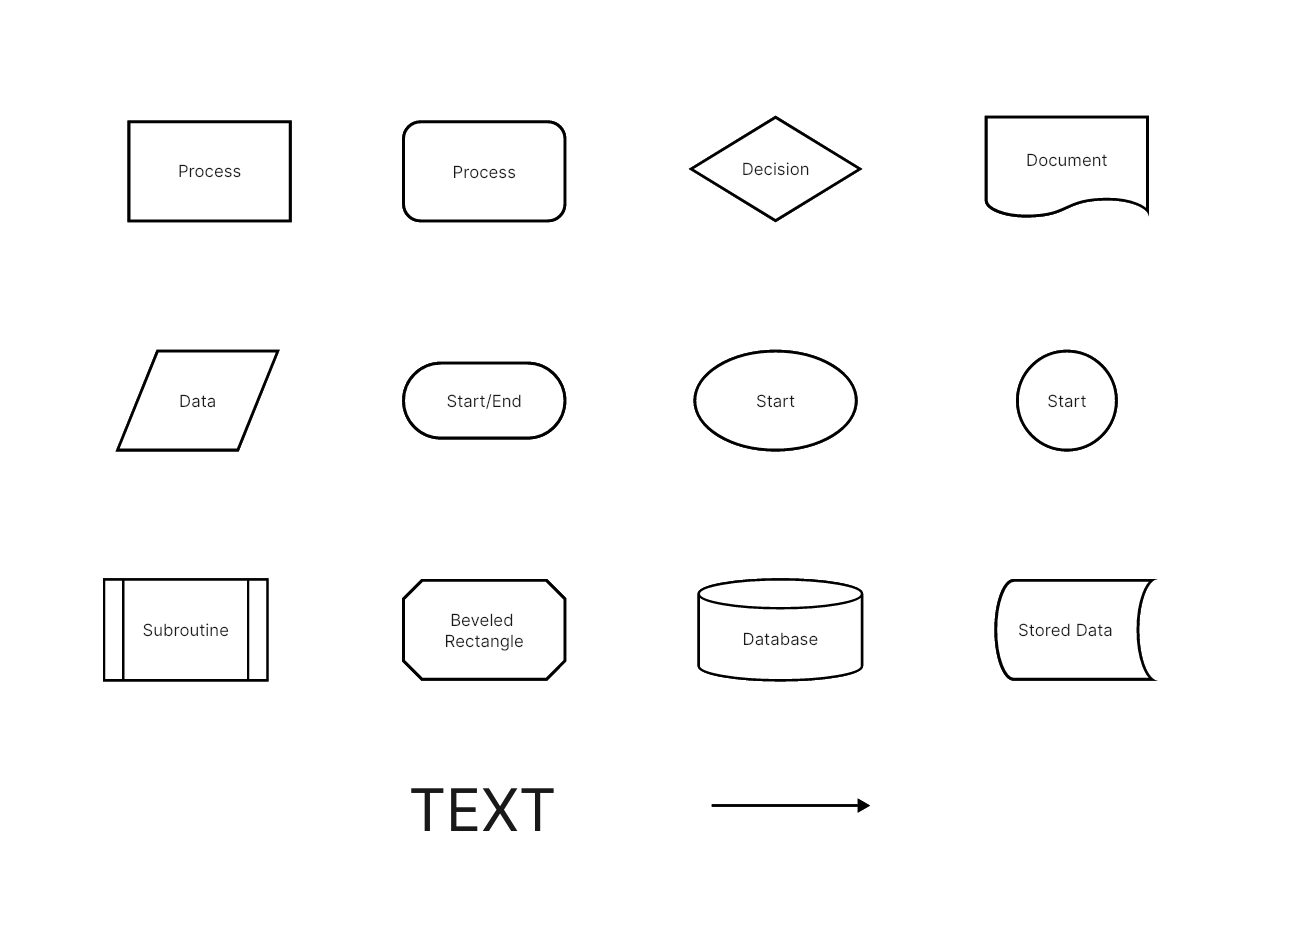
In addition to these, swimlanes (horizontal or vertical lines) are used to separate different functional units involved in the process.
Cross functional flowcharts are invaluable tools that offer deep insight into your organization's processes. With a clear visual representation, roles and responsibilities become easy to understand, paving the way for improved communication, enhanced efficiency, and informed decision making.
How to Make a Cross Functional Flowchart in Boardmix
Designed to foster team collaboration, Boardmix offers a broad array of features tailored to meet your organization's specific needs. Its user-friendly interface makes it easy even for those with minimal technical skills to design detailed and comprehensive cross-functional flowcharts.
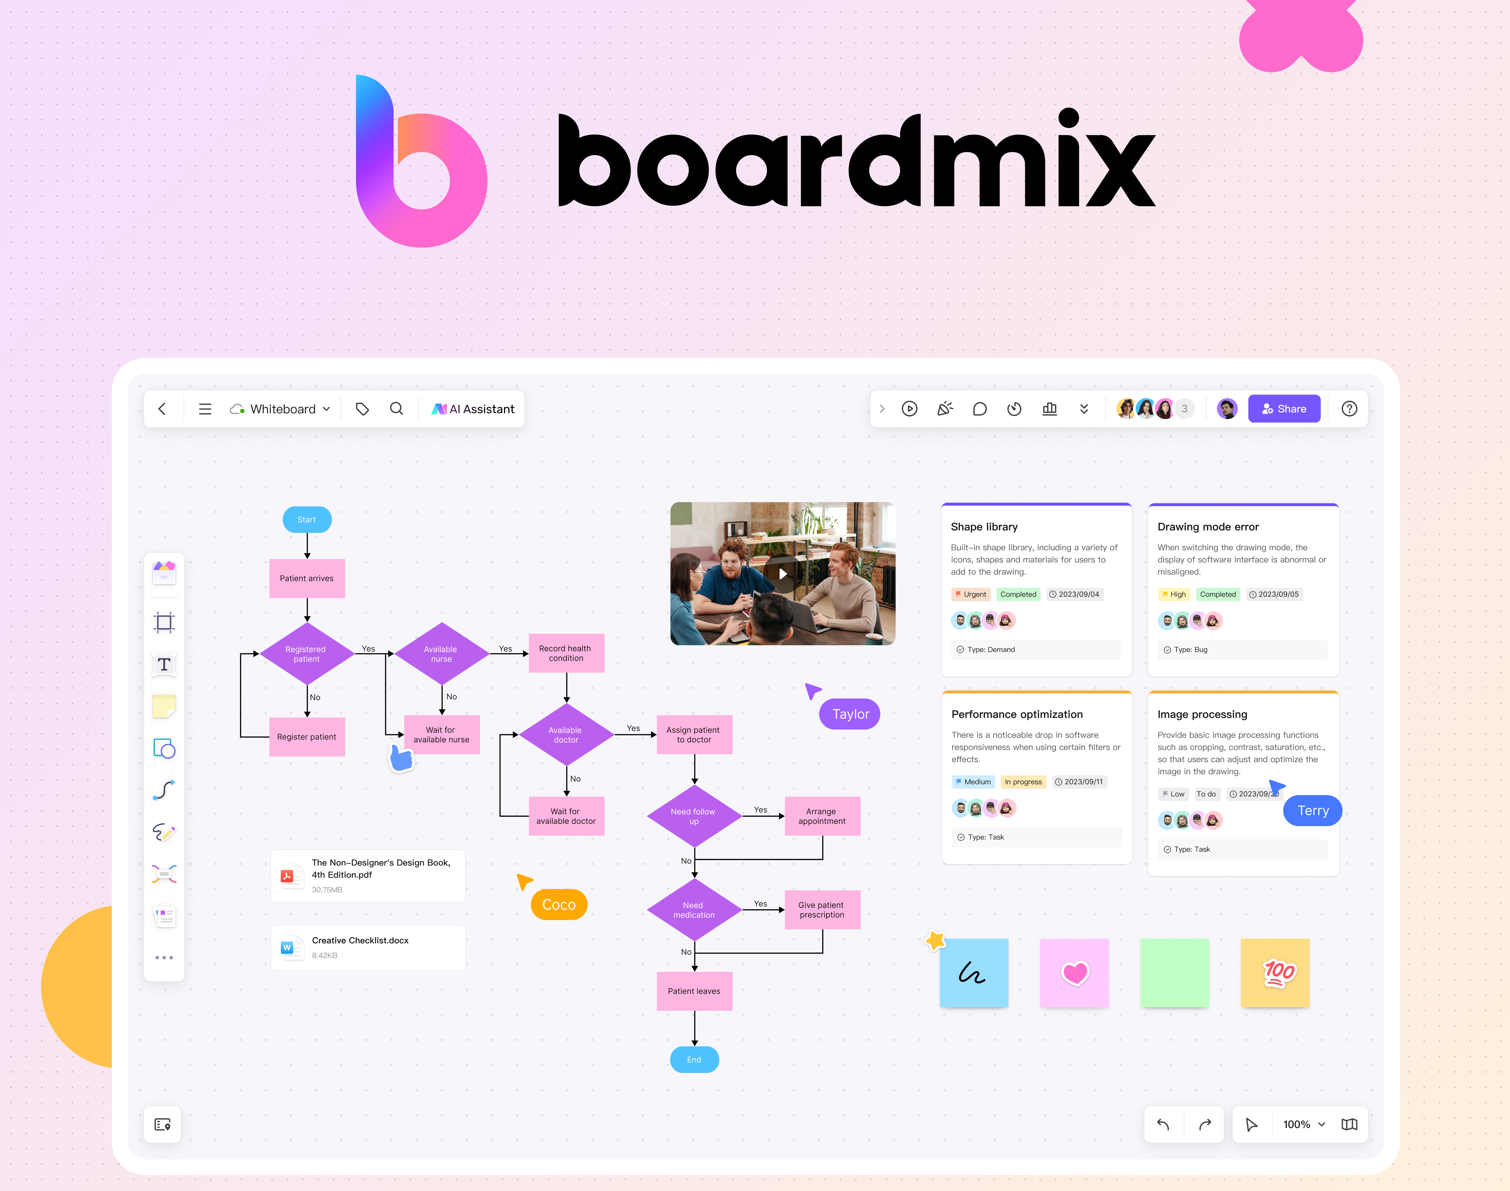
Creating a cross-functional flowchart in Boardmix involves several steps, which we will discuss in this section. However, note that although we outline a general procedure here, the process may slightly vary based on your specific requirements.
Step 1: Create a New Board
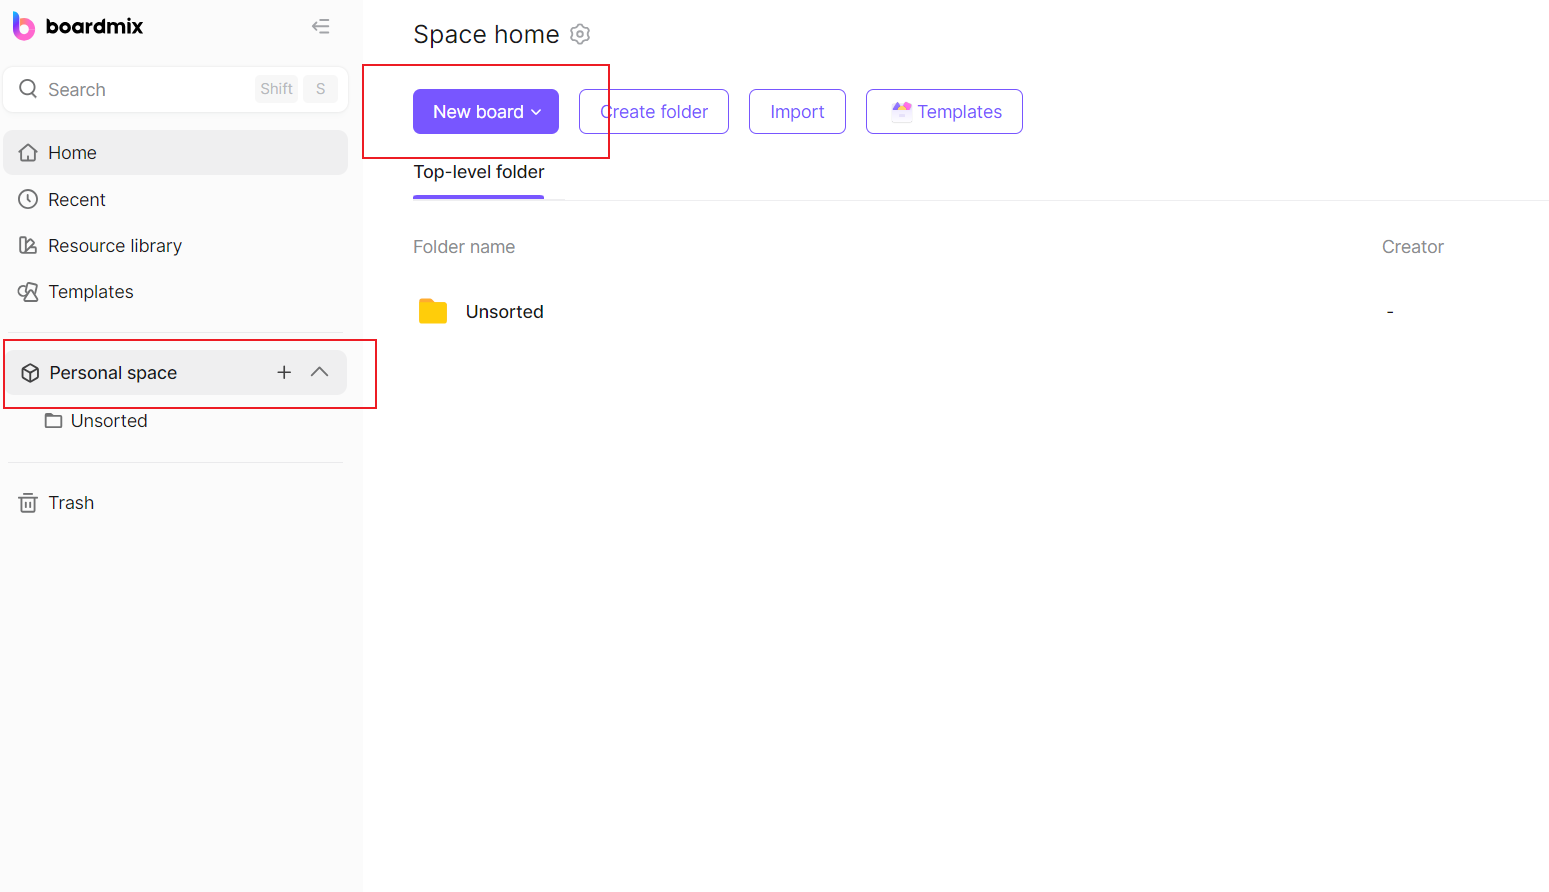
Firstly, launch Boardmix and create a new board. Select "Swimlane Flowchart" from the "Templates" section to get started with an appropriately tailored workspace. You can also choose to start from scratch by opening a new blank board and using shapes based on your needs.
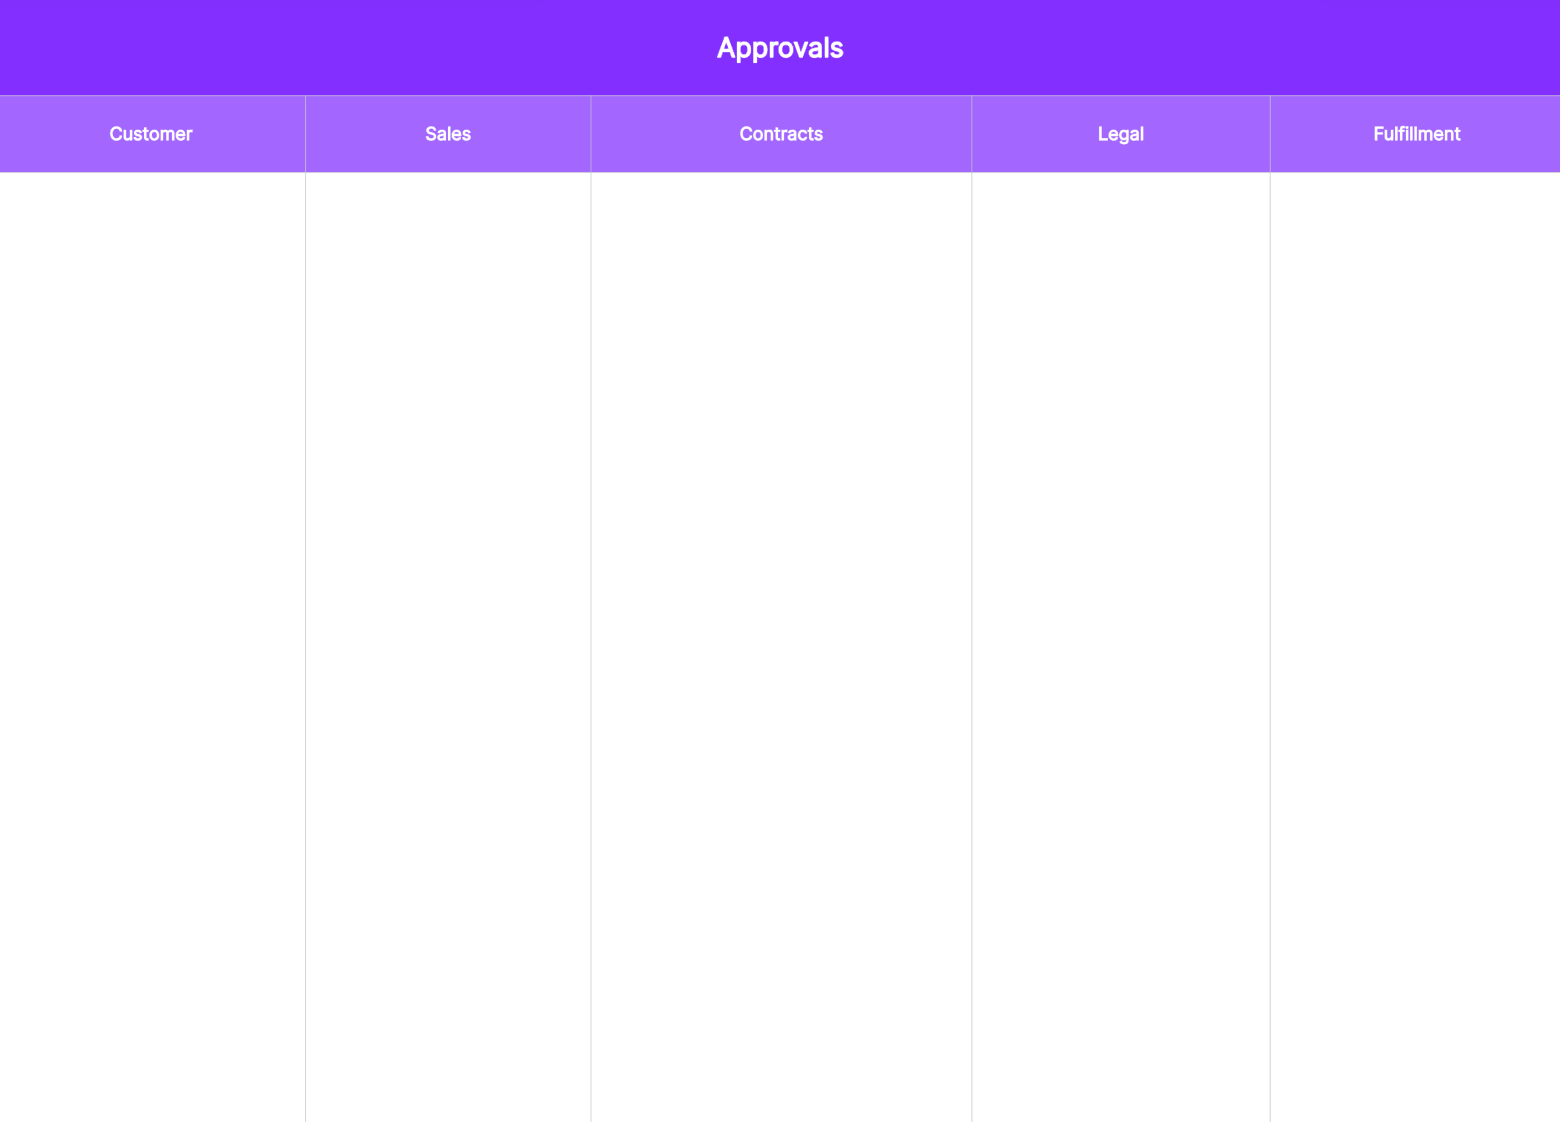
Step 2: Identify and Assign Swimlanes
Begin by identifying the departments or roles involved in your process. For each, create a swimlane using the swimlane tool. Label them accurately to avoid confusion during later stages.
Step 3: Map Out Your Process
Map out your process by listing all the steps, decisions, and their order of execution. A clear understanding of the process makes it easier to translate it into a flowchart.
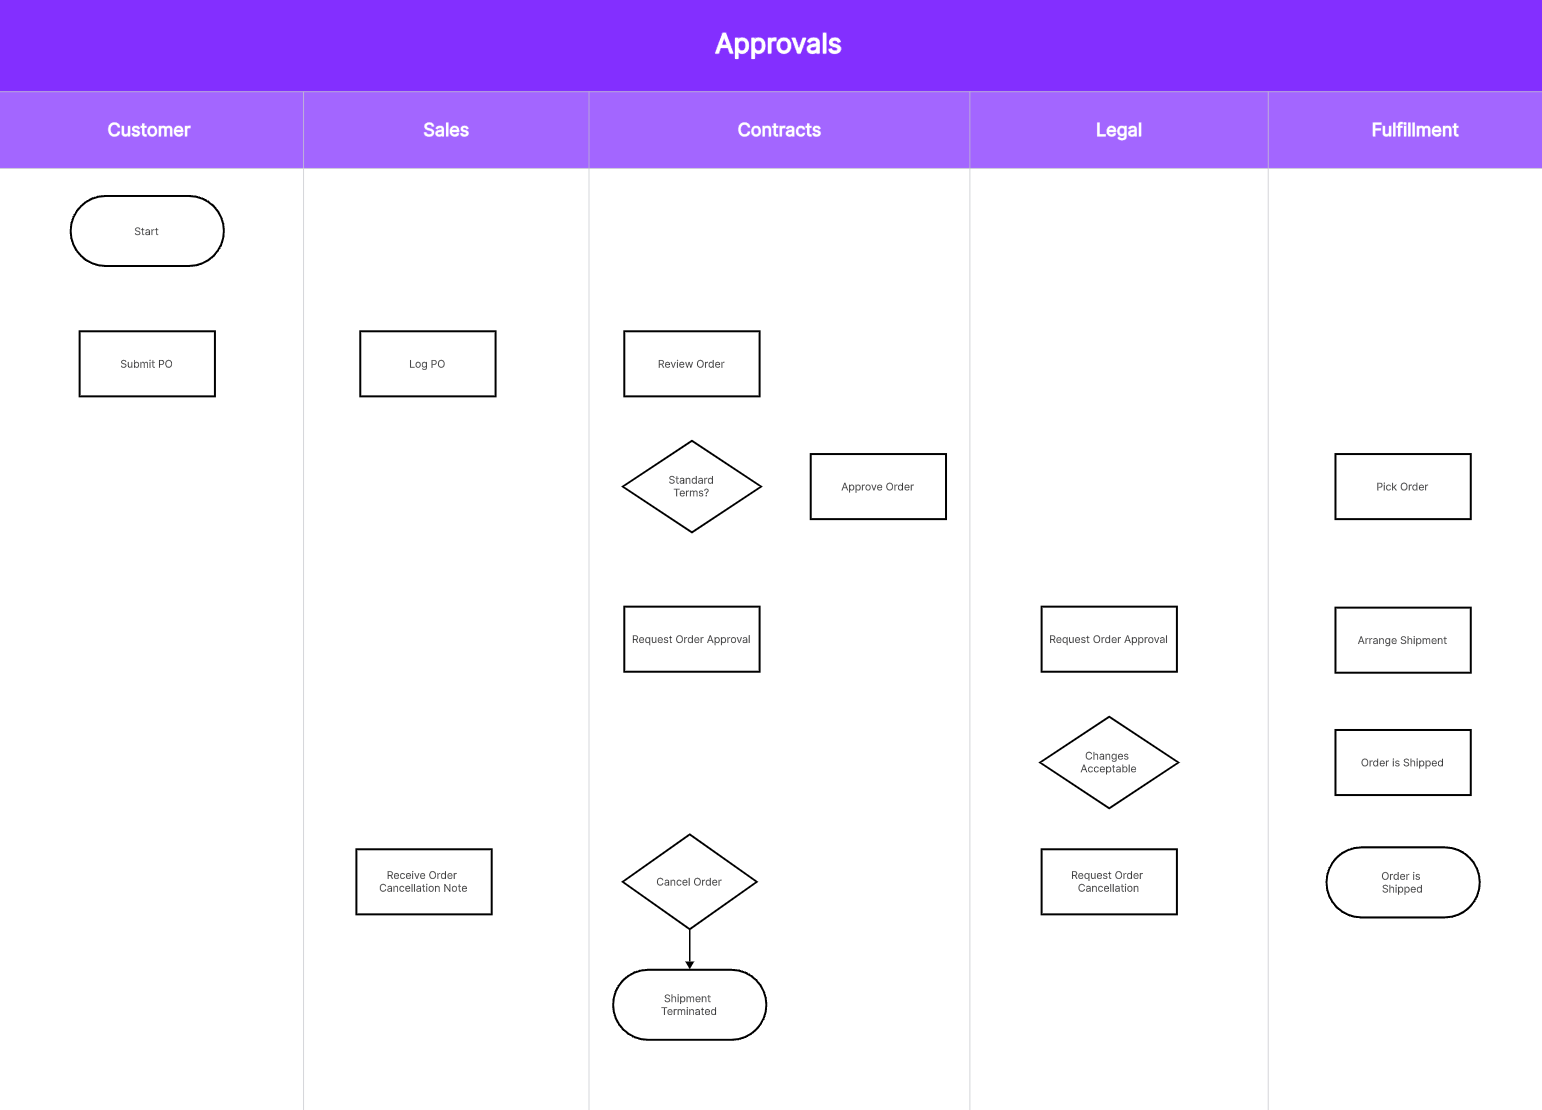
Step 4: Drag and Drop Symbols
Boardmix offers an array of symbols suitable for various process steps. From tasks to decision points, drag and drop the relevant symbols onto their respective swimlanes.
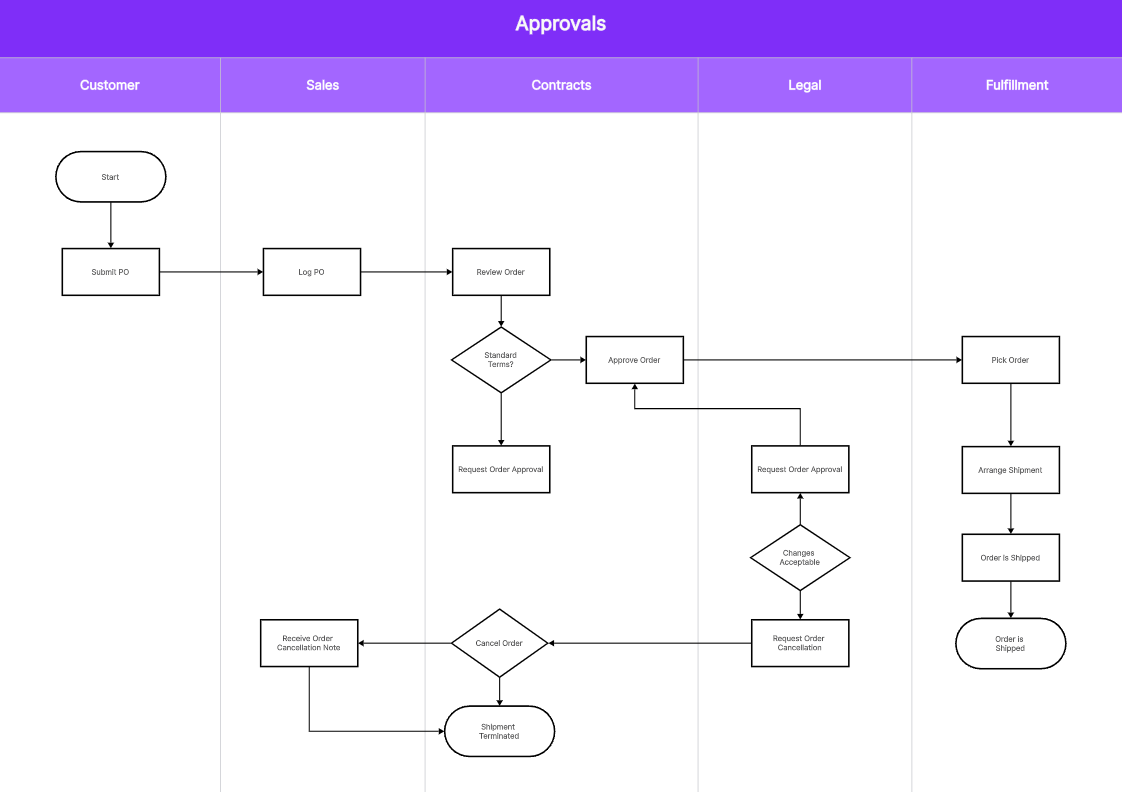
Step 5: Connect the Symbols with Arrows
Use arrows to show the process flow from one step to another. Pay attention to ensuring that arrows connect each symbol in the right sequence.
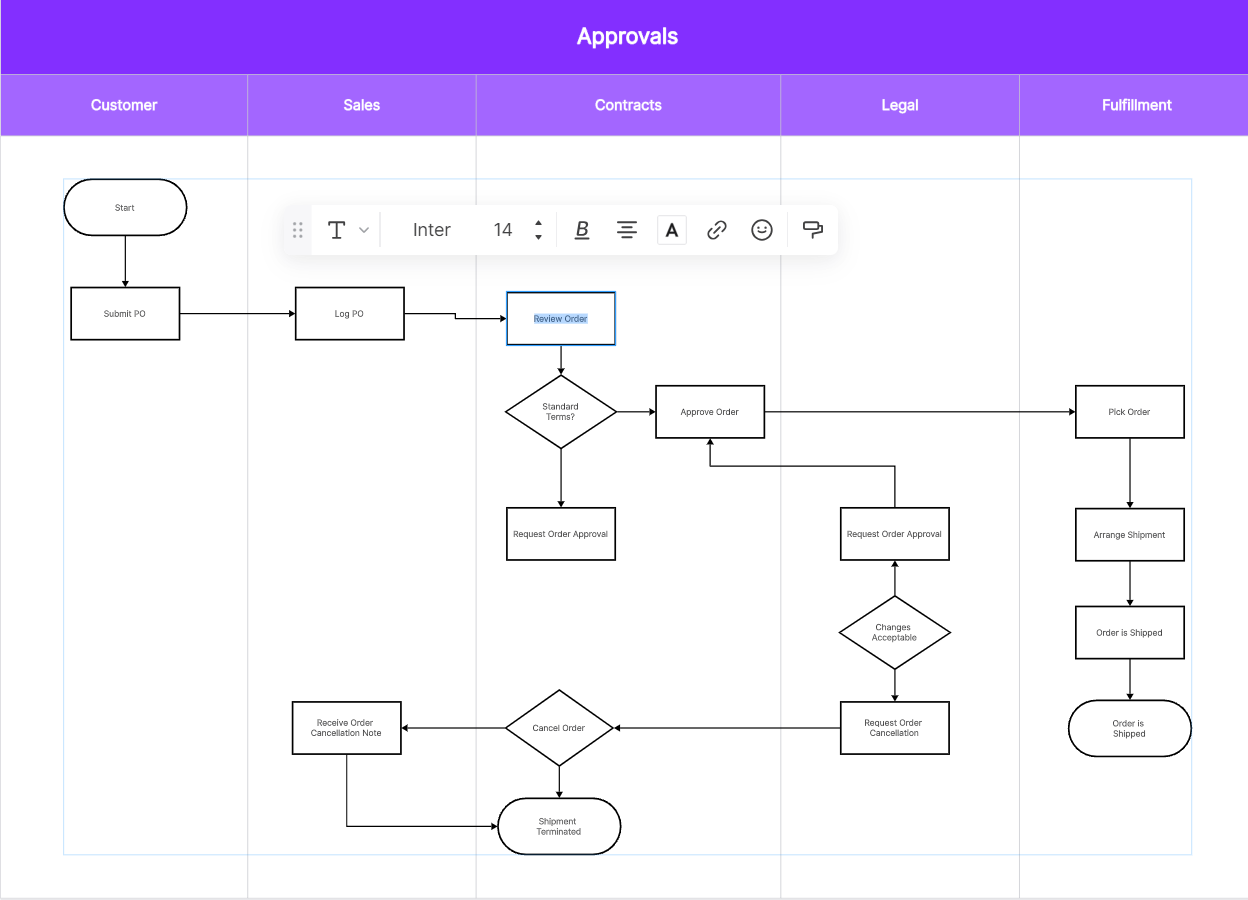
Step 6: Label Each Symbol
For clarity, it's essential to label each symbol based on the step or decision it represents. Double-click on the symbol to add text.
Step 7: Customize Your Flowchart
Boardmix provides options for customization. Enhance your flowchart with different colors, sizes, or fonts for better visual impact and clarity.
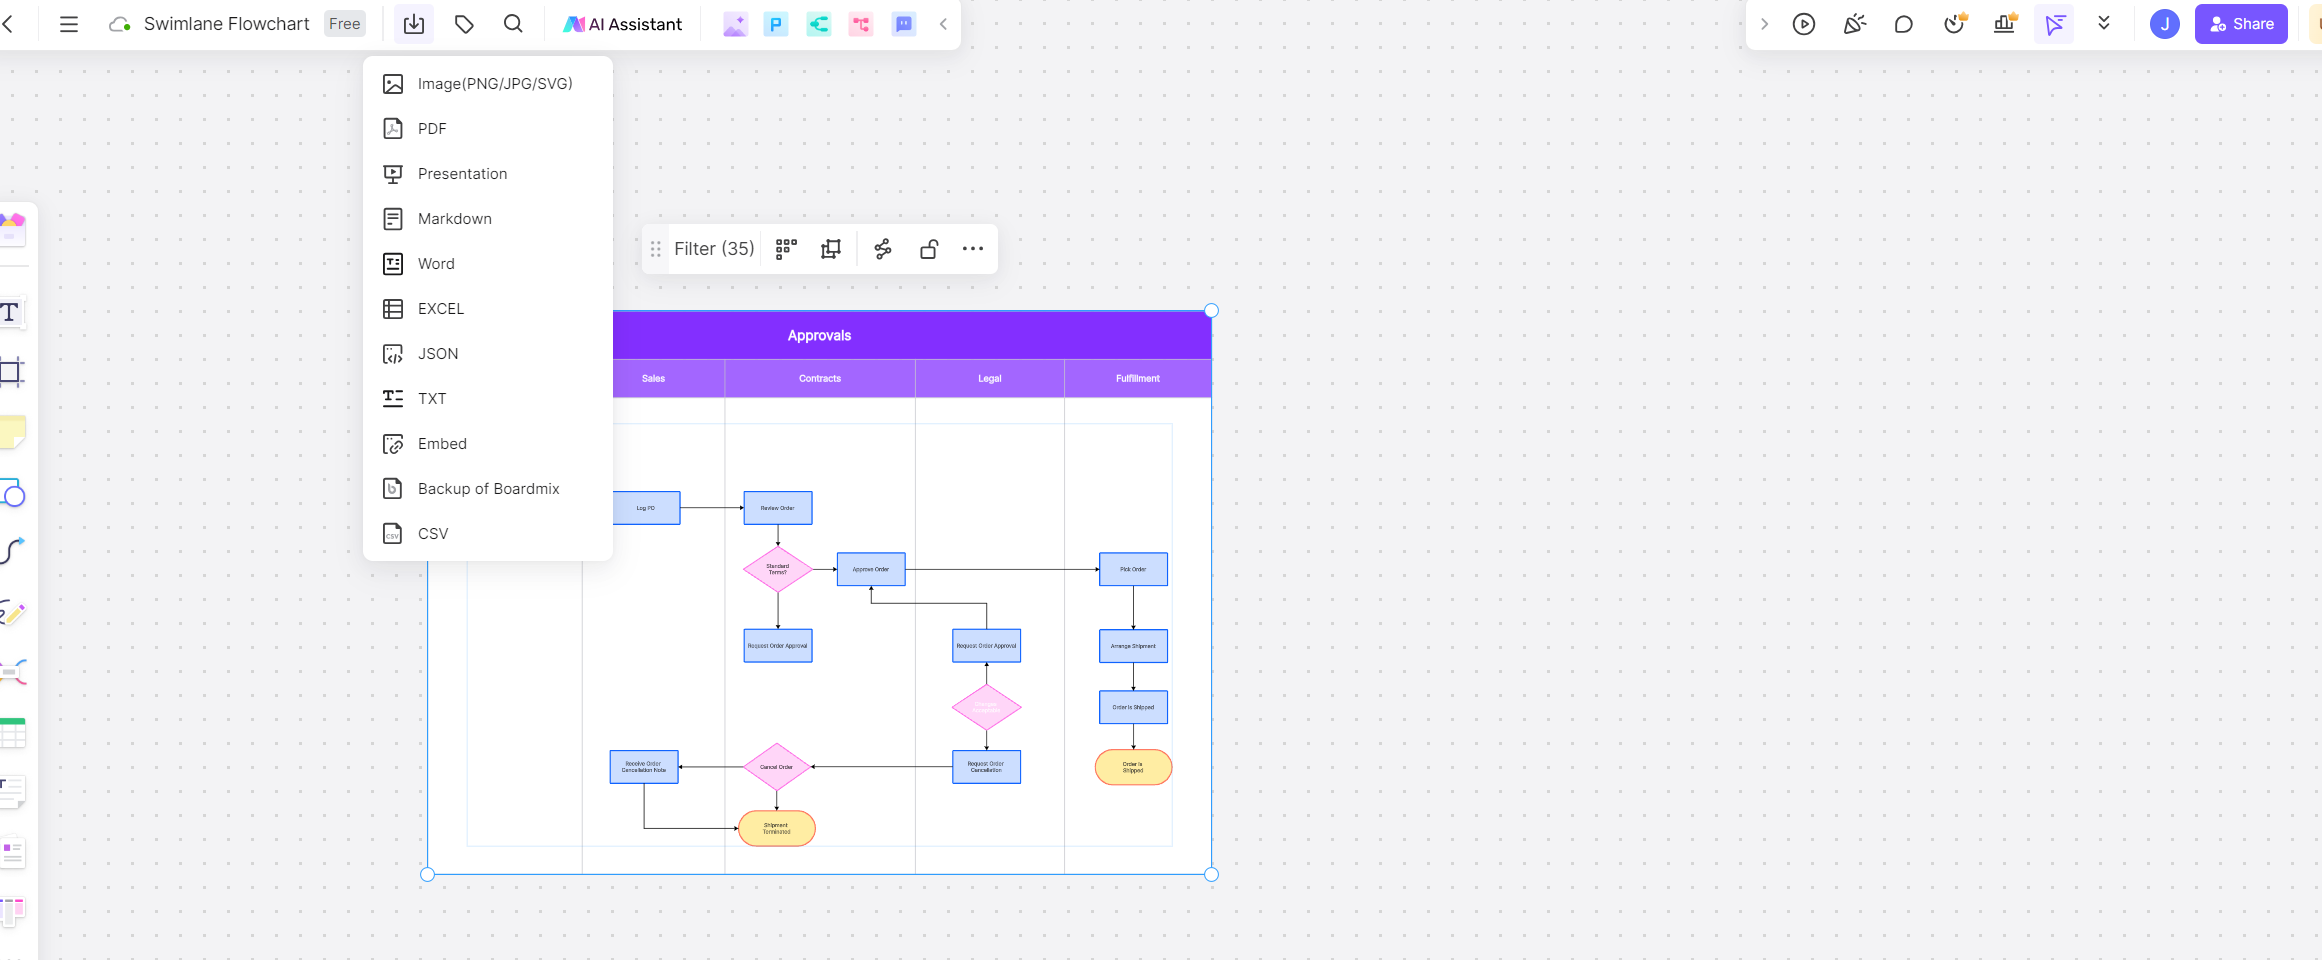
Step 8: Save, Share or Export Your Flowchart
Finally, save your file. Share your flowchart with team members for collaboration or feedback. You can also export your chart in various formats for presentations or record-keeping.
Creating a cross functional flowchart in Boardmix not only enhances communication and understanding but also facilitates efficient and streamlined processes across different teams or departments within an organization.
Best Practices for Cross Functional Flowcharts
Creating a cross-functional flowchart is a task that demands strategic thinking, meticulous planning, and clear communication. Below are some best practices to ensure that your cross-functional flowchart is not only detailed and comprehensive but also effective in achieving its intended purpose.
Start with High-Level Processes
When beginning to design your flowchart, it's crucial to start with high-level processes before drilling down into specific tasks and steps. This approach offers a broader view of the overall process, making it easier to understand how each function or department contributes to the final outcome.
Incorporate Color Coding
Utilizing different colors for distinct departments or stages can significantly enhance your flowchart's visual appeal and readability. Color coding can help team members quickly identify their tasks and responsibilities, boosting efficiency and productivity.
Clearly Define Tasks and Roles
Each task within the flowchart should be clearly defined, and roles and responsibilities assigned for each function should be explicitly stated. This clarity fosters accountability and ensures every team member understands their role in the process.
Use Arrows Wisely
Arrows play a crucial role in cross-functional flowcharts as they depict the direction of workflow. However, avoid overcomplicating your diagram with too many intersecting arrows. Instead, use them sparingly and strategically to indicate the flow of tasks between different departments.
Regularly Update the Flowchart
As business processes evolve over time, so should your cross-functional flowcharts. Regular updates are necessary to ensure they accurately reflect the current state of operations. Remember, a flowchart that isn't up-to-date can lead to confusion, inefficiency, and potential mistakes.
Solicit Feedback from Team Members
The individuals involved in the depicted process are often the best sources of information when it comes to improving your flowchart. Therefore, regularly solicit feedback from your team members and make necessary adjustments based on their input.
Simplify Complex Processes
If a process seems too complex, it might be worth breaking it down into smaller sub-processes. This strategy can help improve the flowchart's readability and make it easier for team members to understand their tasks and responsibilities.
By adopting these best practices when creating a cross-functional flowchart in Boardmix, you can ensure that your diagram is accurate, easy-to-understand, and effective in optimizing business operations across various departments within your organization.


