


In the world of e-commerce, efficiency is paramount. Understanding the flow of information within an online shopping system can lead to significant improvements in customer satisfaction and business performance. This is where Data Flow Diagrams (DFDs) come in handy. A DFD for an online shopping system serves as a valuable tool to visualize and understand the various data flows and processes involved in online transactions.
In this article, you’ll learn every aspect of a DFD for online shopping to have a deeper understanding of it. Meanwhile, a detailed guide on making one will be introduced. Keep reading.
What Is a Data Flow Diagram for Online Shopping
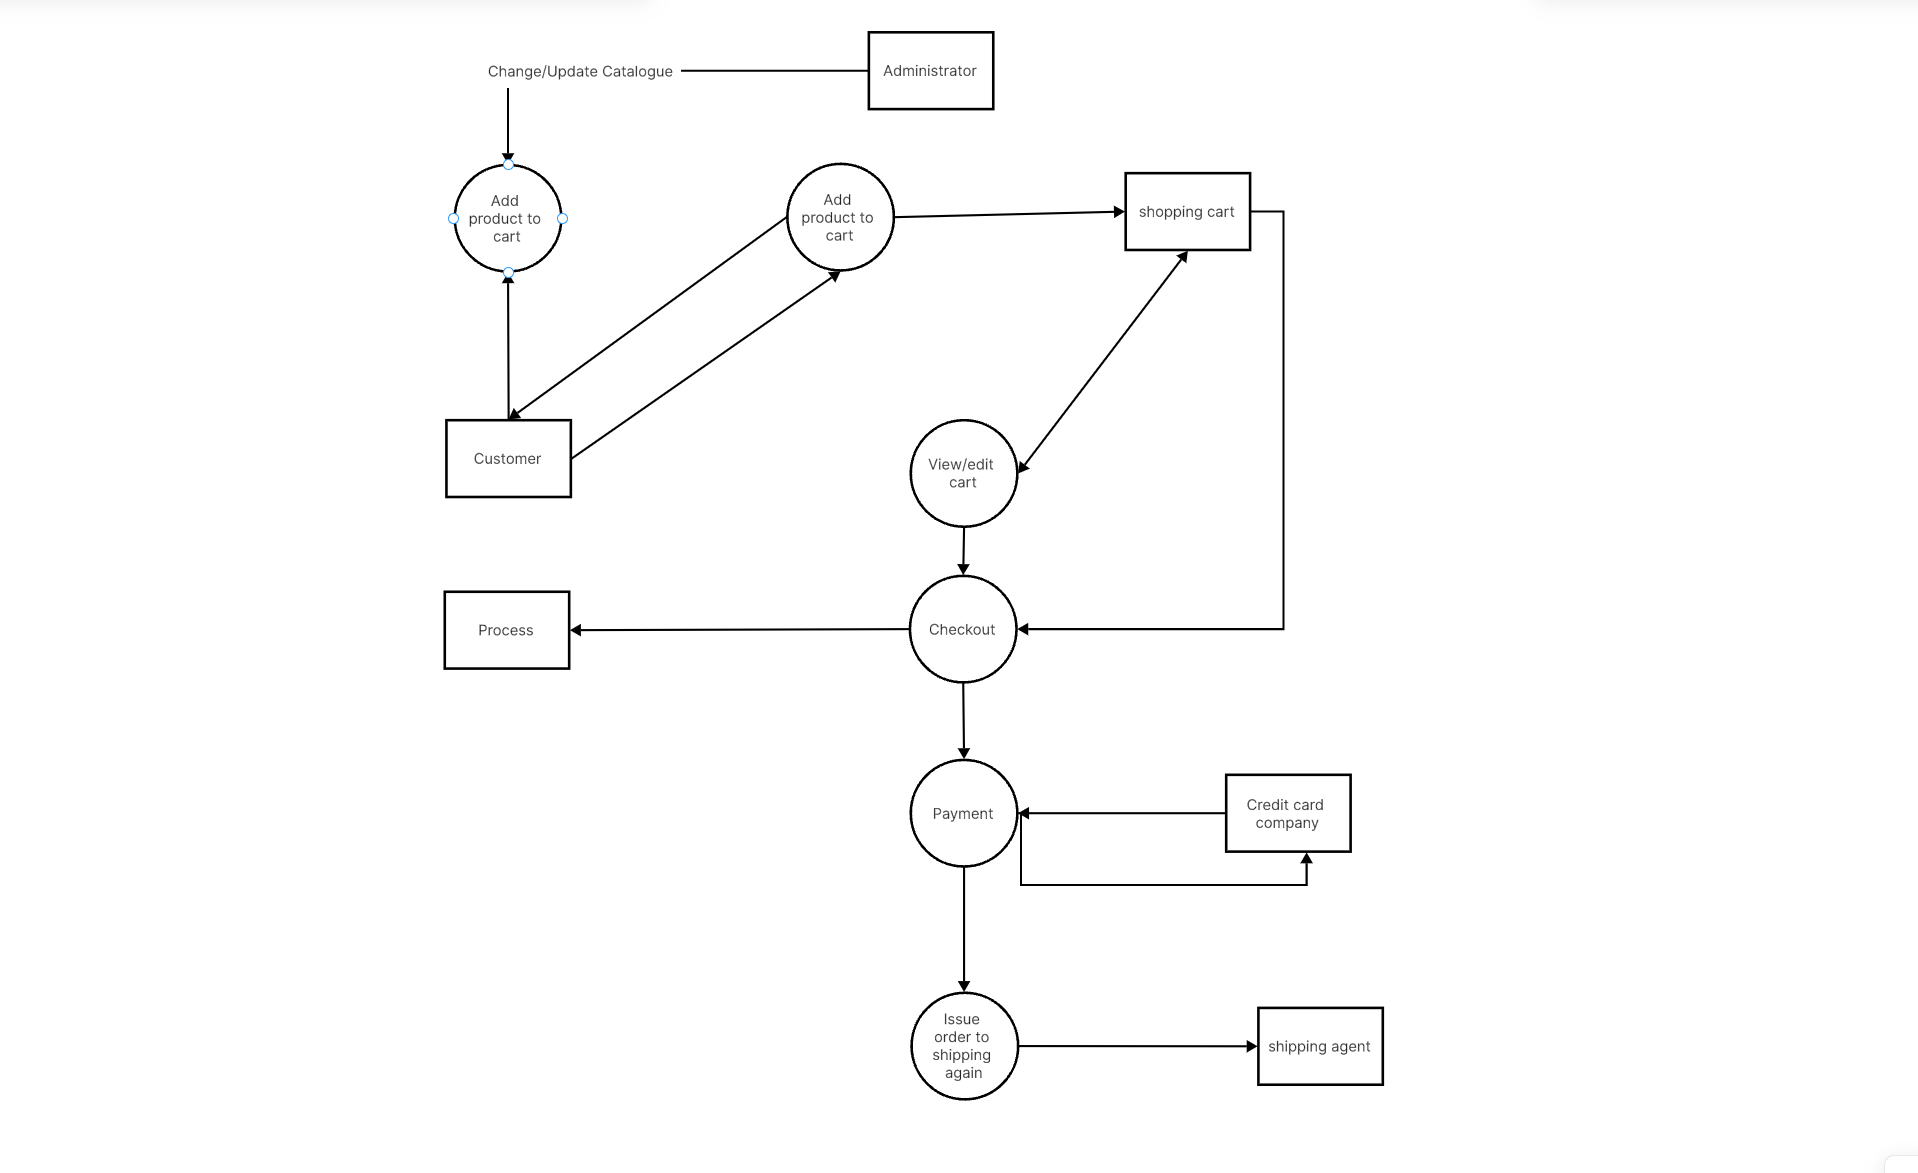
A Data Flow Diagram (DFD) is a graphical representation used to depict the flow of data through a system. In the context of an online shopping system, it shows how data moves between different components, such as the customer, shopping cart, inventory database, payment gateway, and others.
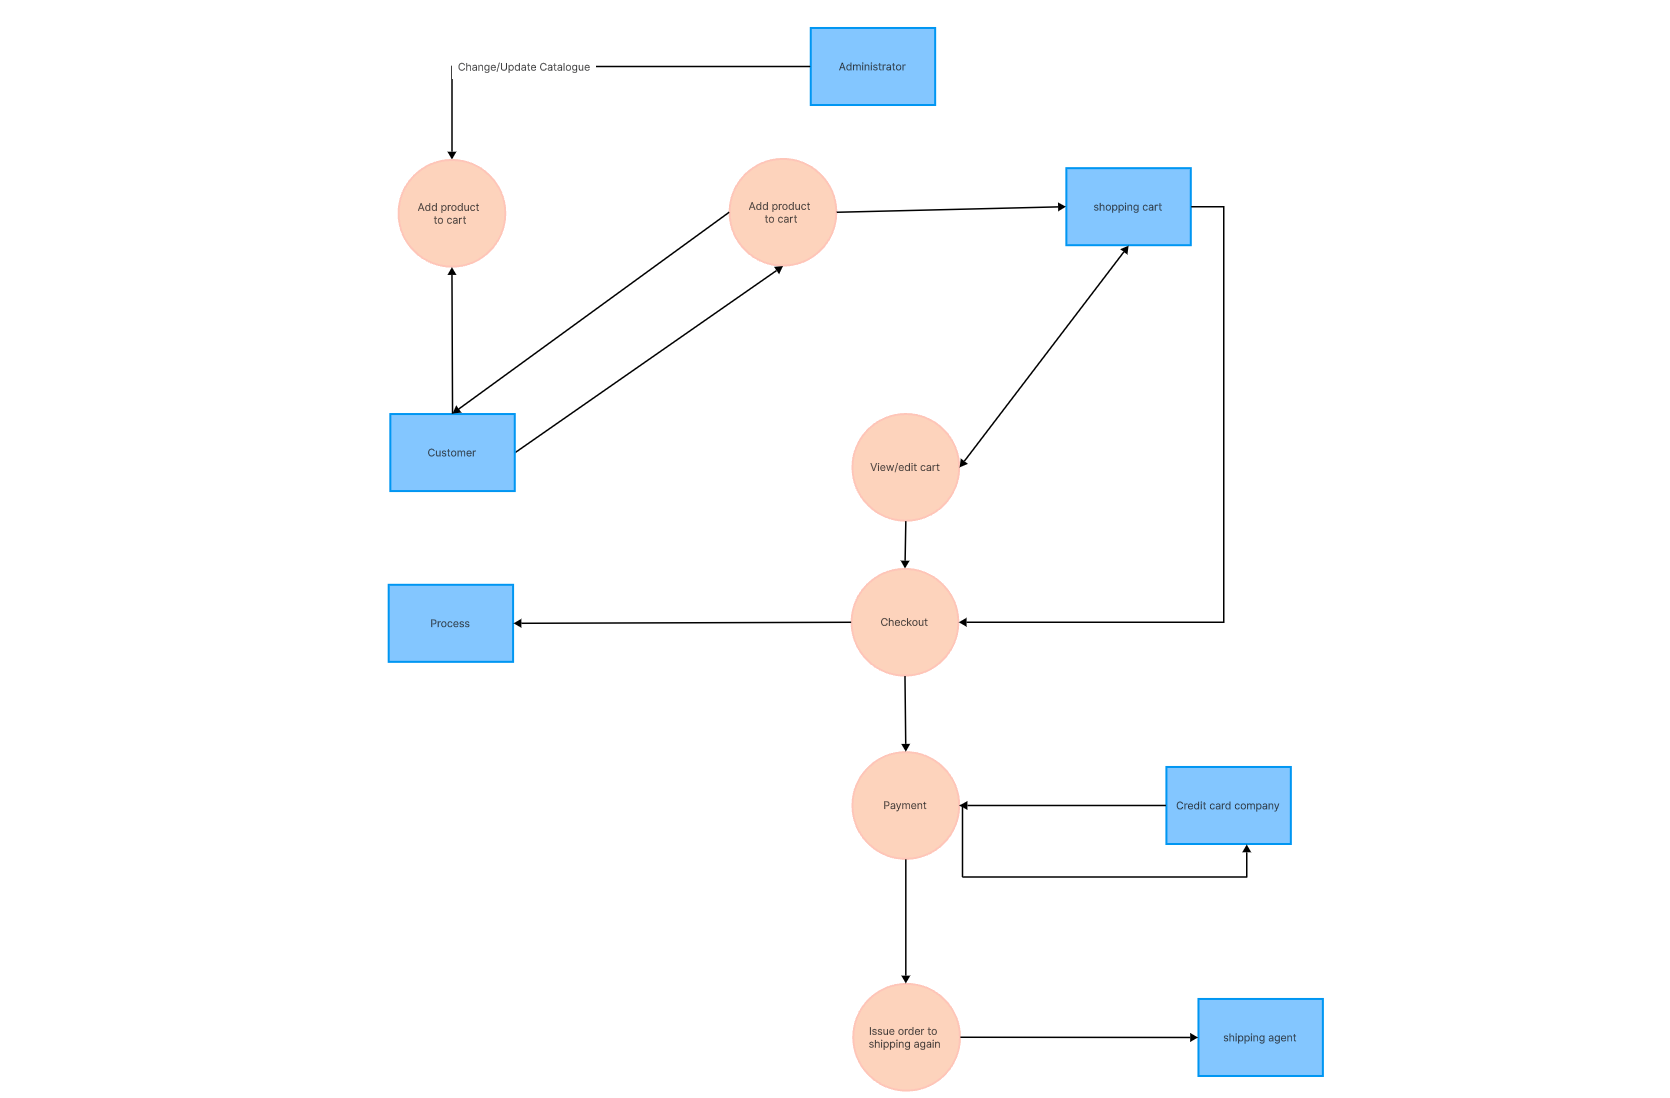
A DFD typically involves four components: entities, processes, data stores, and data flows. Entities represent external elements that interact with the system (like a customer or a bank). Processes are actions that transform data from one form to another (like processing an order). Data stores are repositories where data is stored for future use (like a database), and data flows represent the movement of data between entities, processes, and data stores.
Benefits of a Data Flow Diagram for Online Shopping System
Utilizing a DFD for an online shopping system brings several benefits:
- Process Optimization: By mapping out the entire system's workflow, it becomes easier to identify bottlenecks or redundancies that can be streamlined to improve efficiency.
- Communication Tool: A DFD is a great way to communicate complex system operations visually, making it easier for different stakeholders to understand.
- Error Detection: By clearly illustrating the movement and transformation of data, DFDs can help in detecting any potential errors or discrepancies in the system.
- System Documentation: A well-crafted DFD serves as excellent documentation of the online shopping system's data flow, useful for training new team members or for future reference.
DFD for Online Shopping Symbols
A standard set of symbols is used in a DFD for an online shopping system:
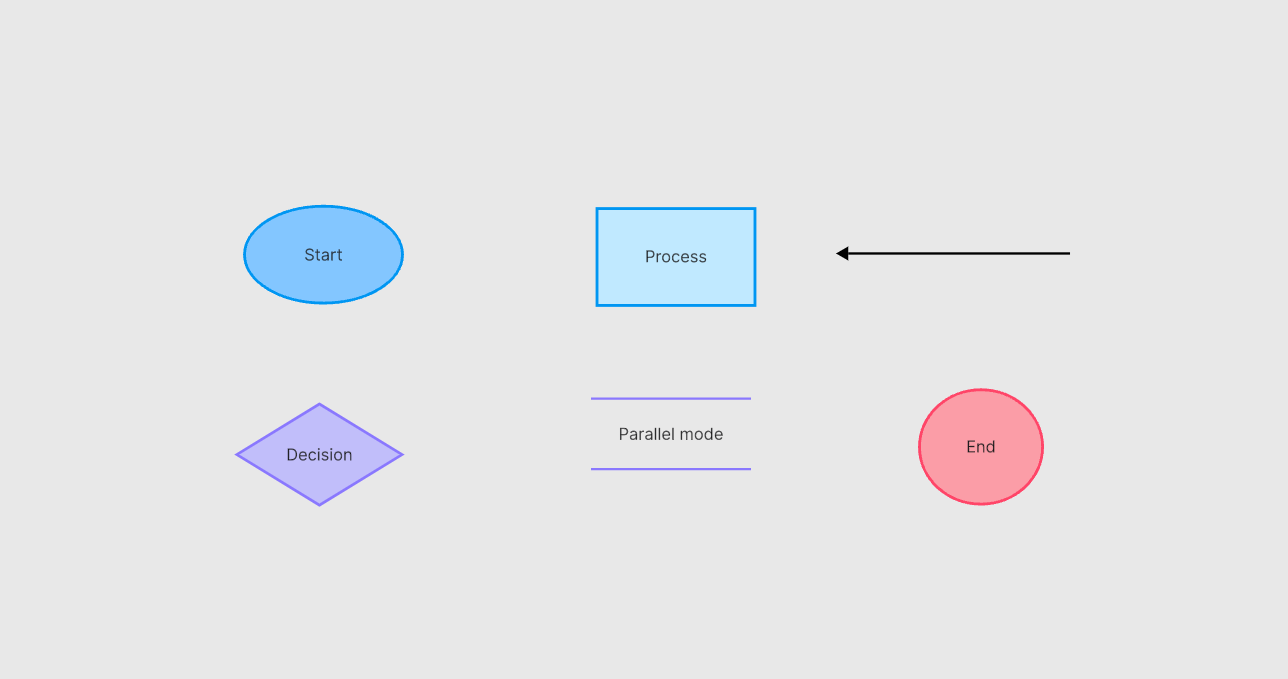
- Circles or Ovals: These represent processes that occur within the system.
- Arrows: These illustrate the flow of data between different components.
- Open-ended Rectangles: These symbolize external entities that interact with the system.
- Parallel Lines or Rectangles: These denote data stores where information is held.
In an online shopping DFD, the 'customer' might be an external entity, 'adding an item to the cart' could be a process, 'inventory' might represent a data store, and the various arrows would show how data moves throughout the system.
The implementation of DFDs for online shopping systems can aid in optimizing business operations, leading to more efficient processes, happier customers, and ultimately, increased profits.
How to Make a Data Flow Diagram for Online Shopping System
Boardmix is a robust online tool designed for diagramming and team collaboration. Its functionalities include creating various types of diagrams, such as flowcharts, process diagrams, and more importantly, data flow diagrams. Its intuitive design and a range of customizable features make it an excellent choice for professionals looking to map out complex systems efficiently.
Below is a step-by-step guide on how you can use Boardmix to create a comprehensive DFD for your online shopping system:
Step 1. First, sign in to your Boardmix account. If you do not have one, registration is simple and quick.

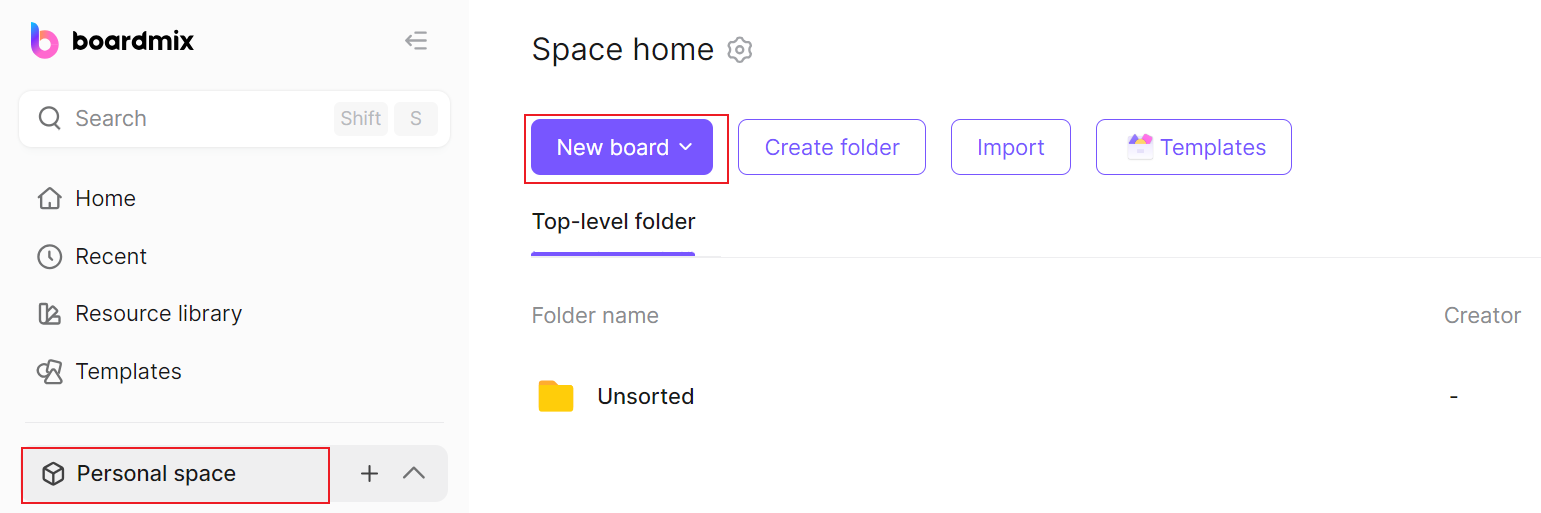
Step 2. On the dashboard, select "New board." You can name the board something relevant, like "Online Shopping DFD."
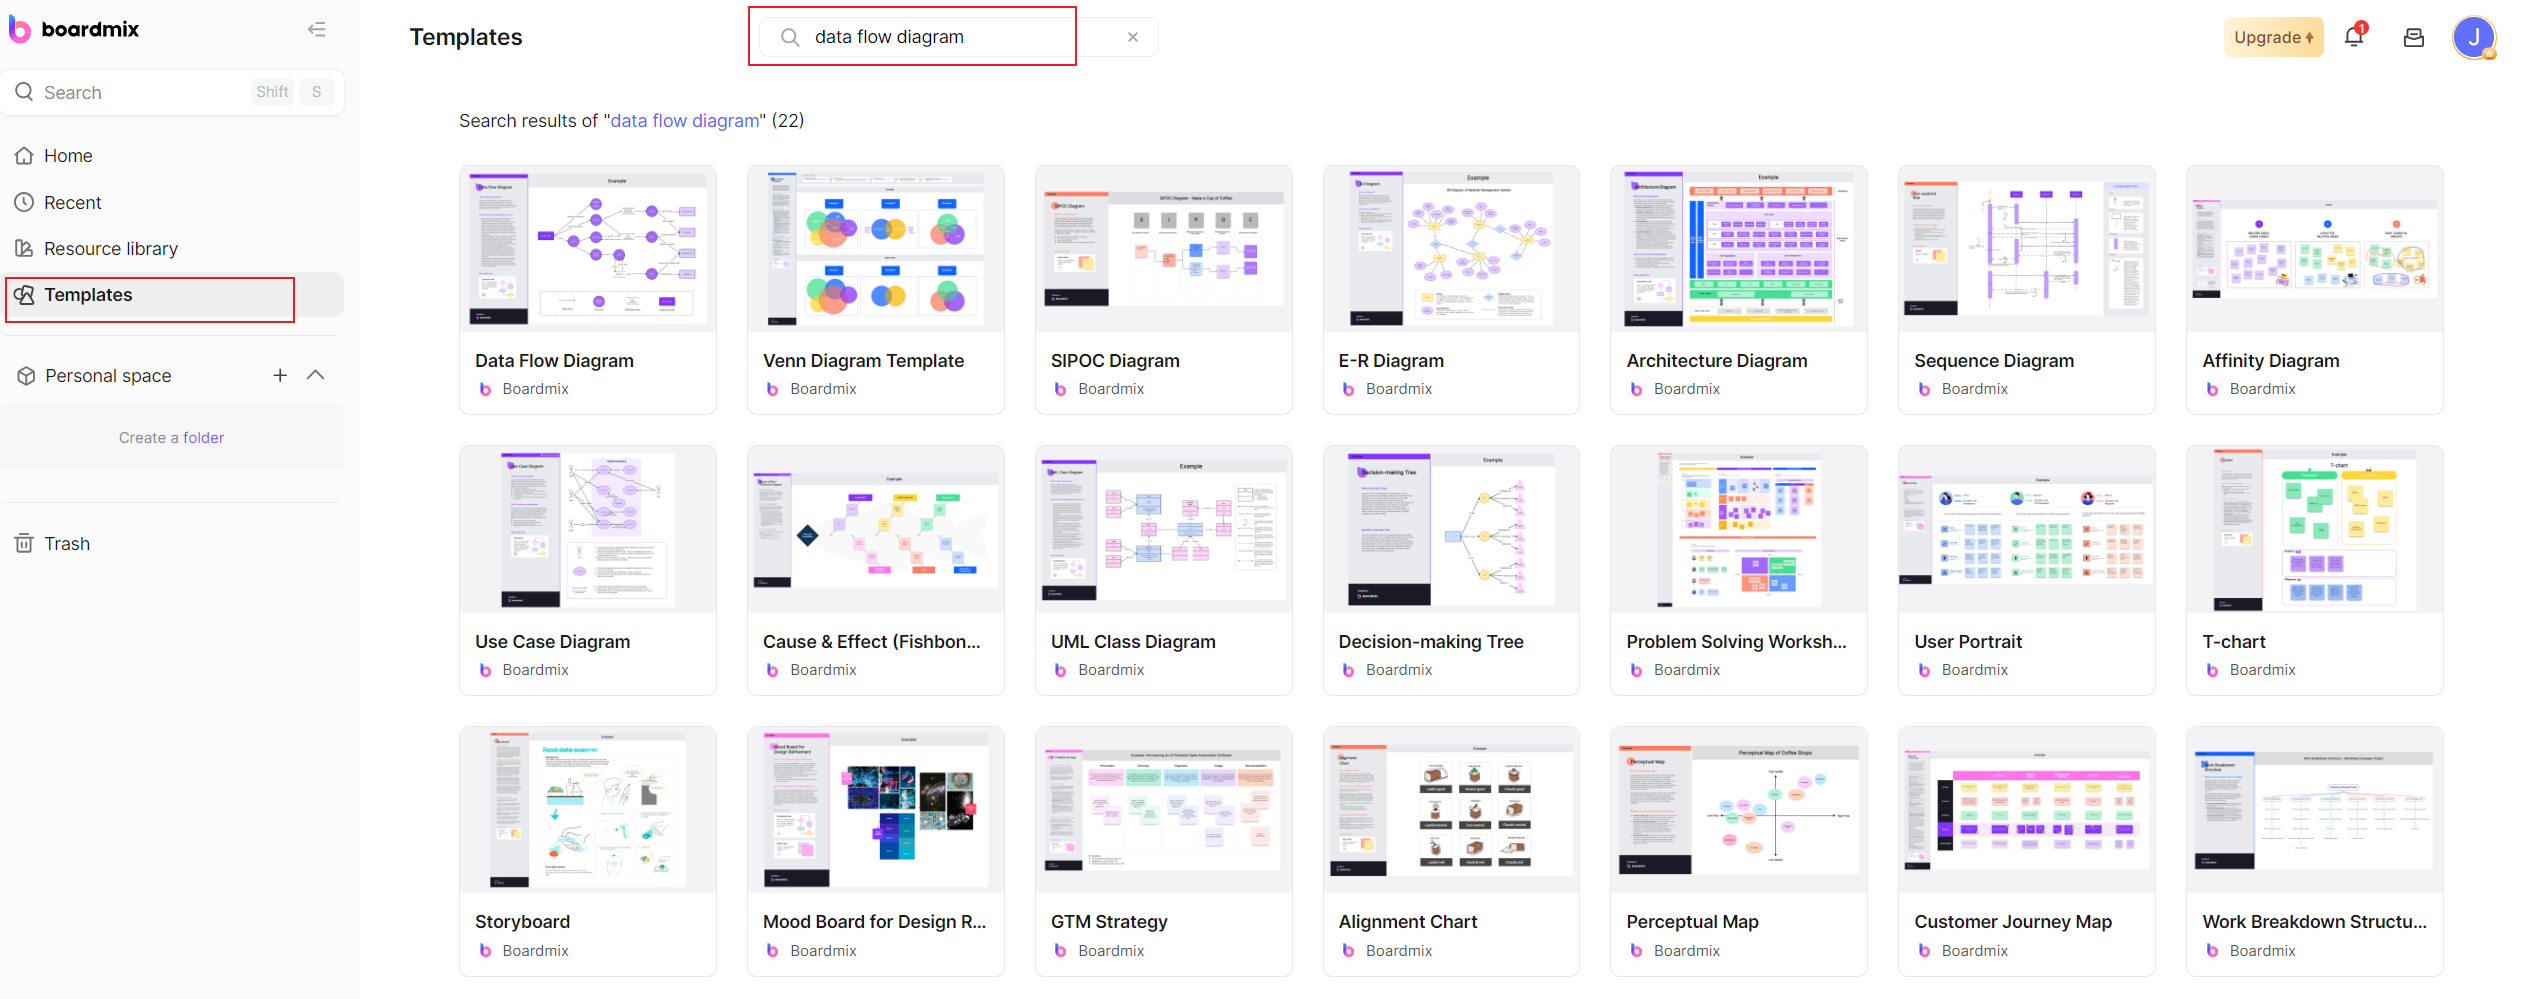
Step 3. Within your project, choose "Templates," then select "Data Flow Diagram" from the options presented.
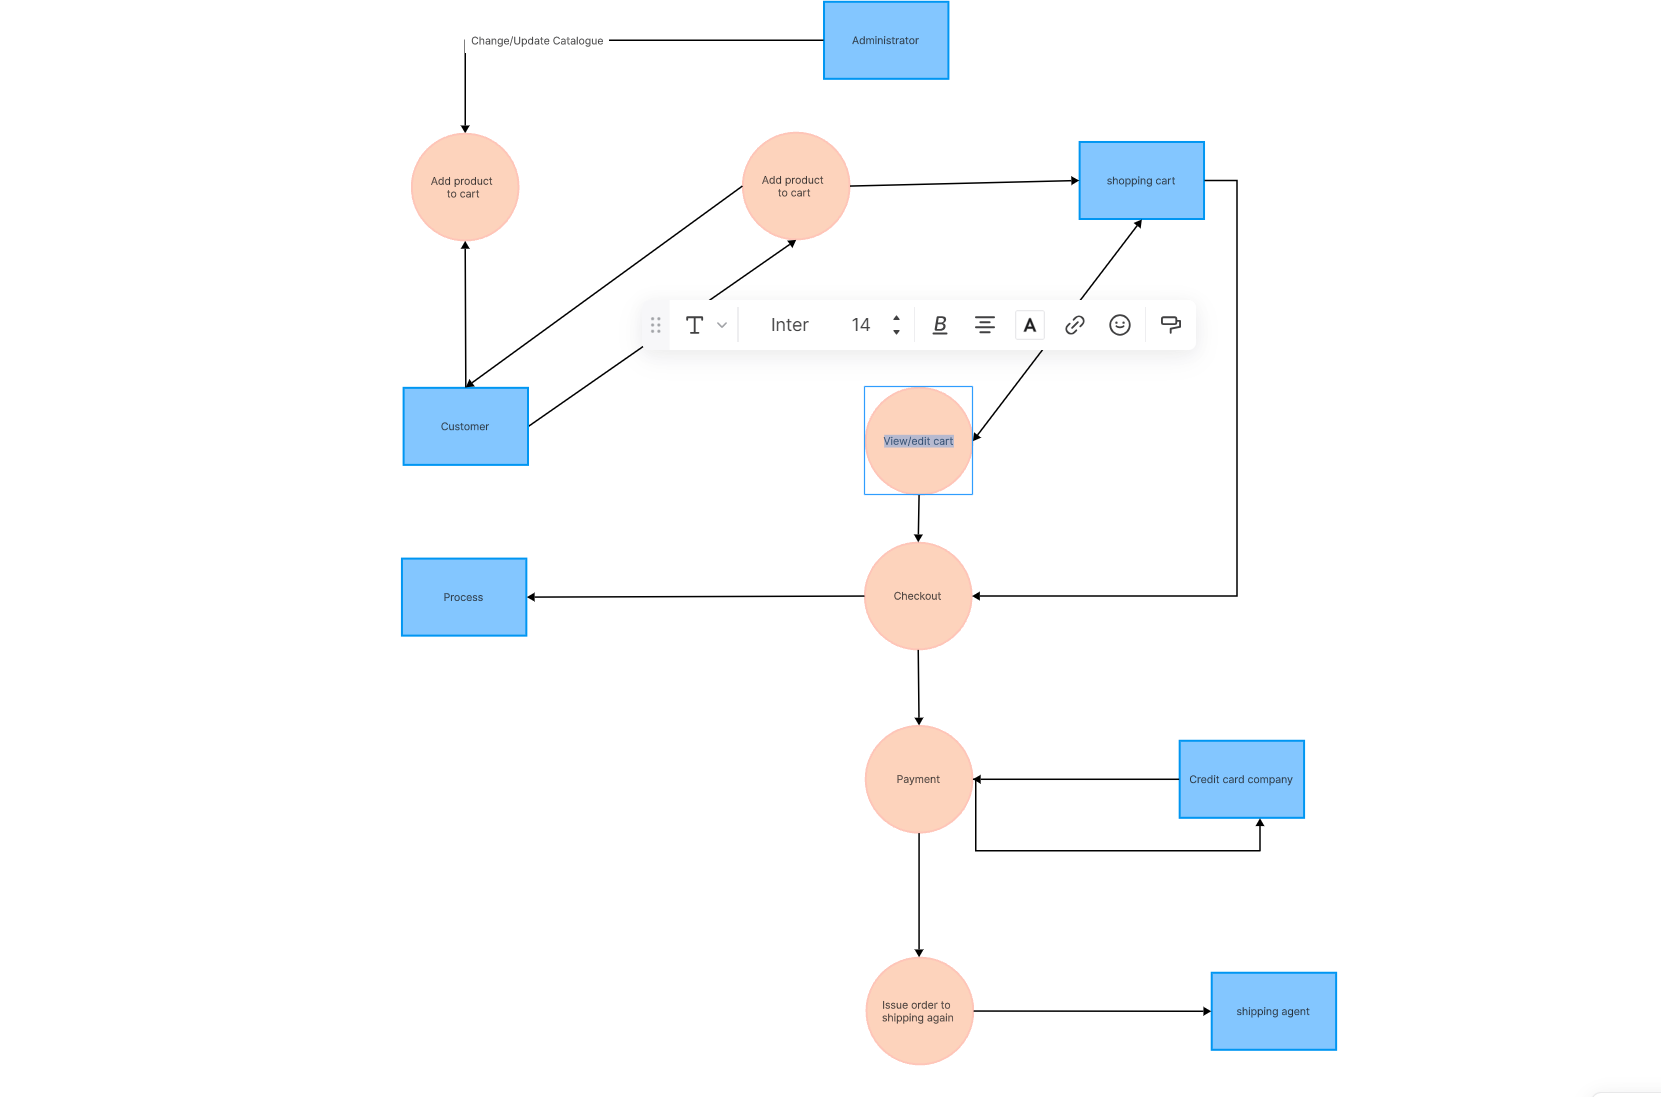
Step 4. Now that you have a blank canvas with a ready-made data flow diagram, you can begin making your DFD. You can also use symbols from the left sidebar to represent four different aspects: entities, processes, data stores, and data flows.
- Entities are external elements that interact with the system (for example, Customers). You can depict them by dragging and dropping rectangle shapes onto the canvas.
- Processes are what convert incoming data flow into outgoing data flow (for example, Processing Payment). Circle shapes represent processes in the DFD.
- Data Stores are where the data resides in the system (for example, Customer Database). Use two parallel lines to denote them.
- Arrows are used to depict data flows—these demonstrate how data moves between entities, processes, and data stores.
Step 5. Each component should be clearly labeled to avoid any confusion—be it processes like "Check Out" and "Process Payment," or entities like "Customer" and "Inventory Management."
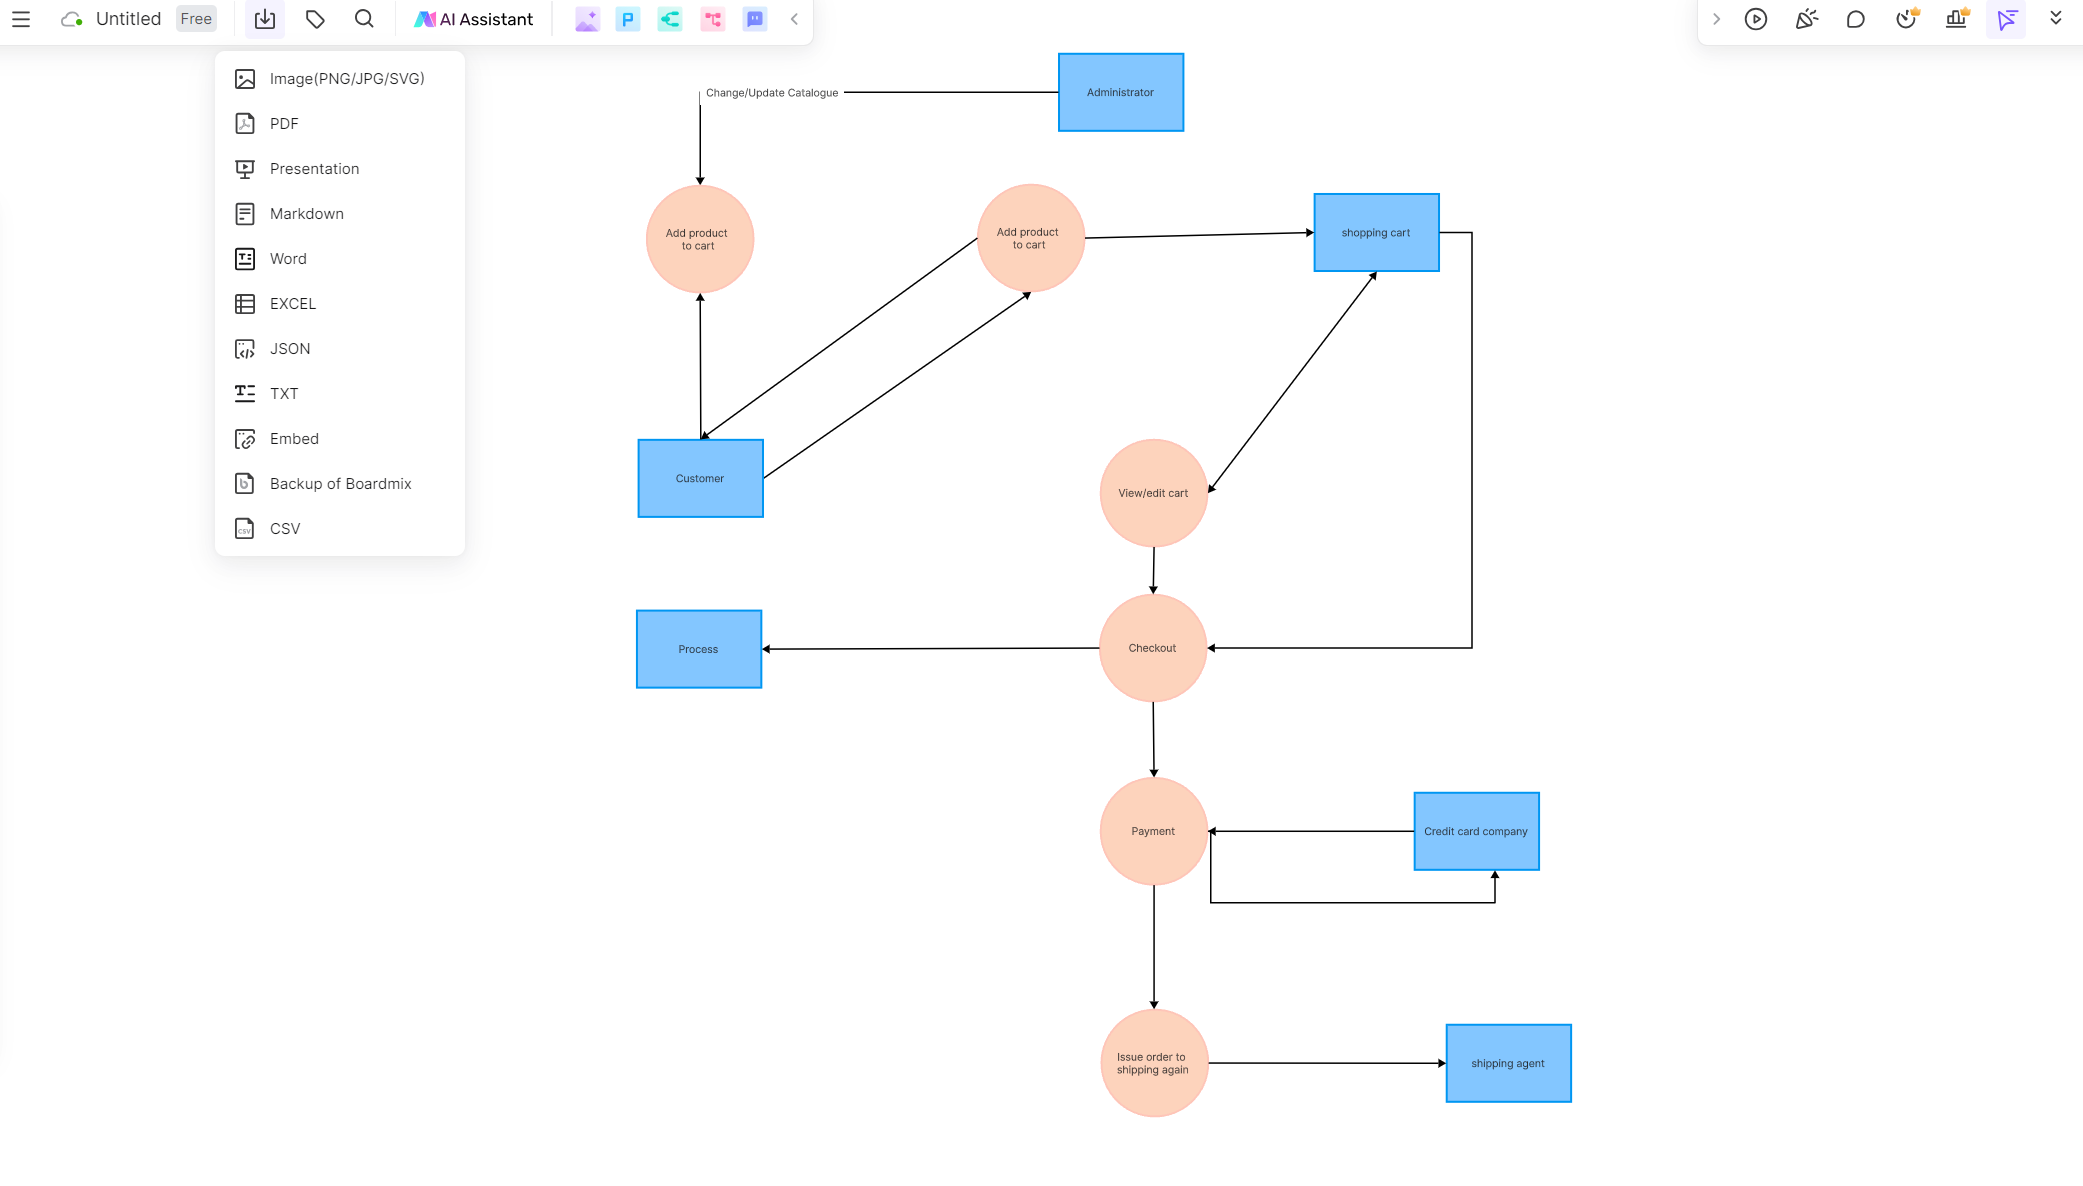
Step 6. Once you have mapped out all the components and data flows of your online shopping system, review the diagram for accuracy. Upon confirmation, save your work.
Creating a DFD for an online shopping system using Boardmix can significantly simplify complex workflows. It aids in streamlining processes, identifying inefficiencies and bottlenecks, and fostering better communication within the team. Remember, the key is to keep the diagram clear, well-structured, and as detailed as possible.
How to Draw a Good Data Flow Diagram: Tips and Tricks
Data Flow Diagrams (DFDs) are invaluable tools used to represent the flow of data within a system. They depict how data is inputted, processed, stored, and outputted in a graphical format. Drawing a good DFD requires meticulousness, understanding, and practice. Here are some essential tips and tricks that can aid you in crafting a well-structured and effective DFD.
1. Understand Your System
Before beginning the creation of a DFD, ensure you have a comprehensive understanding of the system. Identify all the components - processes, data flows, entities, and data stores - that form part of the system. Having an overall picture will help you accurately represent the system and its interactions.
2. Start From The Outside
Begin with the entities (external elements) that interact with your system. They could be users, external systems, or data sources. Once you identify them, proceed with defining how they interact with the processes within your system.
3. Define The Processes
Processes are where incoming data flows are transformed into outgoing data flows. Remember to clearly label each process and use specific action verbs to describe what each process does. Avoid using generic terms like 'manage' or 'process'.
4. Identify Data Stores
Data Stores are where data is stored for use later in the process. In most systems, these can be databases or repositories. Represent them appropriately in your DFD.
5. Map Out Data Flows
After establishing the processes and data stores, focus on the data flows. They show how information moves within the system. Make sure to represent all flows, even if they seem minor.
6. Use Appropriate Symbols
Consistency is key in DFDs. Stick to standard symbols for each component. Typically, processes are circles or ovals, data flows are arrows, external entities are squares or rectangles, and data stores are two parallel lines or open-ended rectangles.
7. Keep It Simple and Clear
Aim to make your DFD as simple and easy-to-understand as possible. Overly complicated diagrams can cause confusion and misinterpretation.
8. Use a Top-Down Approach
Start with a high-level (context) diagram depicting the entire system in a single process. Gradually break this down into lower-level (detailed) diagrams to illustrate more complex processes.
9. Validate Your Diagram
Review your DFD carefully to verify its accuracy. Cross-check with other team members or stakeholders for validation.
10. Use Diagramming Tools
Many online diagramming tools like Boardmix offer pre-made templates and easy-to-use interfaces that can make drawing DFDs much more manageable.
Mastering the art of drawing an effective Data Flow Diagram involves practice, precision, and patience. By following these tips and tricks, you'll be well on your way to creating useful, comprehensive, and high-quality DFDs.


