


In the intricate and constantly evolving field of software engineering, visual aids such as data flow diagrams (DFDs) become indispensable for communicating complex processes efficiently. This comprehensive guide will explore what DFDs are, why they're vital in software engineering, and how to effectively use and create them to optimize your software development process. Let’s get started!
What Is a Data Flow Diagram in Software Engineering
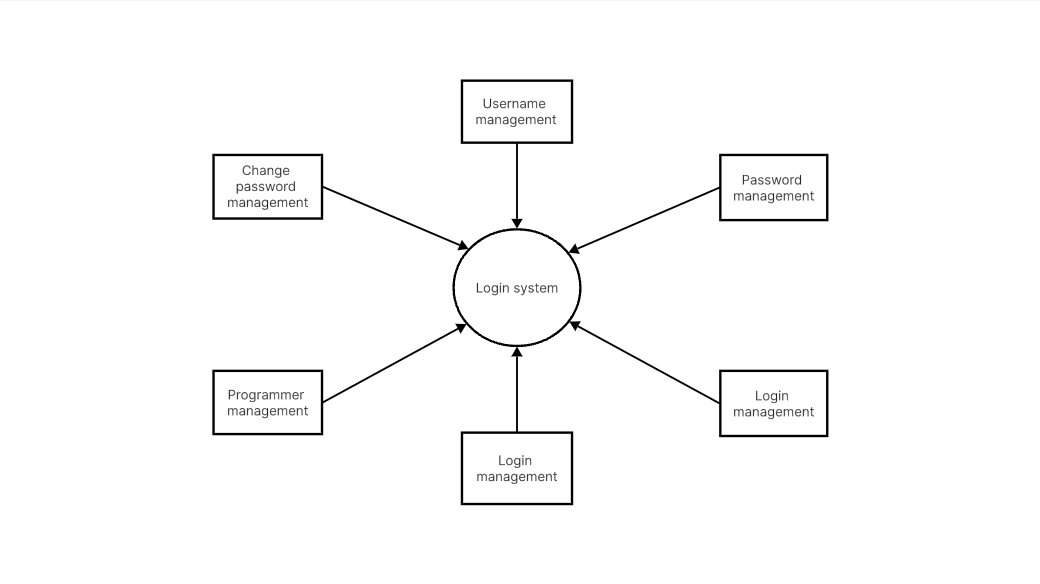
A Data Flow Diagram (DFD) is a graphical representation of the "flow" of data within a system, modeling its process aspects. Used extensively in software engineering, it depicts how information enters and exits the system, where it's stored, and how it's transformed.
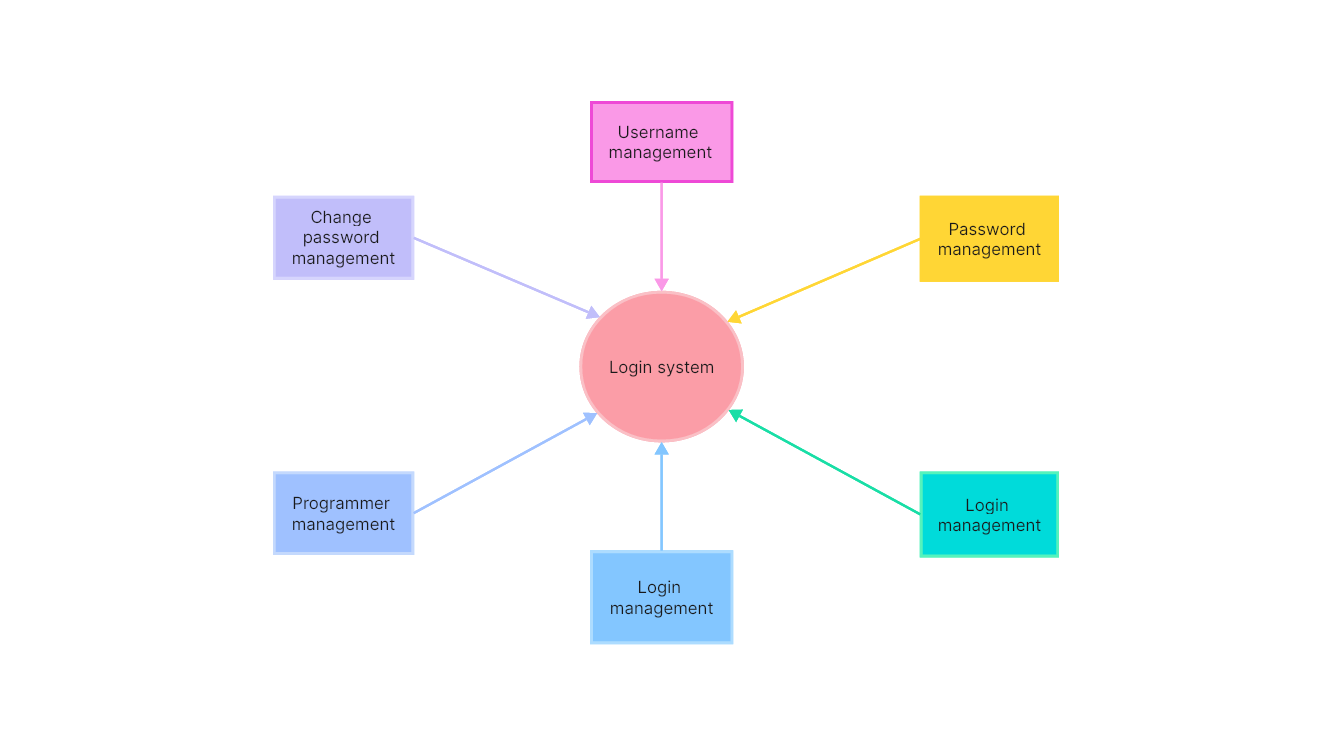
A DFD consists of four main components:
- Entities: These are external elements like users or systems that interact with your system.
- Processes: They show how incoming data gets transformed within the system.
- Data Stores: Represent places where data is stored for use later.
- Data Flows: These are the pipelines showing the path of data movement in the system.
By connecting these components, we can represent a detailed and understandable picture of how data is managed within the system, making it a powerful tool for software engineers.
Why Use Data Flow Diagram in Software Engineering
Data Flow Diagrams are instrumental in software engineering for numerous reasons:
Simplicity
DFDs offer a simple and intuitive way to visualize complex systems. Even those without technical expertise can understand the system's workings through a well-drawn DFD.
Communication Tool
DFDs serve as excellent communication tools between programmers and business stakeholders by providing a common language for understanding system functionalities.
System Analysis
With their ability to break down system functions into detailed steps, DFDs facilitate thorough system analysis. They help in identifying bottlenecks, redundancies, and inefficiencies for improvement.
Documentation
DFDs also act as effective documentation resources that can be referred to throughout the software development lifecycle, ensuring everyone involved is on the same page about system functionalities.
Understanding the function and value of DFDs is essential for successful software development, and it's our next step towards leveraging this powerful tool effectively.
Levels of Data Flow Diagram in Software Engineering
DFDs are designed in multiple levels, each offering a different degree of detail. Understanding these levels is crucial for a comprehensive depiction of your system. Here are the main levels:
Context Diagram (Level 0 DFD): This is the highest level of a DFD and provides a broad overview of the system. It shows the system as a single process and illustrates interaction with external entities.
Level 1 DFD: This level expands the context diagram, breaking down the system into its major high-level processes, along with data flow between them. It offers a more detailed view but still remains somewhat abstract.
Level 2 DFD: Going further down, this level breaks down each high-level process of the Level 1 DFD into its sub-processes. This level provides an in-depth view of the system’s working.
There may be further levels (like Level 3, 4, etc.), breaking down processes into more detailed steps as necessary.
Symbols of Data Flow Diagram in Software Engineering
DFDs communicate via a set of standardized symbols. These symbols represent various components and give meaning to a DFD's structure:
Ovals: Represent external entities – the outside systems or users interacting with your system.
Arrows: Symbolize data flows – indicating the direction of data movement.
Rectangles with rounded corners: Denote processes – these transform incoming data into outgoing data.
Open-ended rectangles: These depict data stores, where data is held for future use.
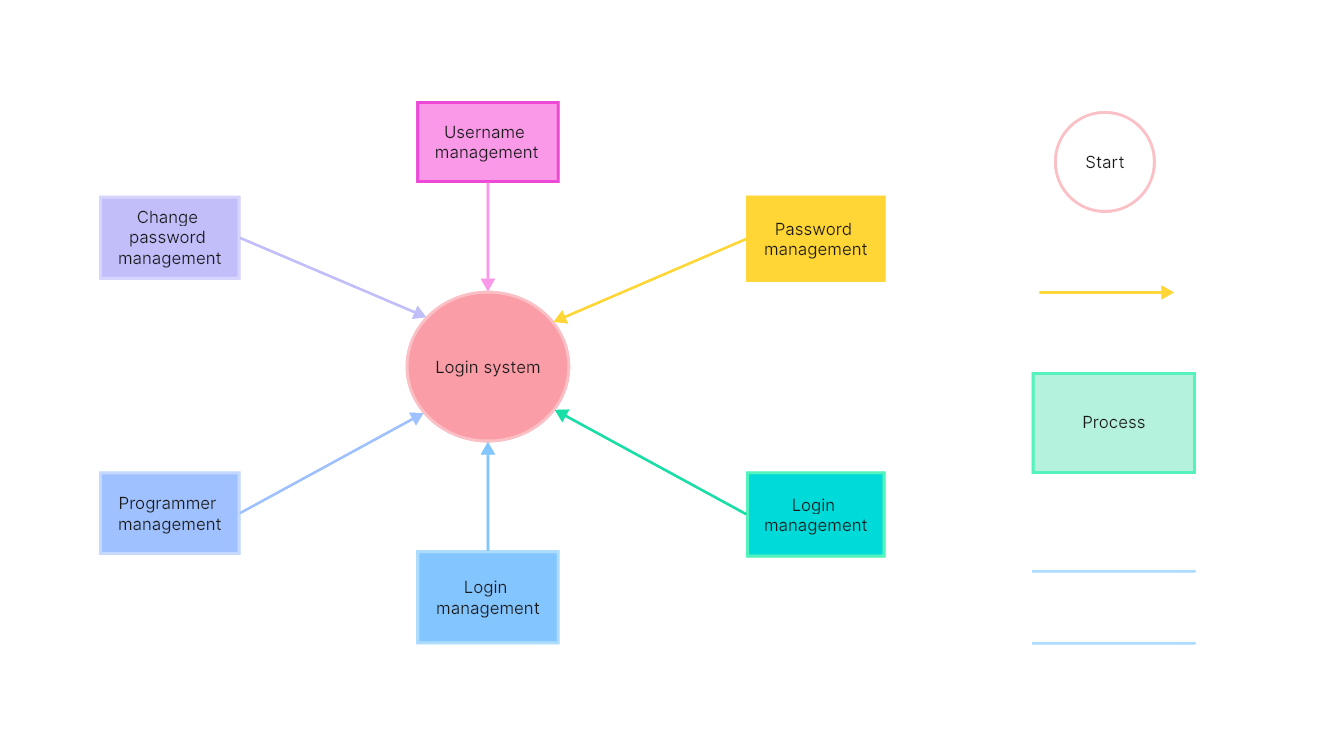
Understanding these symbols and their implications is like learning a new language – once mastered, they enable you to effectively communicate complex system processes and workflows.
How to Make a Data Flow Diagram in Software Engineering
When it comes to creating DFDs, one powerful tool stands out – Boardmix. As a multifaceted visual collaborative platform, Boardmix has transformed how teams map their workflows and visualize data flow. Here's why it's your go-to choice for crafting comprehensive DFDs in software engineering:
- Intuitive Interface: Boardmix offers an easy-to-navigate platform where you can drag-and-drop elements to create your DFD.
- Collaborative Space: Teamwork is crucial in software development, and Boardmix fosters it efficiently. You can collaborate in real-time with team members, making joint decisions on the flow of data.
- Vast Library of Elements: Boardmix provides a wide range of symbols, icons, and shapes necessary for crafting a detailed DFD.
- Seamless Integration: Boardmix seamlessly integrates with numerous other platforms and project management tools.

Embarking on the journey of creating your first DFD in Boardmix? Follow these systematic steps:
1. Define the System or Process
The initial step involves understanding and defining the system for which you're creating the DFD. Determine the inputs, the outputs, and how data transforms within this system.
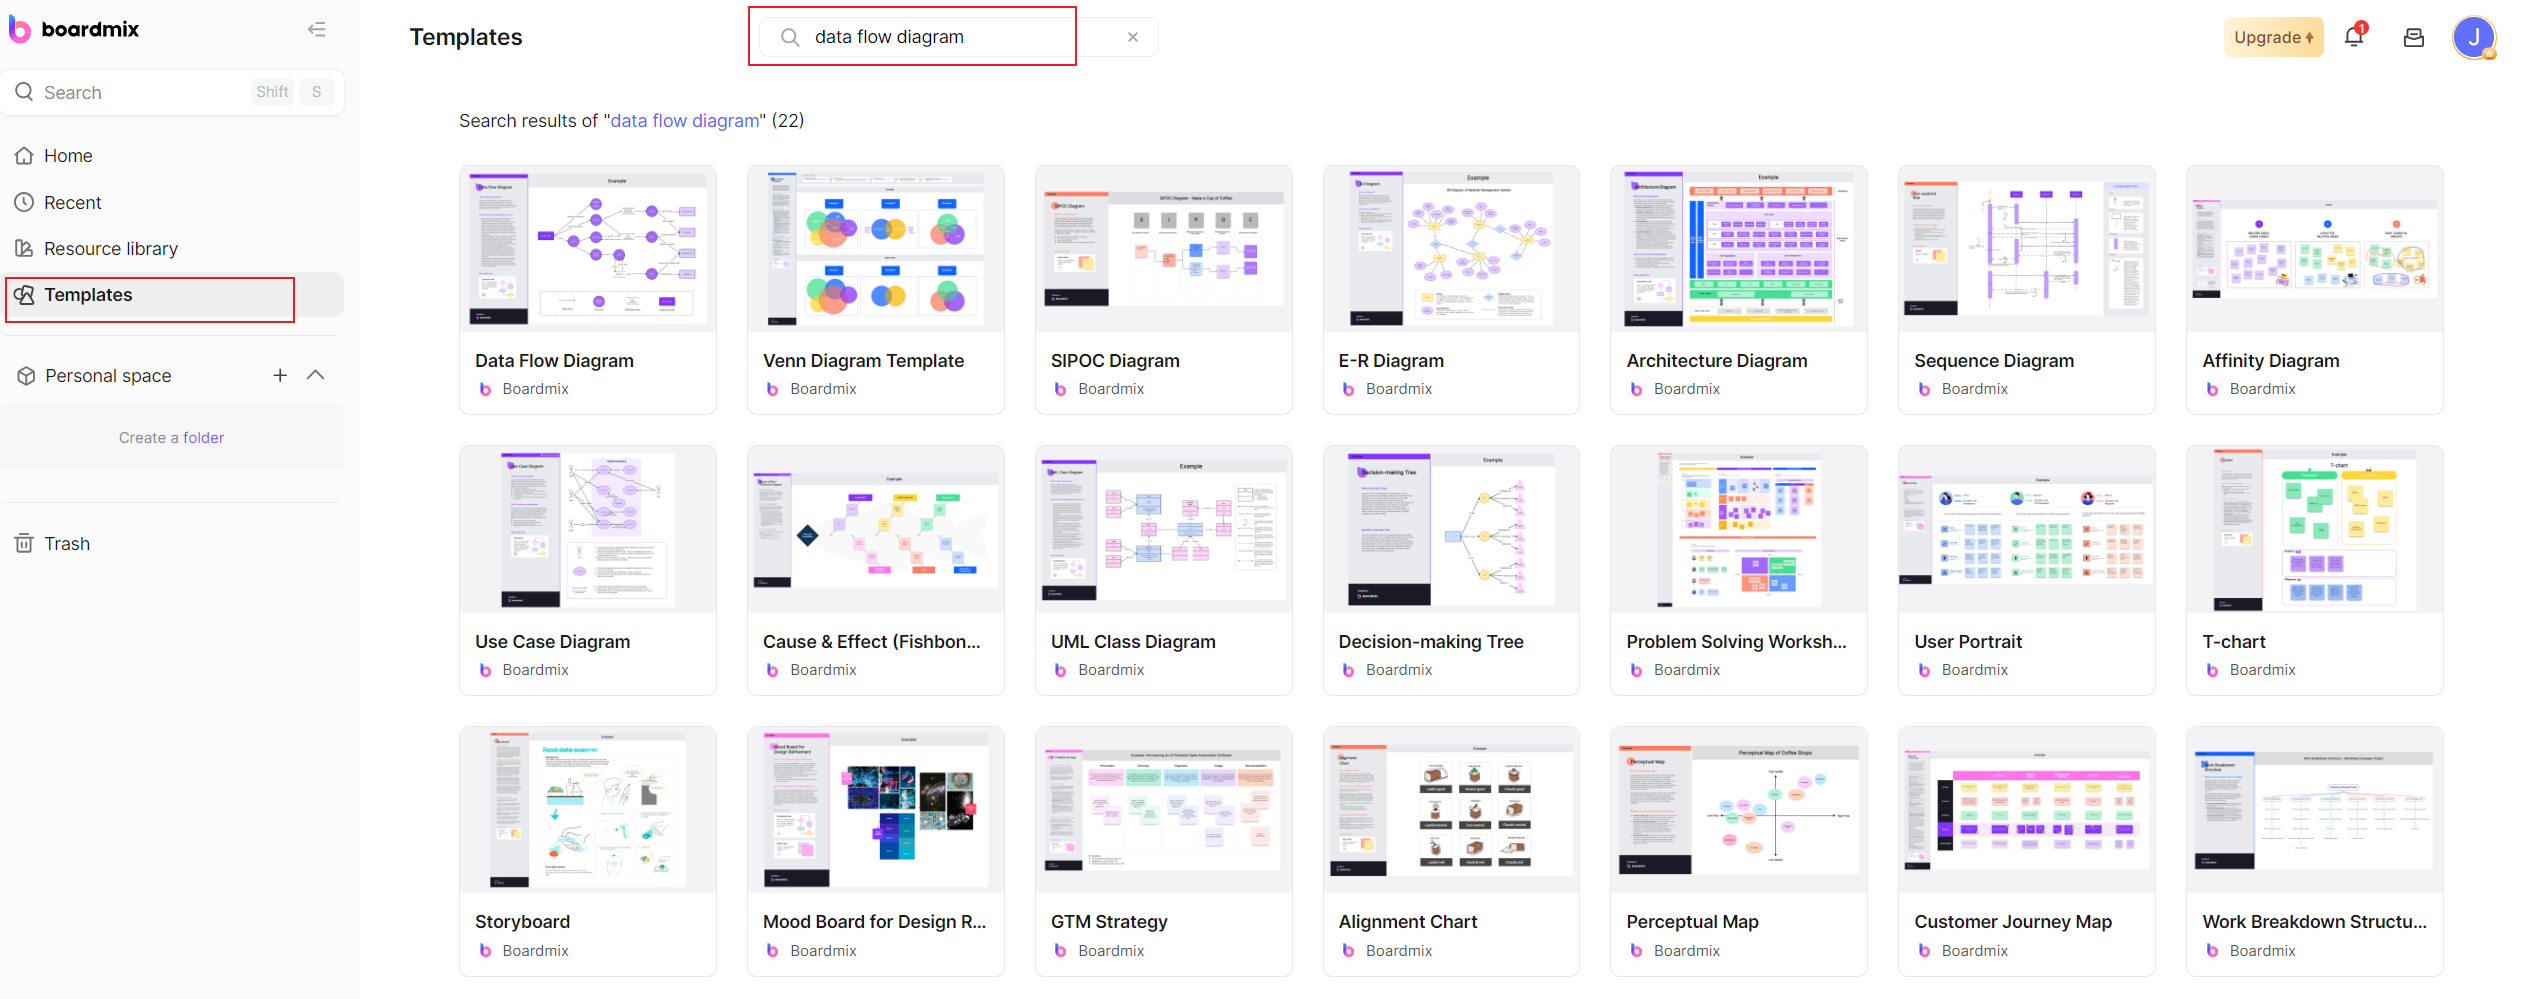
2. Open Boardmix and Choose the DFD Template
Boardmix provides various templates to kickstart your work. Locate and select the 'Data Flow Diagram' template under the 'Templates' section.
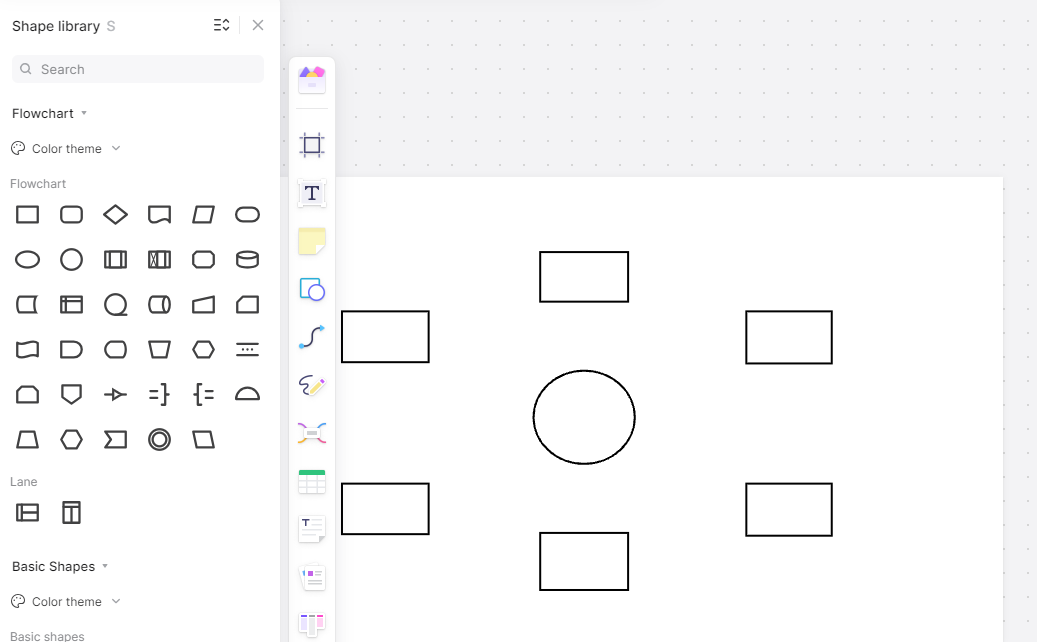
3. Identify and Add Symbols
DFDs have four primary symbols: Entities (sources or destinations of data), Processes (how data is transformed), Data stores (where data is stored), and Data flows (the route data takes). Identify these elements in your system and add the corresponding symbols from Boardmix's vast library onto your workspace.
4. Connect the Symbols
After placing all symbols onto the workspace, use arrows to indicate data flow between them. Ensure to correctly show the direction of data movement.
5. Validate Your Diagram
Once you've finished creating your DFD, verify it against the defined system. Make sure all processes are accounted for, all data flows are accurate, and all entities have been considered.
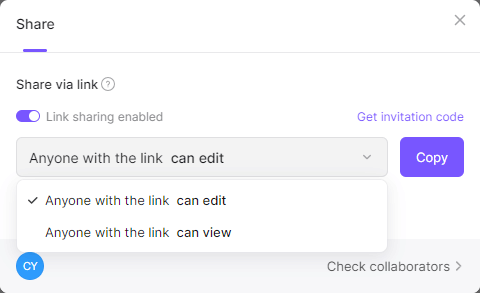
6. Collaborate, Share, and Iterate
Leverage Boardmix's collaboration feature to share the DFD with your team. Collect feedback, make necessary changes, and continuously update the diagram as your system evolves.
Now, armed with an understanding of DFDs let’s explore some tips and tricks that can help you make the most out of these powerful visual tools.
Tips and Tricks on Making a Data Flow Diagram in Software Engineering
Clear Understanding of the System
Before you start drawing your diagram, ensure you have a deep understanding of the system or process you intend to map. This involves understanding the source of data (entities), where data is stored (data stores), how data transforms within the system (processes), and where it eventually ends up (again entities).
Breaking Down Complex Systems
When dealing with a large and complex system, creating one DFD that encompasses every aspect of it might be impractical and overwhelming. In such cases, consider using a "top-down" approach. Start by creating a high-level DFD capturing the main processes and data flow. Then break each process down into smaller, manageable parts, creating additional DFDs to visualize them.
Using Standardized Symbols Correctly
DFDs use four primary symbols - circles or ovals for processes, arrows for data flows, open-ended rectangles for entities (or terminators), and two horizontal lines for data stores. Consistent use of these symbols will ensure that anyone familiar with DFDs can understand your diagram.
Naming Conventions
Use precise and descriptive names for your processes, entities, and data stores. It helps in understanding what each symbol in your DFD represents, improving its effectiveness as a communication tool. Avoid using vague or generic labels that can lead to confusion.
Keeping it Simple
A cluttered DFD with crisscrossing arrows can be hard to follow. Strive for simplicity in your diagrams. Avoid unnecessary crossing of data flow arrows where possible. If your DFD feels cluttered, it's a good sign that you may need to break it down into multiple diagrams.
Iterate and Refine
Creating a DFD isn’t a one-and-done deal. Your initial diagram is likely a rough version that needs refinement. Be prepared to revise and update it multiple times as you receive feedback or as the system undergoes changes.
Verification
Once you have drafted your DFD, verify its correctness. Cross-check all data flows and transformations against the actual system’s processes to ensure accuracy.
Using Modern Tools
While drawing DFDs by hand can be fine in some cases, using modern diagramming tools can make the process easier and more efficient. Tools like Boardmix offer easy-to-use interfaces and handy features that aid in creating, editing, and sharing your diagrams.
In conclusion, creating effective Data Flow Diagrams is not merely about understanding your system and the symbols used. It also requires strategy and attention to details like simplicity, clarity, and accuracy. Armed with these tips and tricks, you’re well on your way to mastering DFD creation! Just sign up and try Boardmix for DFD creation right now!


