


In the age of digital transformation, businesses have been rapidly evolving, and so have the methods of organizing and representing data. One tool that has significantly impacted how companies understand and visualize their data movement is the Data Flow Diagram (DFD). By offering a graphic illustration of how data flows through a system, DFDs enable a clear understanding of the processes involved, leading to better decision-making. In this article, we delve into what a Data Flow Diagram is and how to create a Data Flow Diagram online.
What Is a Data Flow Diagram
A Data Flow Diagram (DFD) is a graphical representation that depicts the flow of data in a system. It serves as a tool for understanding how inputs are transformed into outputs through processes, illustrating the relationships between different components involved.
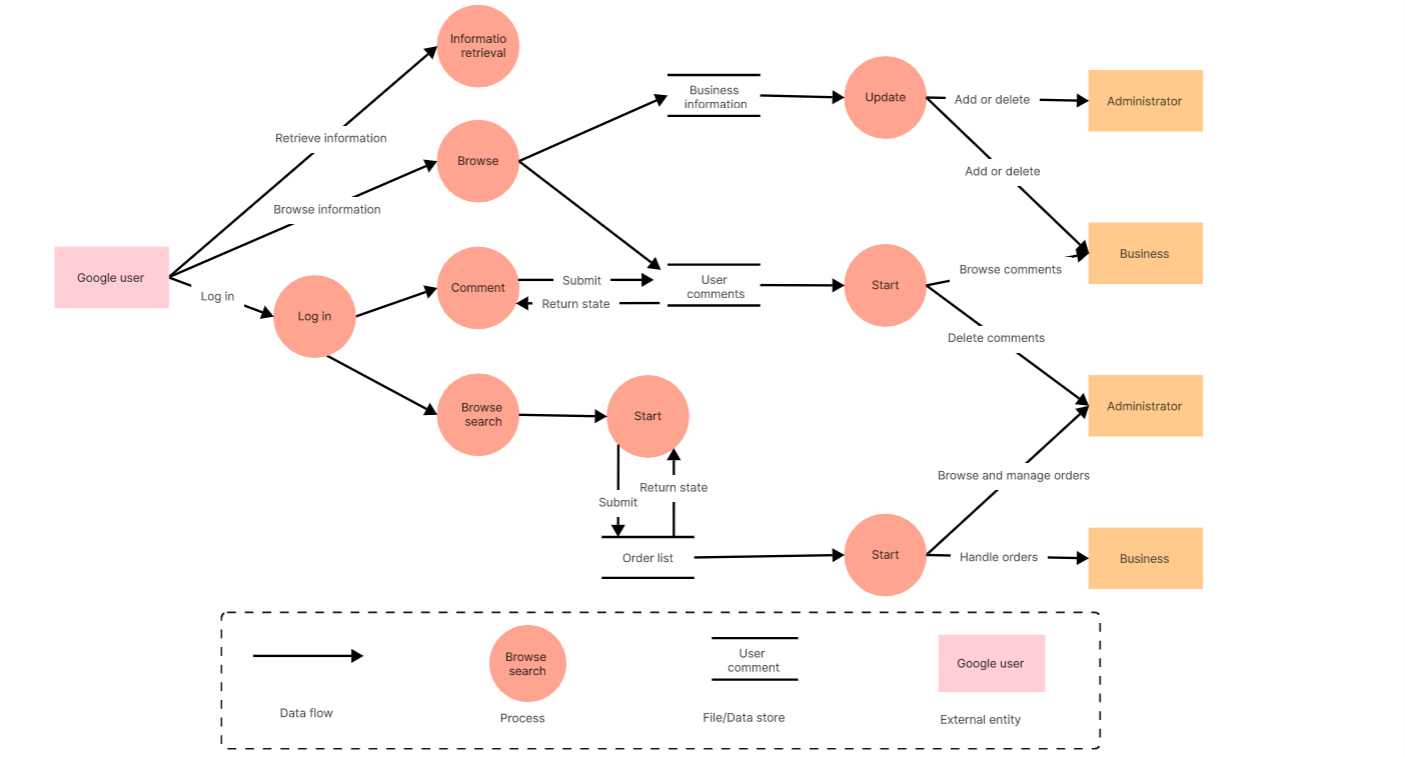
DFDs consist of four main components:
- Entities: These are the external elements that interact with the system, such as users, departments, or other systems.
- Processes: Processes represent the transformations or operations performed on the data within the system.
- Data Stores: Data Stores are places where data is stored for use at a later stage.
- Data Flows: These represent the pathways through which data moves from one part of the system to another.
Through these components, DFDs offer a visual representation of a system’s operation, interaction, and data flow, facilitating a thorough comprehension of its workings.
Why Make a Data Flow Diagram Online
Creating a DFD online presents multiple benefits:
Accessibility and Collaboration
Online platforms offer accessibility from any location with internet access. They facilitate real-time collaboration, allowing multiple team members to work simultaneously on the diagram.
Ease of Use
Most online DFD makers are user-friendly with drag-and-drop functionality, making it simple for even non-technical individuals to create detailed diagrams.
Version Control
With cloud storage, changes are saved automatically, ensuring you always have the most recent version of your diagram at hand. It also allows easy tracking and reverting of changes if necessary.
Professionalism and Consistency
Online DFD makers provide standardized symbols and templates that give your diagrams a professional look while maintaining consistency across different diagrams.
Data Flow Diagrams are powerful tools for understanding and improving business processes. The adoption of online DFD creators further enhances their utility by offering accessibility, collaboration, ease of use, version control, and professionalism.
How to Create a Data Flow Diagram Online Using Boardmix
Boardmix is an innovative online platform designed to simplify the creation of data flow diagrams. With a user-friendly interface and powerful features, Boardmix empowers users to visually represent the flow of data within a system or process. This intuitive tool is especially valuable for professionals in fields such as software development, project management, and data analysis.

Users can easily drag and drop elements onto the canvas, representing data sources, processes, storage, and destinations. Boardmix supports collaborative work, allowing multiple team members to contribute to the diagram in real-time. The platform also provides a diverse set of symbols and connectors to accurately illustrate the movement and transformation of data.
By using a tool like Boardmix, you can easily create comprehensive and understandable data flow diagram online. Let's walk through how you can do this.
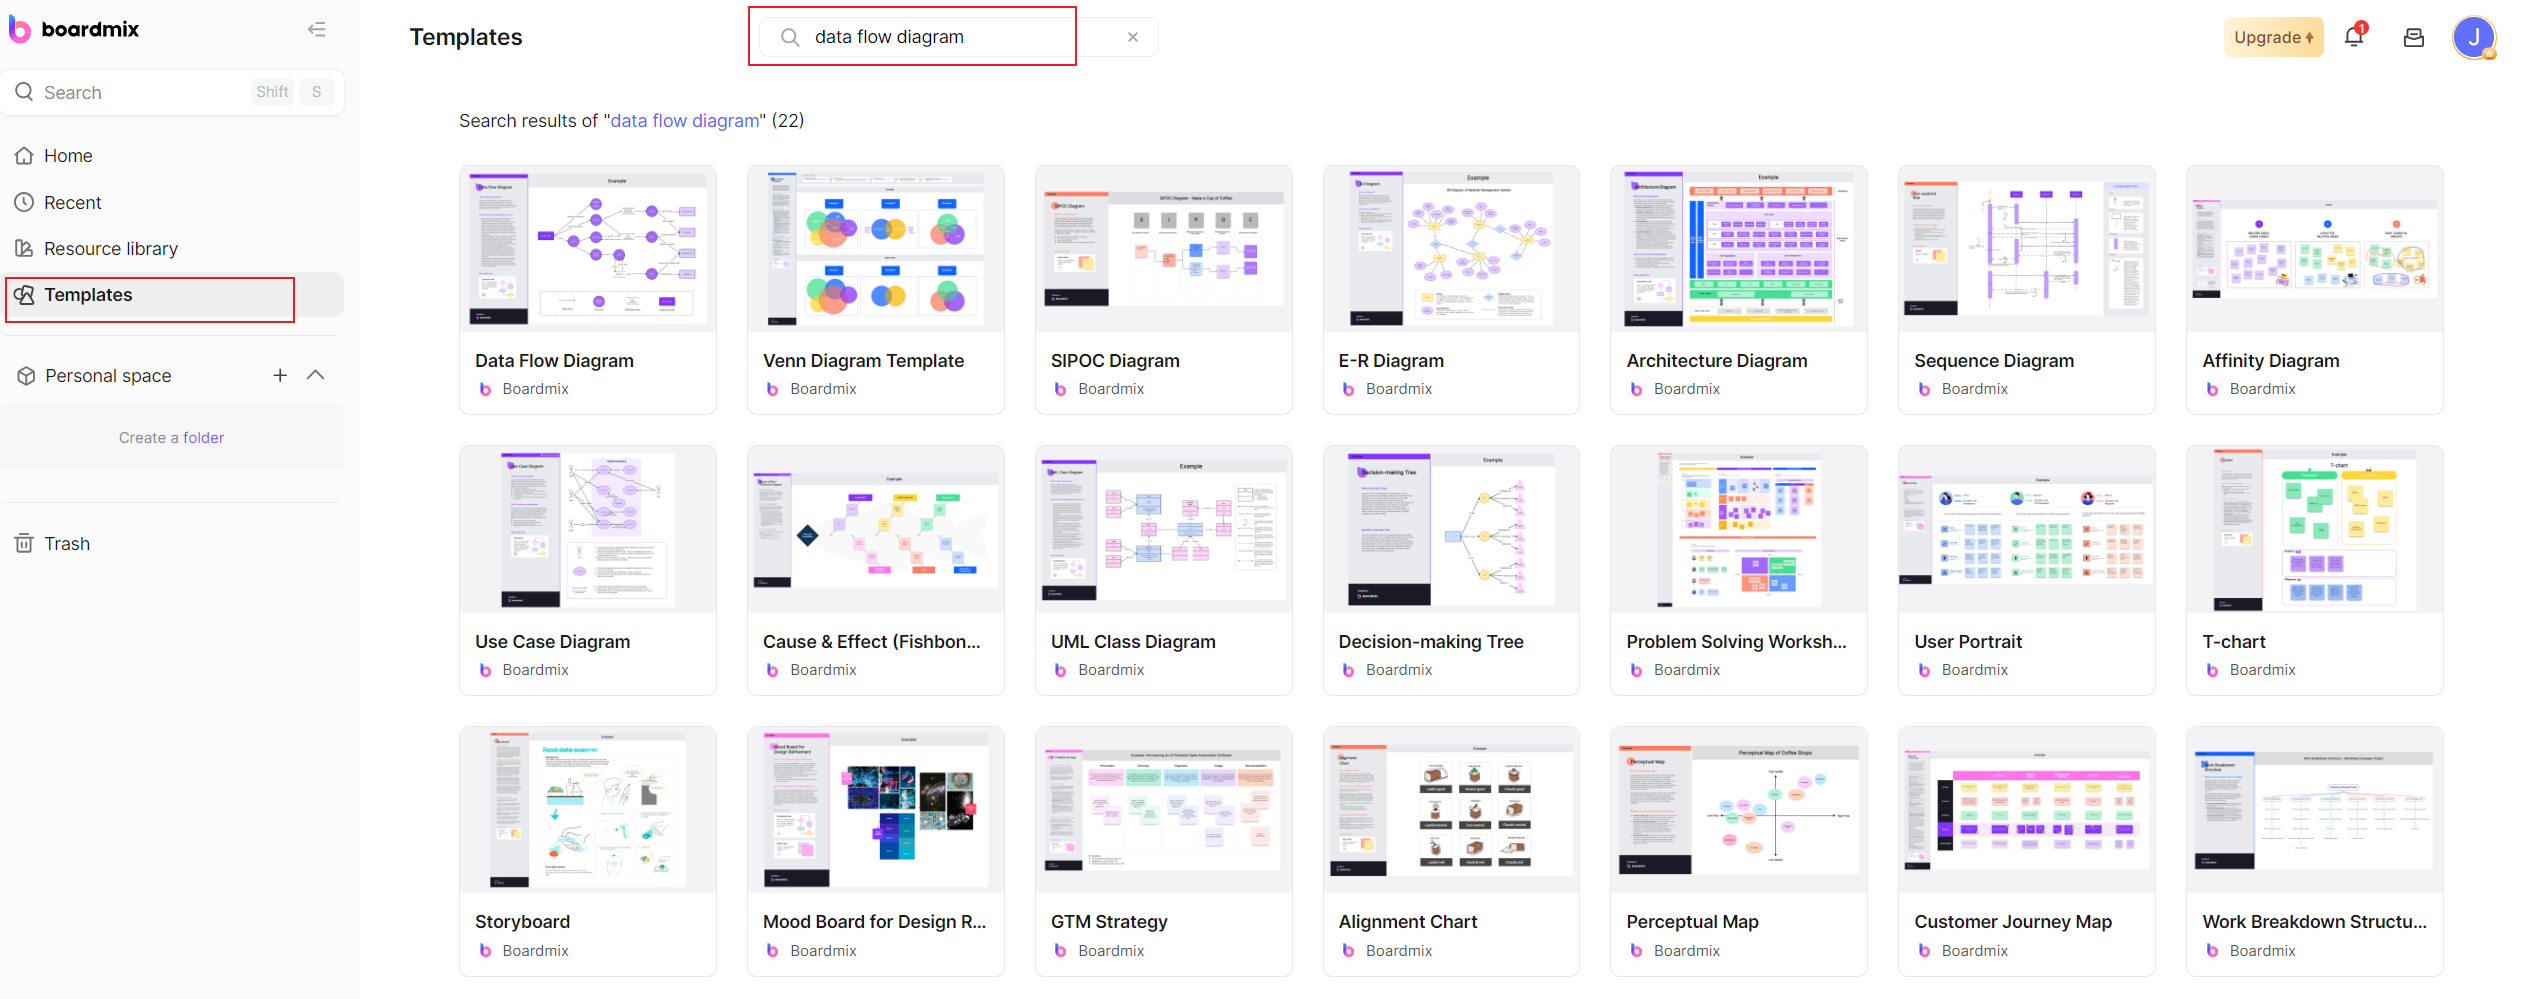
Step 1. Getting Started with Boardmix
To create a DFD on Boardmix, start by setting up your account. Once your account is ready, navigate to the dashboard, select 'New board', and choose 'Data Flow Diagram' from the template list.
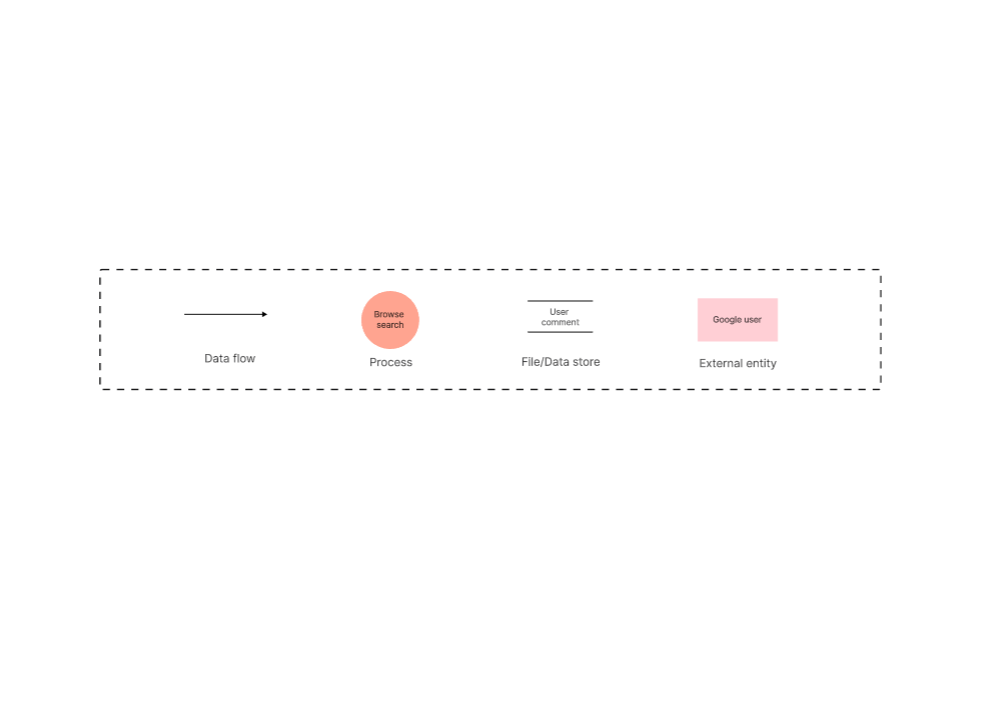
Step 2. Identifying System Components
Start by defining your system's components, i.e., entities, processes, data stores, and data flows. These components will act as the building blocks of your DFD.
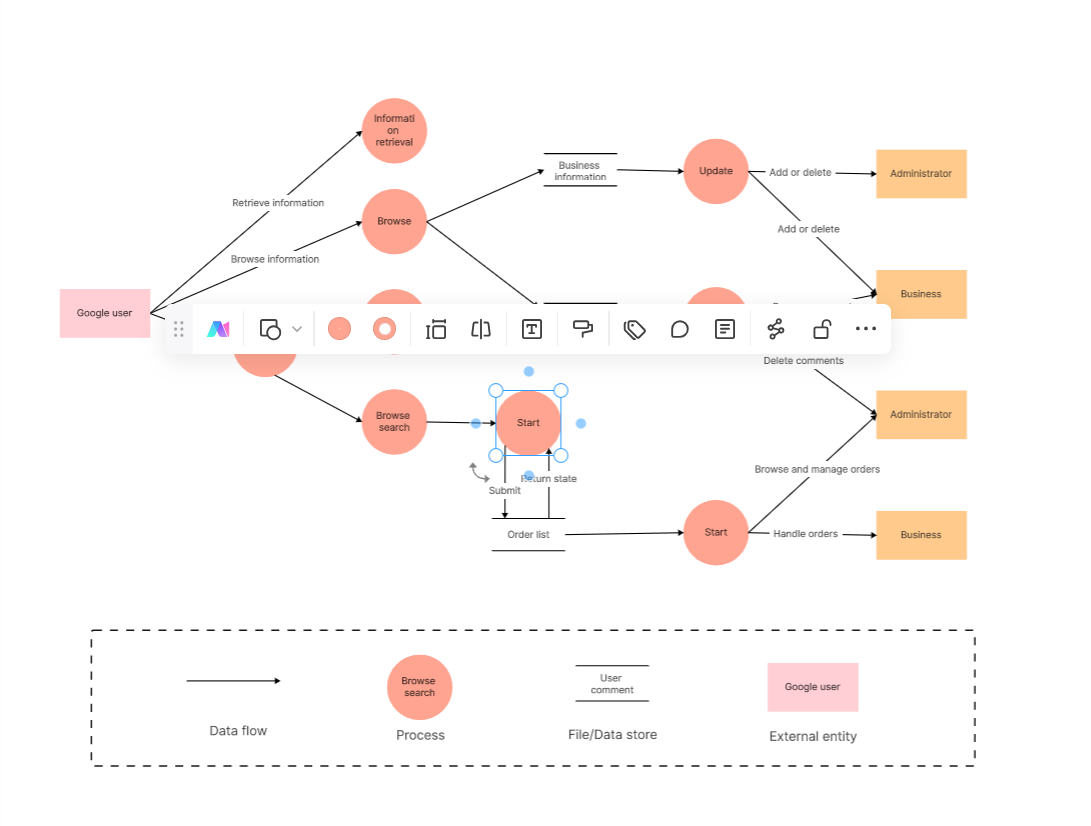
Step 3. Organizing Your Diagram
Boardmix allows you to arrange your diagram for optimal clarity. Use the tool's drag-and-drop feature to move symbols around until your DFD logically and clearly represents your system's data flow.
Step 4. Saving and Sharing Your DFD
Once you're satisfied with your diagram, Boardmix automatically saves your work to the cloud, allowing access from any location. You can also easily share your DFD with team members for collaborative editing or reviewing.
Step 5. Revision and Iteration
Creating a DFD is often an iterative process that requires refining as you gain more understanding of your system. With Boardmix's version control feature, you can comfortably edit and track changes in your diagram.
Boardmix offers a user-friendly interface that simplifies the creation of a Data Flow Diagram online. By representing data flows visually, organizations can achieve better comprehension of their processes, enabling more informed decision-making.
Tips and Tricks on Creating a Data Flow Diagram Online
Creating a Data Flow Diagram (DFD) online can seem like a daunting task, especially for beginners. But with the right tools and guidance, anyone can create an effective DFD. In this section, we share some useful tips and tricks to help you create an efficient DFD online.
- Clearly Define Your Scope
Before you begin creating your DFD, it's crucial to clearly define the scope of your diagram. Determine what processes or systems you want to include in the DFD and keep it limited to that scope. Avoiding scope creep ensures a focused and manageable diagram.
- Use Standardized Symbols
While creating a DFD, it's crucial to use standardized symbols for entities, processes, data stores, and data flows. This ensures consistency and clarity in your diagram, making it easier for others to understand.
- Maintain a Logical Flow
An effective DFD follows a logical flow of data from one point to another. Make sure that your diagram has a clear start and end point, and the data flows between these points in a logical sequence.
- Use Meaningful Labels
When labeling the components of your DFD, use clear and meaningful names that accurately represent what they stand for. This enhances the readability and effectiveness of your diagram.
- Validate Your Diagram
Before finalizing your DFD, validate it with relevant stakeholders to ensure its accuracy and comprehensibility. Make any necessary adjustments based on their feedback.
- Use Online Tools Like Boardmix
Online tools like Boardmix make creating DFDs a breeze. With pre-made template, drag-and-drop functionality, a variety of standard symbols, and collaborative features, you can create a professional-looking DFD with ease.
- Revise as Necessary
Remember that a DFD is a dynamic tool. As processes change or more information becomes available, don't hesitate to revise and update your diagram to reflect these changes.
With these tips and tricks in mind, creating a Data Flow Diagram online should be an achievable task. Remember, the goal is to create a clear, comprehensive representation of data flow within your system, aiding understanding and decision-making.


