


A decision tree branches from questions to outcomes. It can be a diagram of rules chosen by a team or a machine-learning model that learns splits from data. Those uses share a visual structure, but building a diagram and training a model are different tasks.
Part 1. What is a Decision Tree?
In a decision diagram, internal nodes contain questions, branches show the answers and leaf nodes show outcomes. In a trained decision tree, an algorithm selects feature tests from data to predict a target, such as a class label or a numerical value.
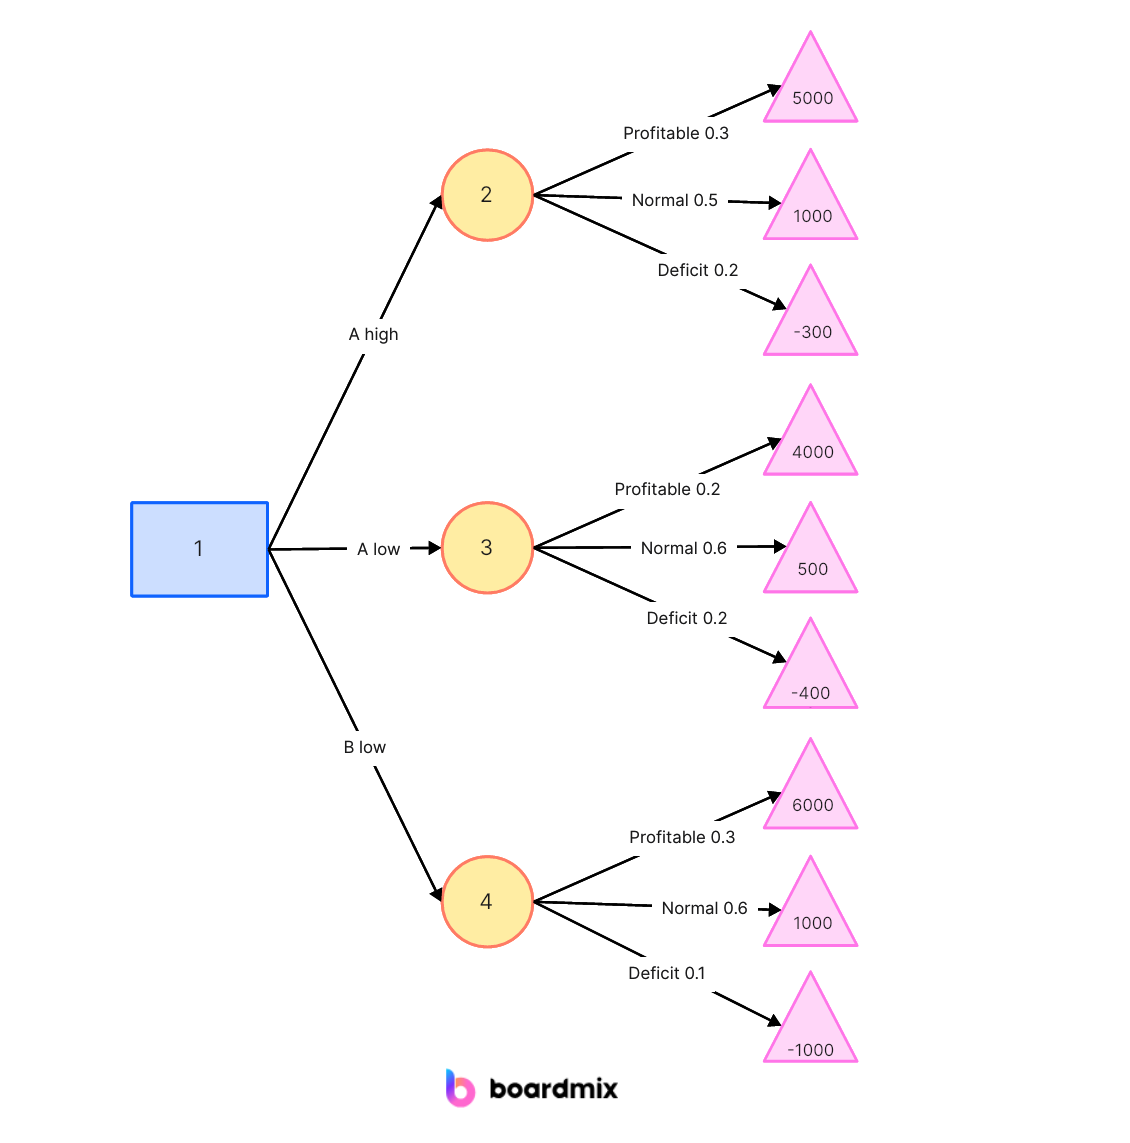
The decision tree algorithm recursively splits the dataset into subsets based on the selected features and their thresholds, aiming to create branches that result in homogeneous subsets with respect to the target variable. This process continues until a stopping criterion is met, such as reaching a specified depth or achieving a minimum number of instances in a leaf node.
A small tree can be easy to interpret, but a deep tree can fit noise rather than useful patterns. Categorical-data support and missing-value handling depend on the implementation. The scikit-learn decision-tree documentation explains its supported behavior and limitations.
Part 2. How Do Decision Trees Work?
Decision trees work by recursively splitting the dataset into subsets based on the values of input features. The goal is to create a tree structure that makes decisions or predictions about a target variable. Here's a step-by-step explanation of how decision trees work:
Selecting the Best Feature:
At each internal node of the tree, the algorithm selects the feature that provides the best split. The "best split" is determined by a criterion such as Gini impurity (for classification problems) or mean squared error (for regression problems).
The training algorithm evaluates candidate features and split points using the chosen criterion. Which candidates it examines depends on the algorithm and its settings.
Splitting the Dataset:
Once the best feature and threshold are chosen, the dataset is divided into two subsets based on this split. Instances that satisfy the condition go to one child node, while instances that do not go to the other child node.
Repeating the Process:
The process is then applied recursively to each subset at the child nodes. The algorithm selects the best feature for each subset and creates further splits.
This recursive process continues until a stopping criterion is met, such as reaching a specified depth, having a minimum number of instances in a leaf node, or achieving a specific level of purity.
Assigning Predictions:
Once the tree is built, the leaf nodes contain the final decisions or predictions. For classification problems, the majority class in a leaf is assigned as the predicted class. For regression problems, the mean or median of the target variable in a leaf is used as the prediction.
Handling Categorical Variables:
Some implementations support categorical features directly; others require encoding them as numbers. Follow the chosen library’s requirements and fit any preprocessing on the training data rather than the test set.
Dealing with Overfitting:
Decision trees are prone to overfitting, capturing noise in the training data. To address this, techniques like pruning (removing branches that do not provide significant improvements) and setting a maximum depth for the tree are employed.
Follow one record from the root to a leaf to read a prediction. For example, a support-routing diagram might first ask whether an account can be accessed, then branch to sign-in help or the next troubleshooting question. Those manually chosen rules are not a learned model.
Part 3. How to Build a Decision Tree
Building a decision tree involves a step-by-step process, and there are various algorithms to construct decision trees. One of the commonly used algorithms is the CART (Classification and Regression Trees) algorithm. Here's a general guide on how to build a decision tree:
- Prepare and split the data: define the input features and target, then set aside test data. Fit cleaning and encoding steps using training data to avoid leaking information from the test set.
- Choose a Splitting Criterion: Select a criterion to measure the impurity or homogeneity of a node. Common criteria for classification problems include Gini impurity and entropy, while mean squared error is often used for regression problems.
- Select the Best Split: Determine the feature and threshold that result in the best split based on the chosen criterion. This involves evaluating the impurity or error reduction for each possible split.
- Split the Data: Divide the dataset into two subsets based on the selected feature and threshold. Instances that meet the condition go to one branch, while others go to the other branch.
- Recursively Repeat the Process: Apply the same process recursively to each subset, selecting the best feature and threshold for each node until a stopping criterion is met.
- Stopping Criteria: Decide on stopping criteria to prevent overfitting. Common stopping criteria include Maximum tree depth. Minimum number of instances in a leaf node. A threshold for impurity reduction.
- Assign Predictions: At the leaf nodes, assign predictions based on the majority class for classification or the mean (or median) for regression.
- Interpret the Tree: Once the tree is built, interpret it to understand the decision-making process. You can visualize the tree to see how features contribute to predictions.
- Test and Evaluate: Test the decision tree on a separate test dataset to evaluate its performance. Calculate metrics such as accuracy, precision, recall, or mean squared error, depending on the problem.
Part 4. Free Decision Tree Template
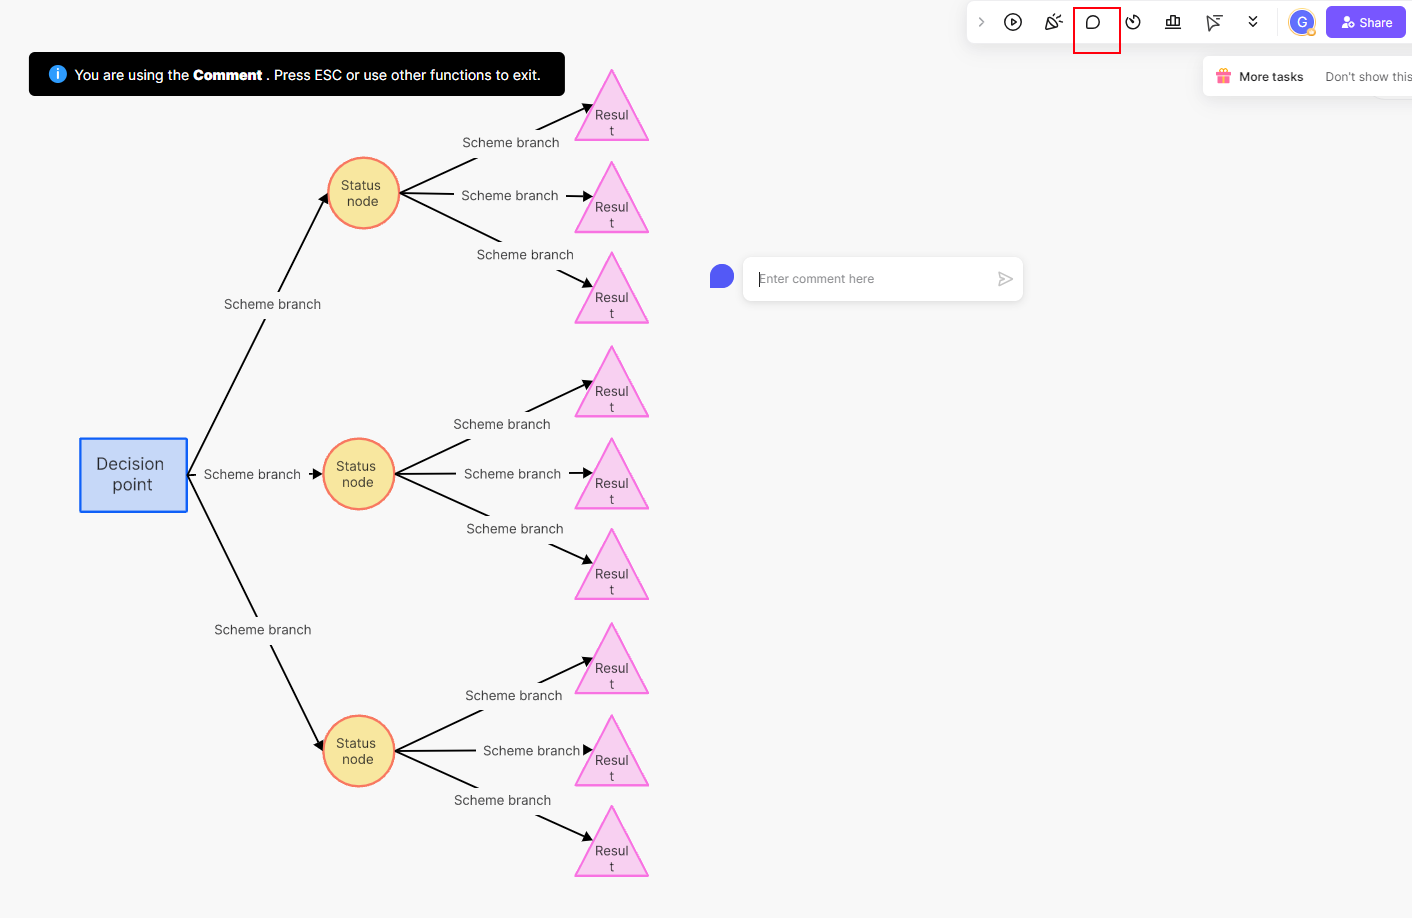
Use a Boardmix decision-tree template to draw and discuss a rule-based diagram. You can also illustrate selected paths from a trained model. Drawing the branches on a whiteboard does not train, evaluate or execute a machine-learning model.
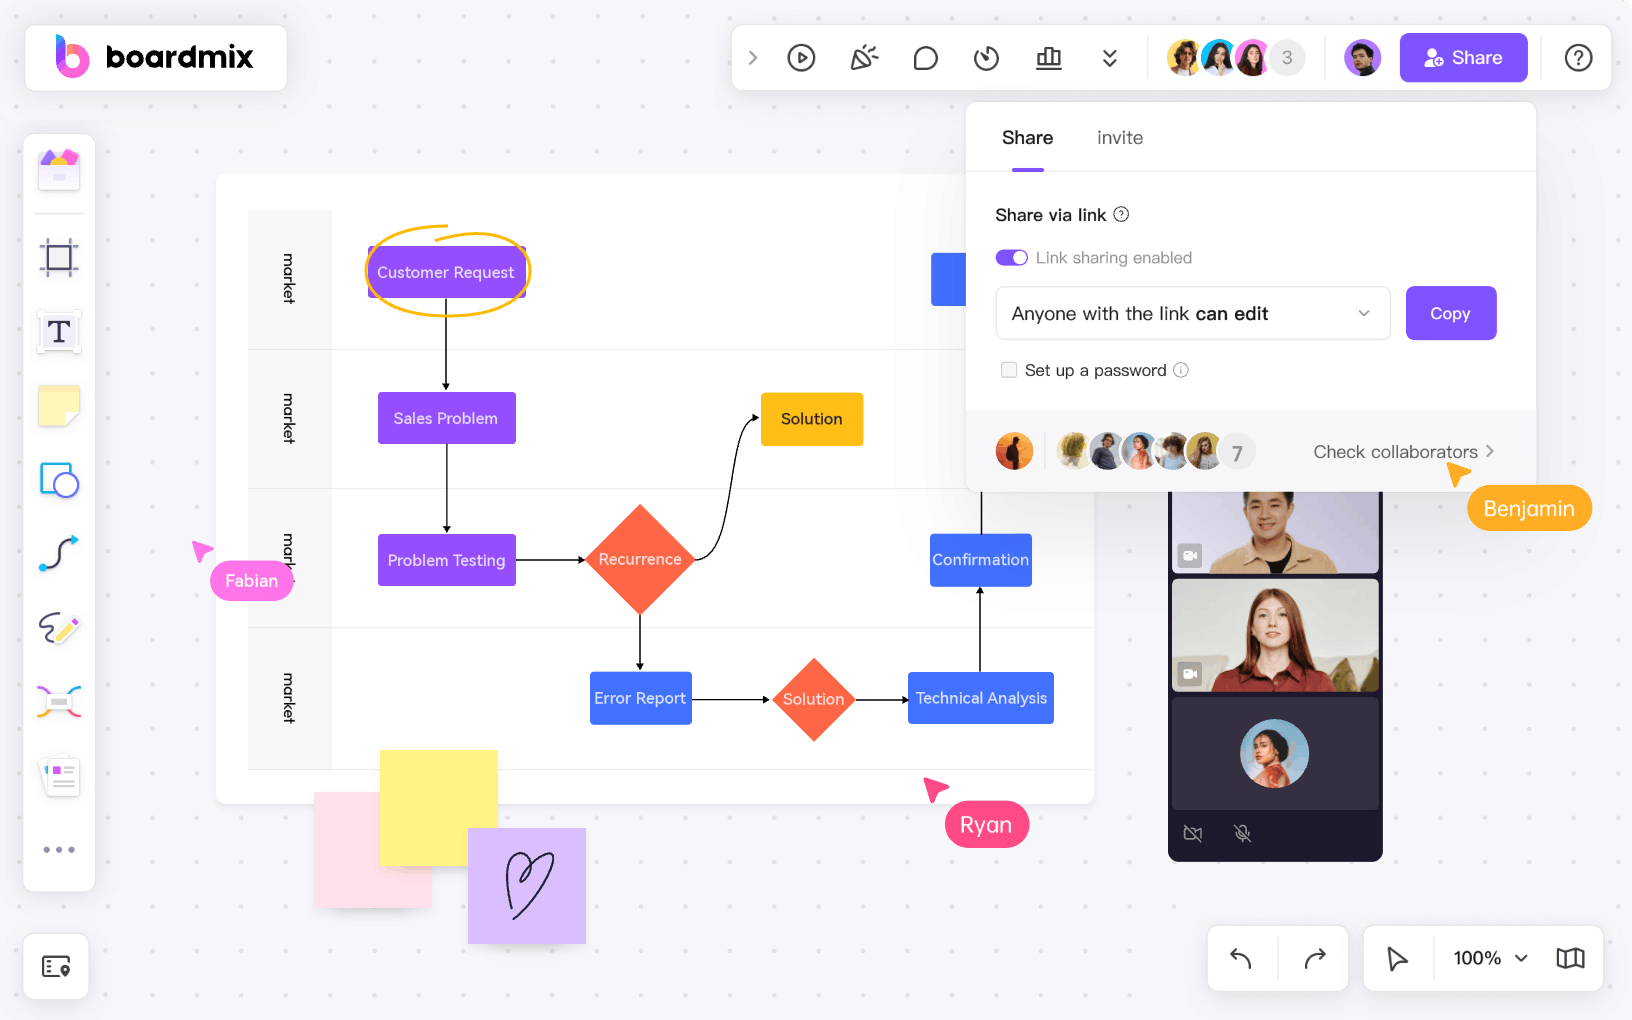
How to Build a Decision Tree with Boardmix
1. Start by opening a new Boardmix board.

2. Select the 'Decision Tree' template from our extensive library of templates.
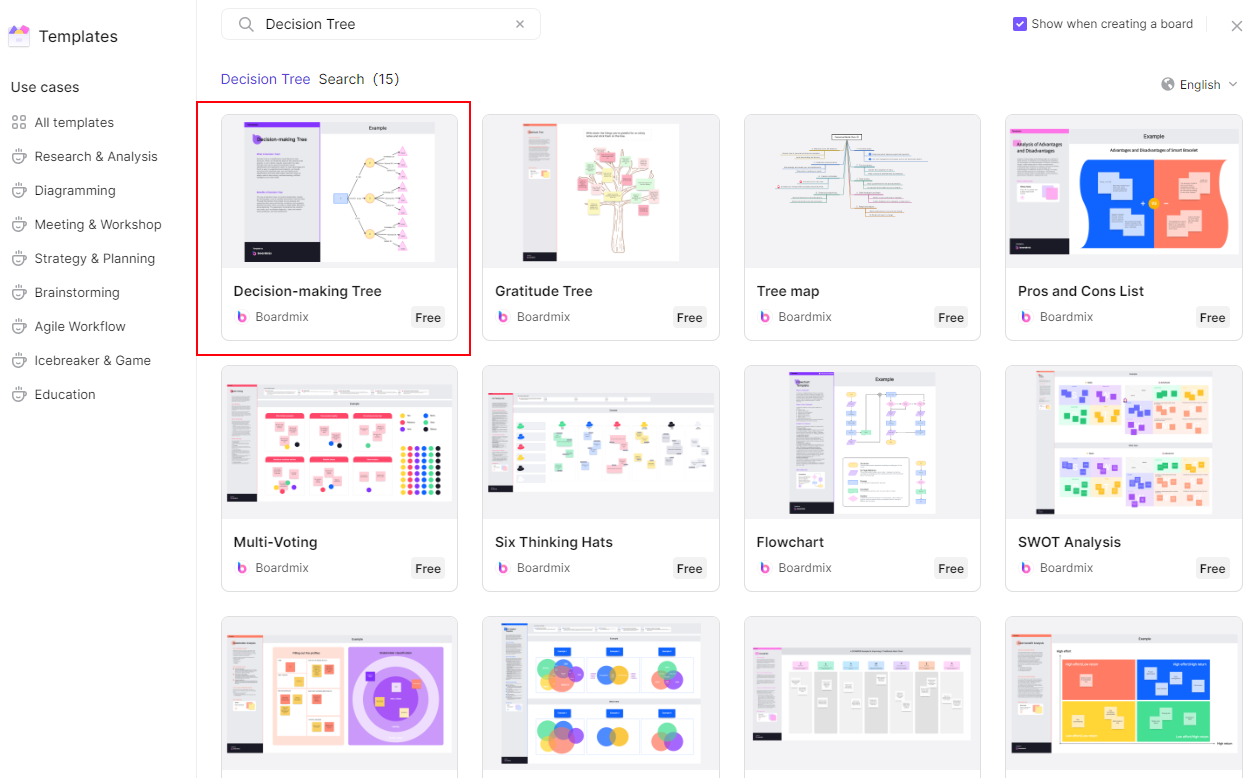
3. Begin by identifying your main decision or problem at the left side of the tree.
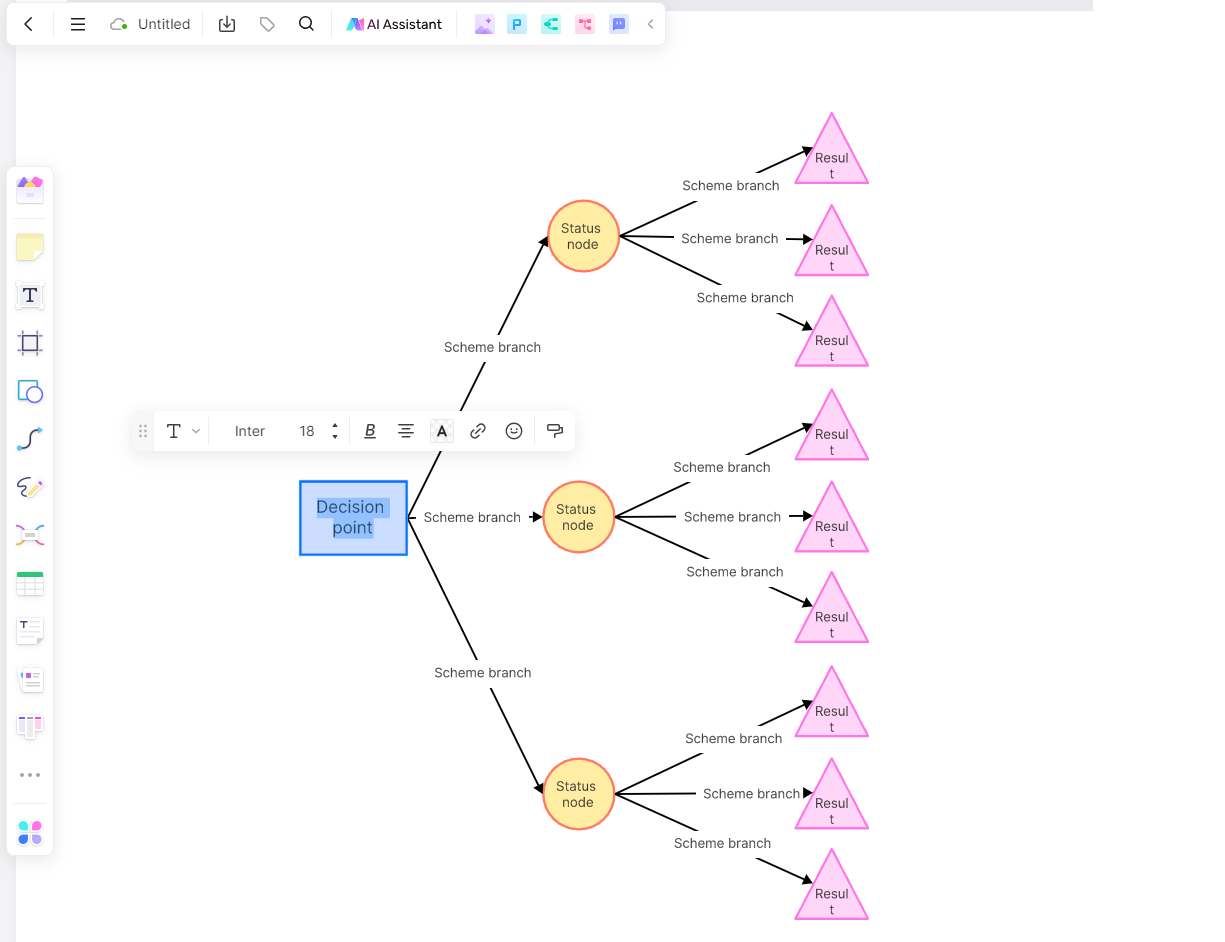
4. From there, branch out to possible options or outcomes.
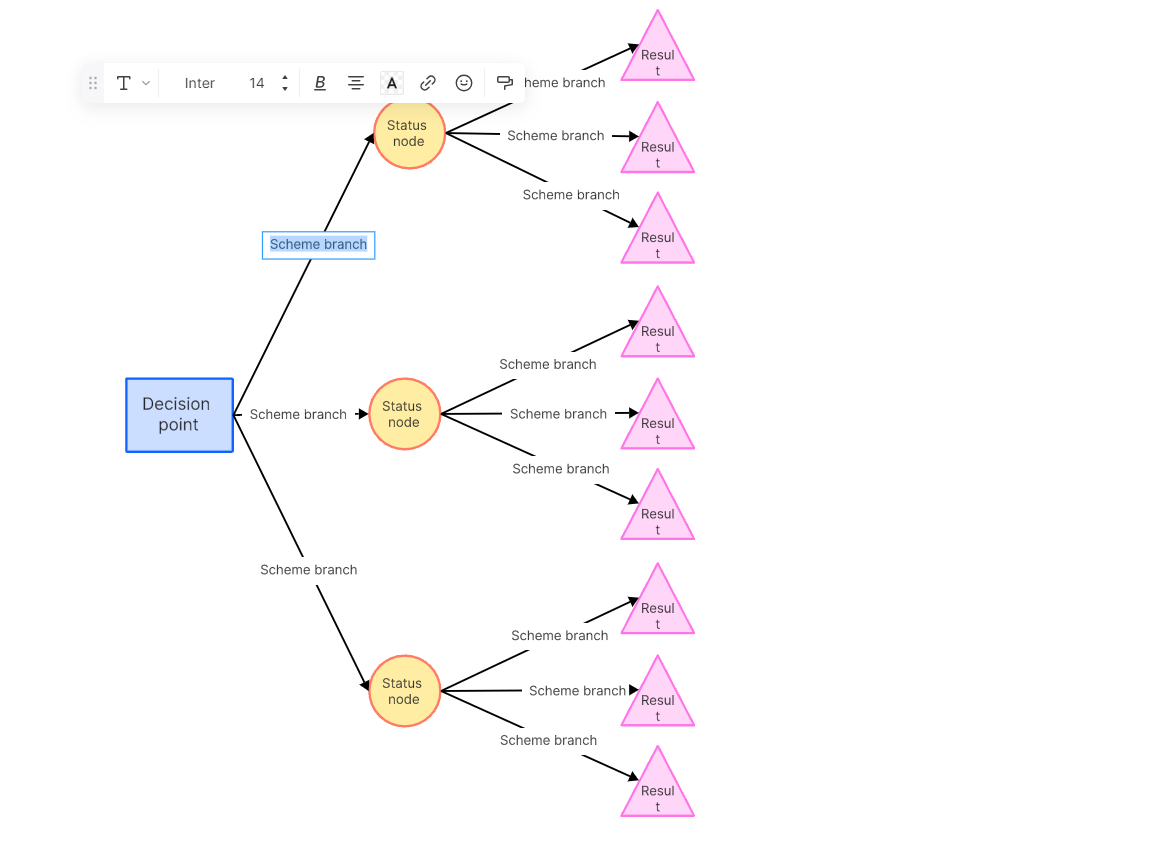
5. Add the branches relevant to the decision. Label outcomes clearly and include an “unknown” or escalation route where the information may be incomplete.
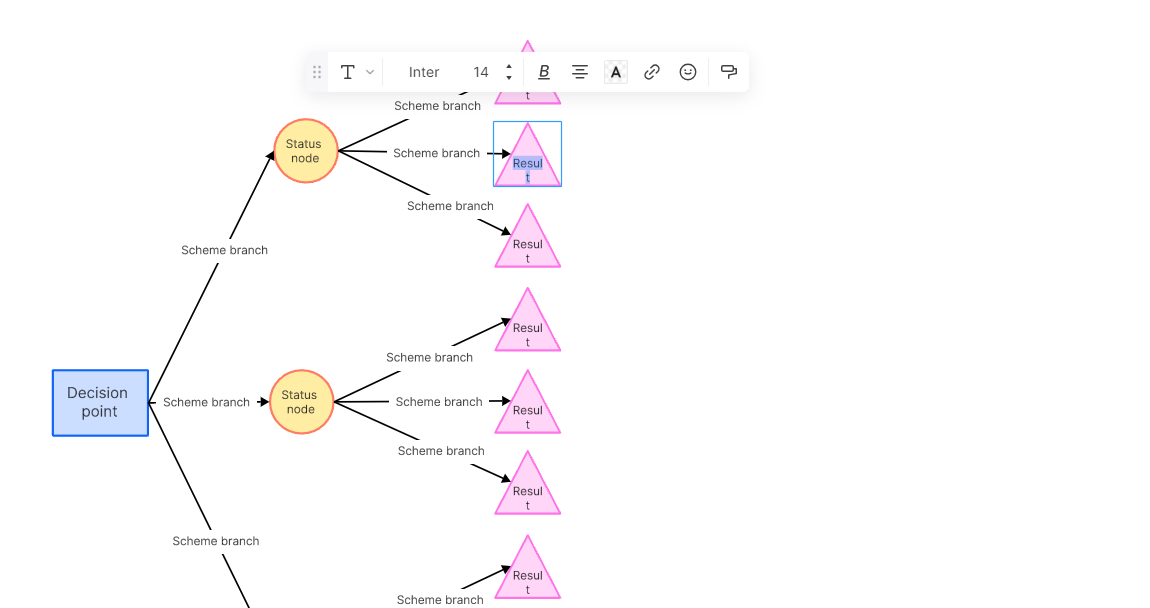
6. Collaborate in real-time with your team to weigh the pros and cons, add notes, and make informed decisions.
Part 5. Applications of Decision Tree
Decision trees find applications in various fields due to their versatility, interpretability, and ability to handle both classification and regression tasks. Some common applications of decision trees include:
Classification Problems: Decision trees are widely used for classification tasks. Examples include spam detection, credit scoring, medical diagnosis, and sentiment analysis in natural language processing.
Regression Problems: Decision trees can be applied to regression problems, such as predicting house prices, sales forecasting, and any scenario where the goal is to predict a continuous numerical value.
Healthcare research: a decision tree can be studied as a predictive model using appropriate data and clinical evaluation. A diagram or an unvalidated model is not a basis for choosing a diagnosis or treatment.
Finance: In finance, decision trees are used for credit scoring, fraud detection, and investment decision-making. They help assess the creditworthiness of individuals, detect potentially fraudulent transactions, and make investment decisions based on market conditions.
Marketing and Customer Relationship Management (CRM): Decision trees are employed in marketing to segment customers, personalize marketing campaigns, and predict customer behavior. CRM applications use decision trees to optimize customer interactions and improve customer satisfaction.
Image and Speech Recognition: Decision trees can be part of systems for image recognition and speech processing. They help classify and interpret visual or auditory data, contributing to applications like facial recognition and voice command systems.
These are just a few examples, and the versatility of decision trees makes them applicable in various domains where decision-making based on data patterns is required.
Part 6. Advantages of Decision Trees
Decision trees offer several advantages, making them a popular choice in various applications across different industries. Here are some key advantages of decision trees:
Interpretability: Decision trees provide a transparent and easy-to-understand representation of decision-making processes. The tree structure visually displays how decisions are made at each node, making it accessible to non-experts and facilitating the interpretation of results.
Mixed feature types: trees can work with numerical features and appropriately represented categories. The encoding and supported data types depend on the software.
No Assumption of Linearity: Decision trees do not assume a linear relationship between features, making them effective in capturing complex, non-linear patterns in the data. This is in contrast to linear models that assume a linear relationship between input variables.
Preprocessing: trees generally do not need feature scaling, but data still needs validation. Check missing-value support, inconsistent categories and information leakage before fitting the model.
Automatically Handle Feature Selection: Decision trees can automatically select relevant features by giving more importance to features that contribute to the model's ability to split and classify the data effectively. This can simplify the feature selection process.
Handle Interaction Effects: Decision trees naturally capture interaction effects between different features, allowing them to model complex relationships in the data where the effect of one feature depends on the value of another.
It's important to note that while decision trees have these advantages, they also have limitations, such as being prone to overfitting. Techniques like pruning and using ensemble methods can help mitigate some of these challenges.
Conclusion
Choose the task first. For a human decision process, define the questions and outcomes with the people who will use it. For a predictive model, train on suitable data and evaluate performance on data the model has not seen.
Use Boardmix to make the decision path visible, annotate assumptions and discuss unclear branches with your team. Keep model training and evaluation in the software used for your analysis.