


What is an ER Diagram?
An Entity-Relationship Diagram (ER diagram) is a type of data modeling technique that visually illustrates an information system's entities and the relationships between those entities. It's used in database design to organize complex systems by demonstrating how things interact with one another within the system.
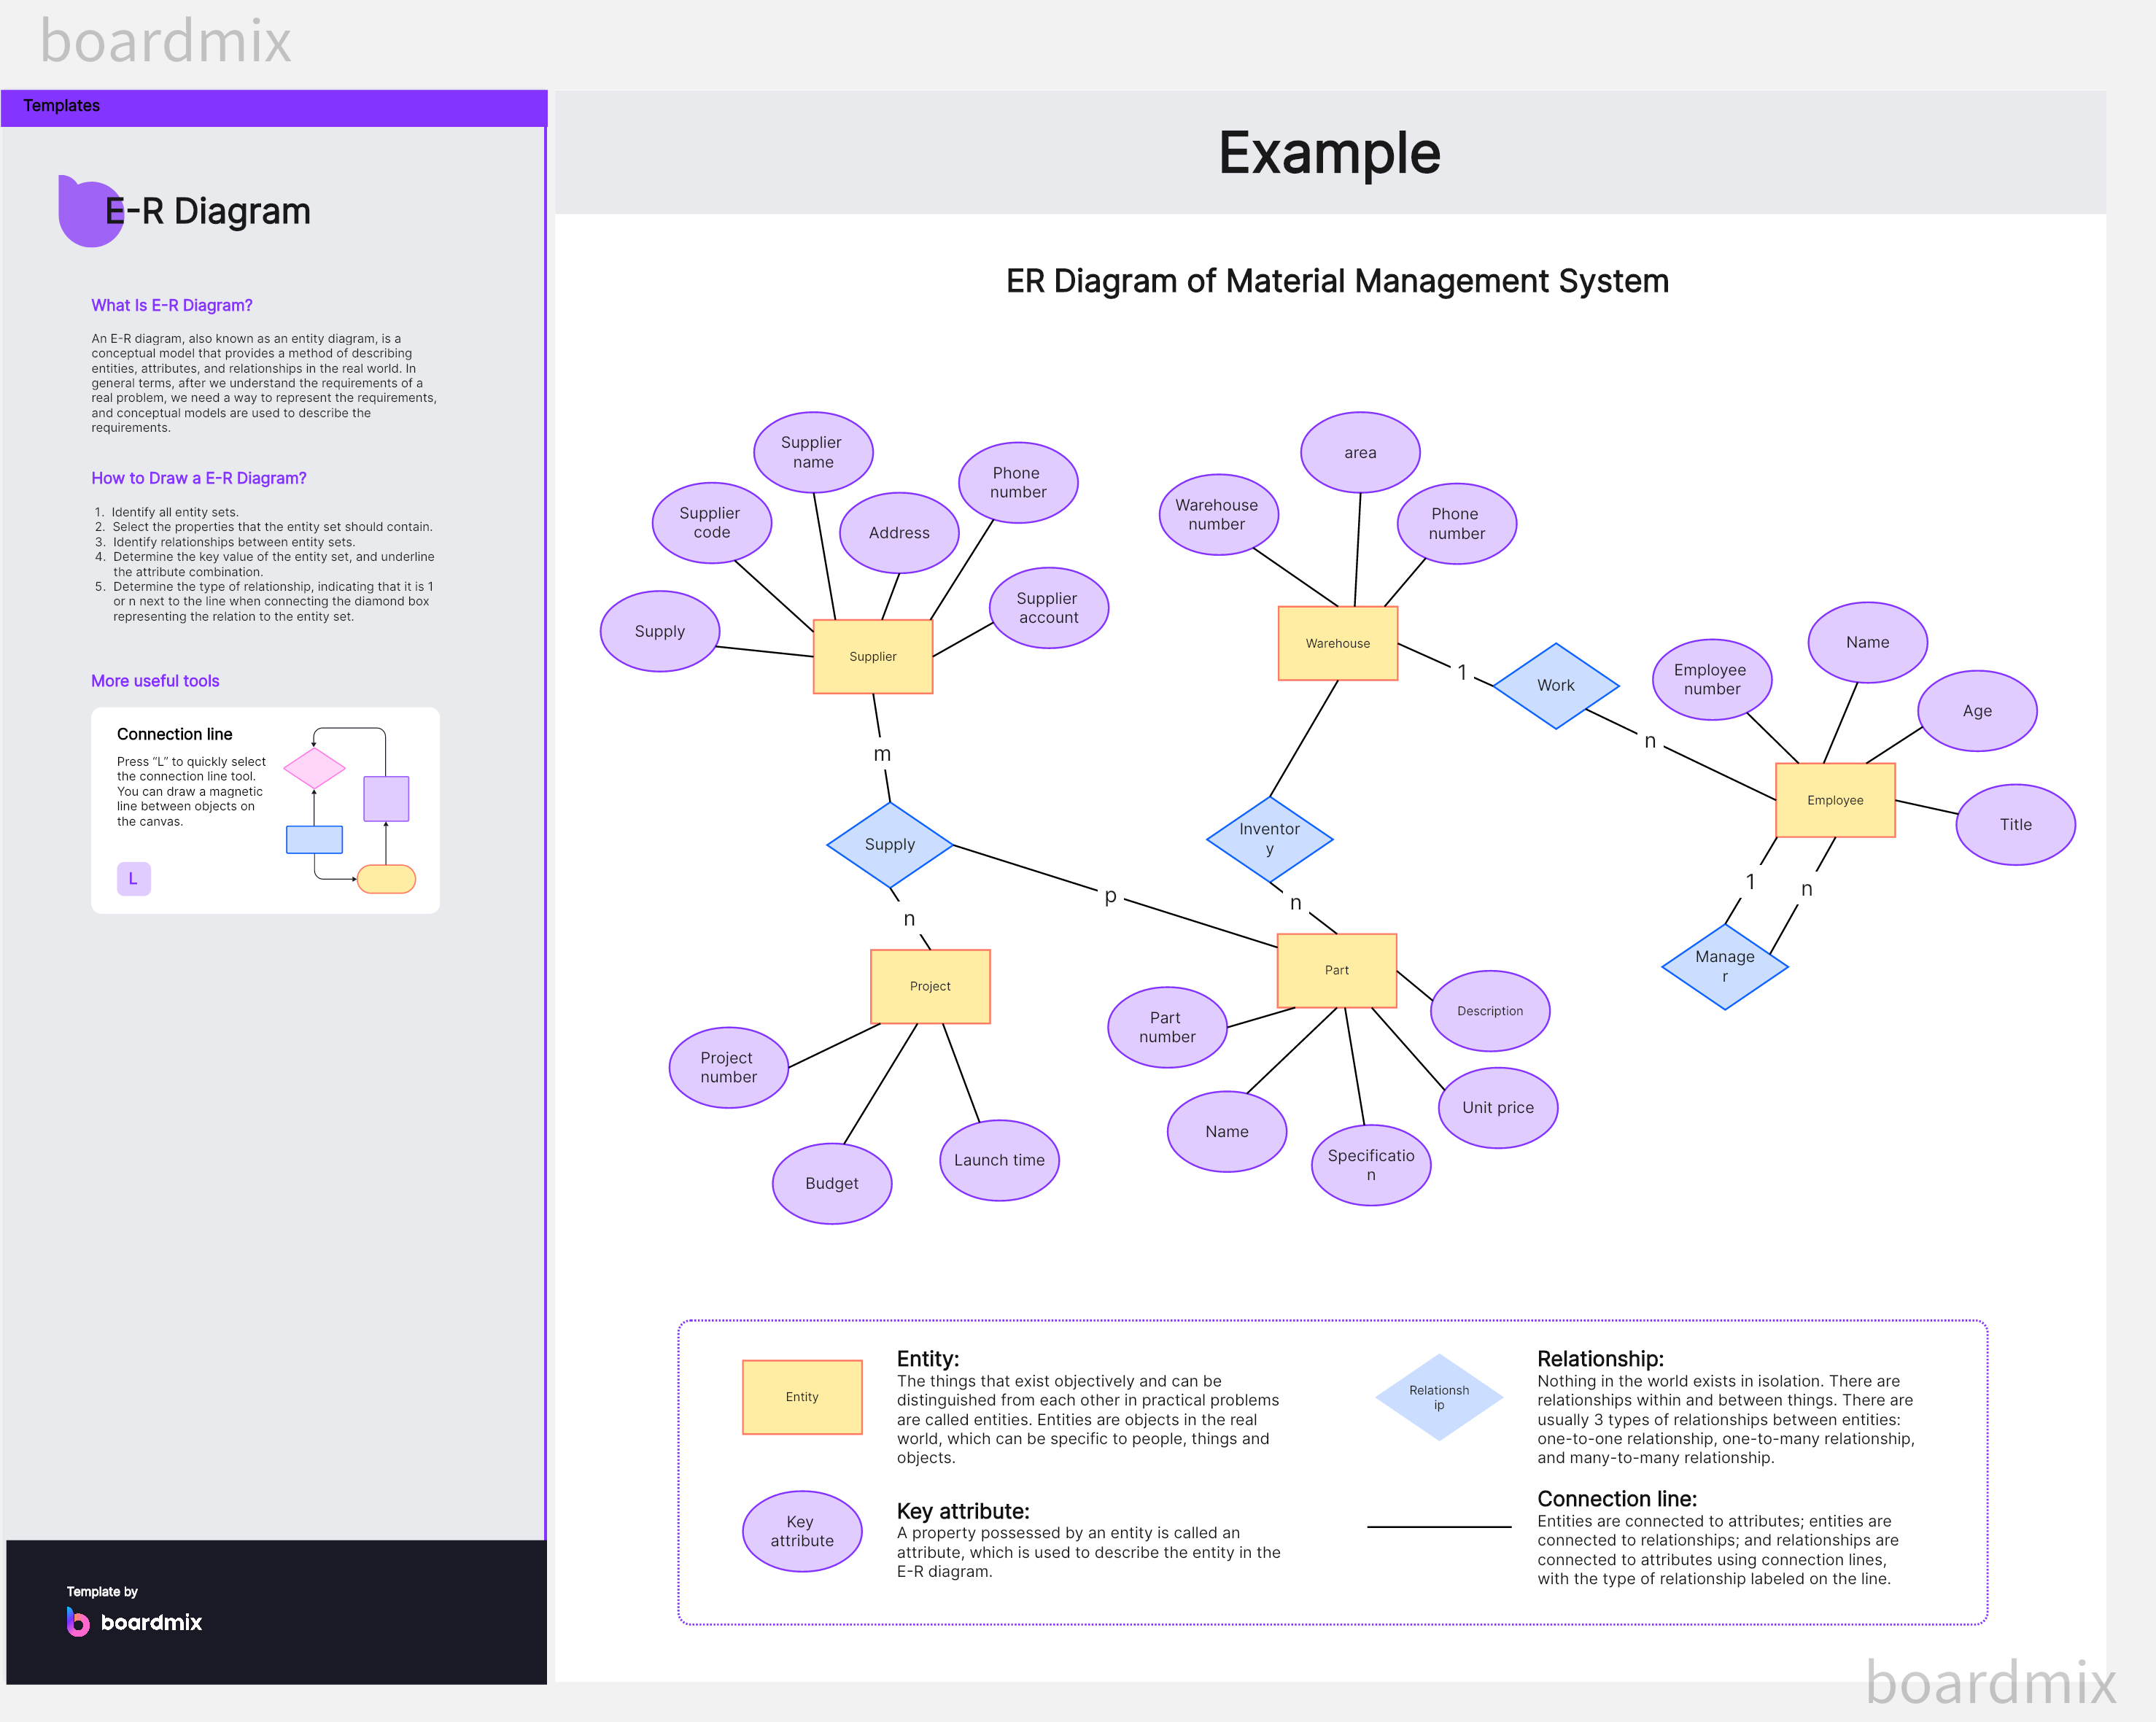
In an ER Diagram, entities are depicted as rectangles, while relationships are shown as diamonds that connect entities. Moreover, the properties of these entities, also known as attributes, are depicted as ovals. Each element in the diagram serves a purpose in understanding the database's structure, thereby enabling efficient database management and accurate communication of system processes.
ER Diagrams serve as the blueprint for constructing databases, and they can represent real-world scenarios in an uncomplicated yet detailed manner. They aid in determining what type of information to store, how data elements relate to one another, and where to implement rules to ensure data accuracy and consistency.
In a nutshell, ER Diagrams are instrumental in facilitating a structured and systematic approach towards database design, making them essential tools in fields like software engineering, systems analysis, and information systems.
What are the Types of ER Diagrams?
ER Diagrams, short for Entity-Relationship Diagrams, are used in database design to illustrate the logical structure of databases. There are three primary types of ER Diagrams: Conceptual ER Diagrams, Logical ER Diagrams, and Physical ER Diagrams.
1. Conceptual ER Diagrams
Conceptual ER Diagrams, also known as high-level ER diagrams or conceptual data models, depict a high-level view of an organization's data requirements without going into detailed specifics. They mainly identify entities and relationships without defining the attributes of these entities. These diagrams are typically used in the initial stages of system development to define the scope and general contents of organizational databases.
2. Logical ER Diagrams
Logical ER Diagrams, or logical data models, delve deeper than the conceptual model to define the specific attributes of entities and their relationships. This diagram specifies primary keys for each entity and describes how they interact through relationships. However, it doesn't detail how these elements will be implemented physically within the database system. It's often used to structure the database's design further before moving into the physical modeling phase.
3. Physical ER Diagrams
Physical ER Diagrams, also known as physical data models, take the specifications detailed in the logical ER diagrams and translate them into physical components that make up a database system. They include all table structures, primary and foreign keys, stored procedures, triggers, indexes, and other details that will be physically implemented in the database system. They are usually created by database designers who are familiar with the specific software being used for database implementation.
By understanding these three types of ER diagrams, you can better understand and participate in various phases of database modeling and design.
When to Use an ER Diagram?
Entity Relationship diagrams are a versatile tool that can be beneficial in a variety of scenarios:
- Database Design
ER Diagrams are predominantly used during the design phase of a database. They help in visualizing the different entities, relationships, and attributes involved. This can aid in structuring the database effectively and spotting potential issues before they arise during development.
- Documentation
An ER diagram can serve as a valuable piece of documentation, providing a clear and concise visual representation of the database's structure. This can be helpful for both the development team and any stakeholders, as it allows everyone to understand the system more easily.
- Analyzing Existing Systems
If you're working with an existing database system, creating an ER diagram can help you better understand its structure and operations. This can be particularly useful when making modifications or troubleshooting problems.
- Communication Tool
When communicating complex systems to stakeholders, ER diagrams can act as a simplified map that outlines how everything fits together without requiring technical knowledge.
- Educational Purposes
ER diagrams are commonly used in academic settings for teaching database design and related concepts. They provide students with a hands-on approach to understand how different elements of a database interact with each other.
In summary, ER diagrams are most commonly used during the design phase of a database project, but their versatility makes them an invaluable tool in various situations related to database understanding, analysis, communication, and education.
How to Database Modeling with ER Diagram?
Entity Relationship diagrams are graphical representations that model data in a database. They show entities (like users, products, orders), their attributes (like names, addresses, emails), and the relationships between these entities (like 'orders' placed by 'users'). Whether you're building a simple blog or a complex e-commerce site, ER diagrams help structure your data effectively. Here's a complete guide on database modeling with ER diagrams.
1. Understanding the Components of an ER Diagram
The building blocks of an ER diagram are entities, attributes, and relationships:
1.1 Entities
Entities represent objects or concepts in the database, like 'User' or 'Product.' They are typically nouns and are represented as rectangles in ER diagrams.
1.2 Attributes
Attributes are characteristics or properties of entities. For instance, a 'User' entity might have attributes like 'Name,' 'Email,' and 'Address.' Attributes are depicted as ovals connected to their respective entities.
1.3 Relationships
Relationships denote how entities interact with each other. For example, a 'User' might 'Place' an 'Order.' Relationships are represented as diamond shapes connecting related entities.
2. Developing an ER Diagram
Once you understand the components of ER diagrams, follow these steps to develop one:
2.1 Identify Entities
Determine all entities in your system. An e-commerce system, for example, might include 'User,' 'Product,' 'Order,' and 'Payment' entities.
2.2 Identify Attributes
Next, pinpoint all the attributes associated with each entity. Remember, these attributes should be atomic, meaning they can't be further divided into meaningful components.
2.3 Determine Relationships
Identify the interactions between your entities and how they relate to each other.
2.4 Review and Refine
After sketching your initial diagram, review and refine it for any errors or improvements. It's critical to ensure that the diagram accurately reflects your system's data requirements.
3. Leveraging ER Diagrams for Effective Database Design
ER diagrams provide a blueprint for designing databases. By visualizing the structure and relationships of data, they facilitate effective database design. Furthermore, they encourage normalization, which avoids redundancy and inconsistencies in data storage.
4. Using ER Diagram Tools
Many online tools, such as Boardmix, can assist you in creating detailed ER diagrams. They offer easy-to-use interfaces with drag-and-drop capabilities and provide options to export your diagrams in various formats.
To sum up, ER diagrams play a crucial role in database modeling. They provide a clear visual representation of the data and its interrelationships, paving the way for a well-structured and efficient database system. By understanding their components and developing them effectively, you can create a robust foundation for your database.
How to Create an ER Diagram on Boardmix?
There are some free ER templates on Boardmix and you can also create your own online. Creating an Entity-Relationship (ER) Diagram on Boardmix can be accomplished by following these steps:

- Log into Boardmix
The first step is to sign in to your Boardmix account. If you don't have one, you can create an account on the Boardmix website.

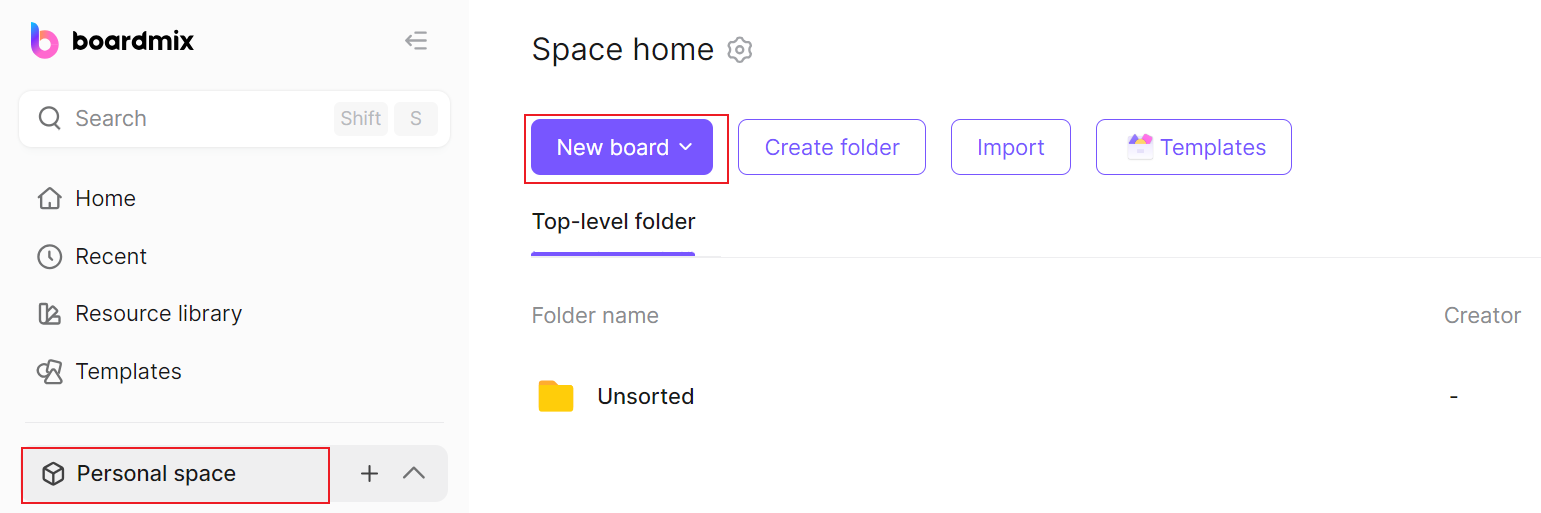
- Open a New Project
Once you are logged in, click on "New Project" or select a pre-existing project where you wish to add the ER Diagram.
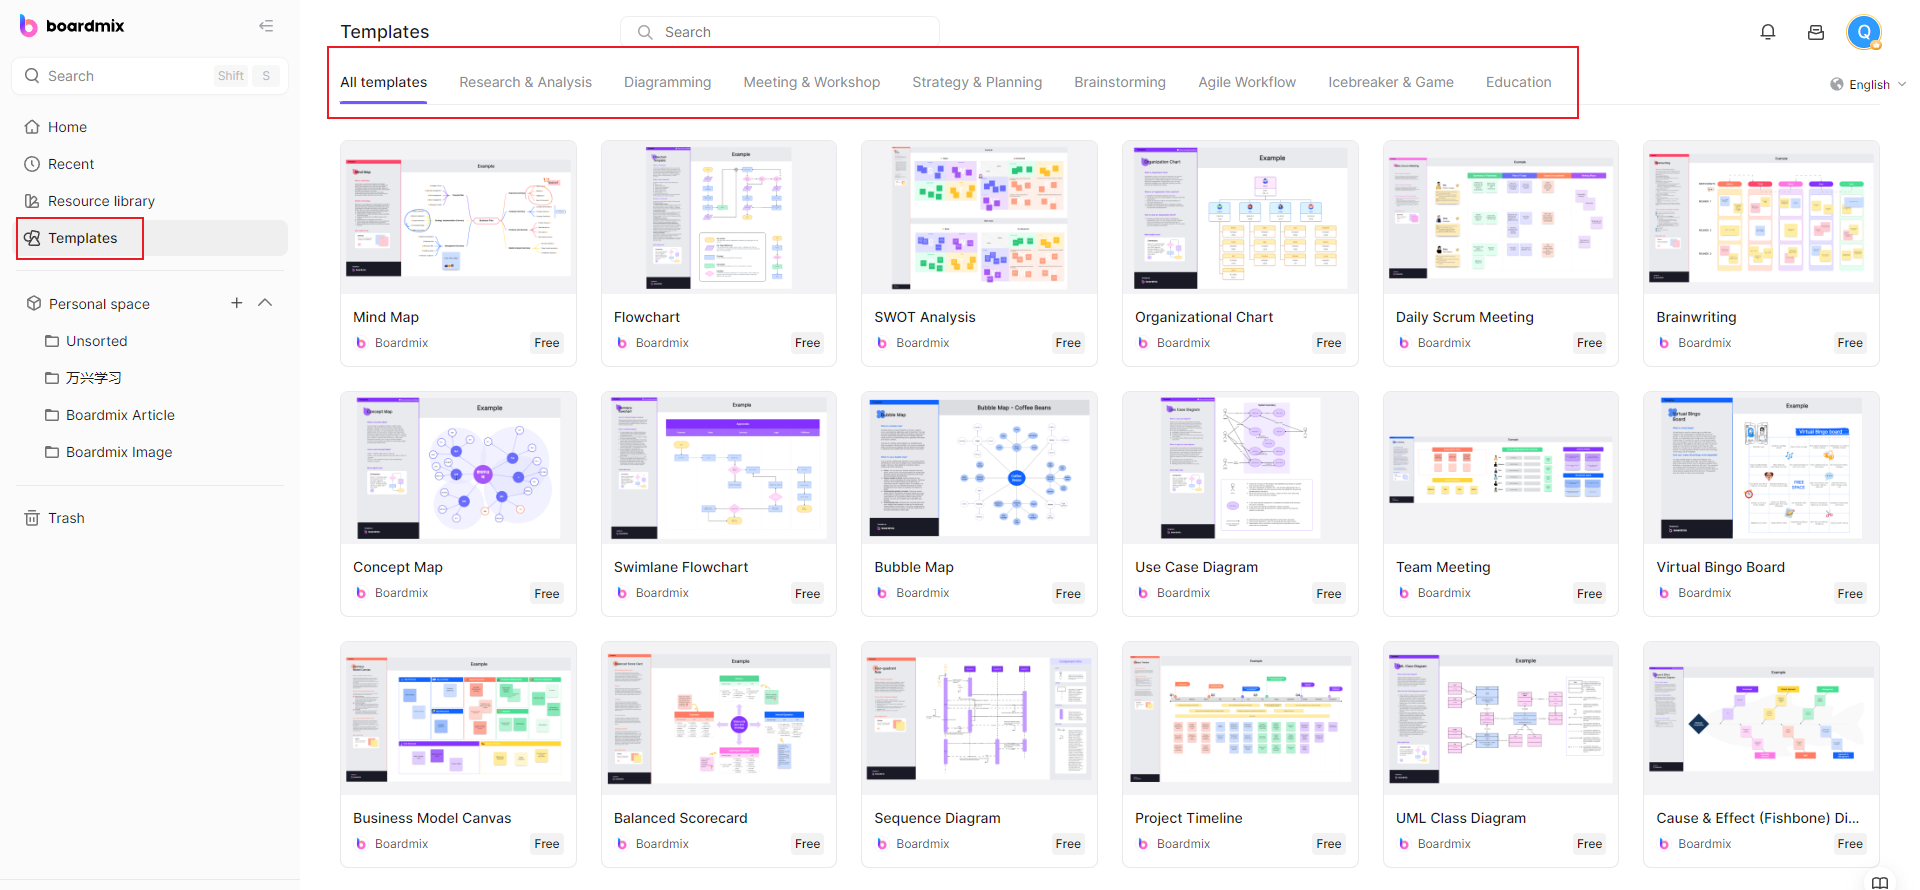
- Choose ER Diagram Type
Boardmix usually offers several diagram types to choose from. Search for ER diagram and choose an Entity-Relationship Diagram template.
- Add Entities
Use the toolbar on the left side of the interface to add entities to your diagram. Simply click on the entity icon (typically a rectangle), then click on the diagram space to place it. You can label the entity as needed (e.g., "User", "Product", "Order").
- Add Attributes
Next, add attributes to your entities by clicking on the attribute icon (usually an oval) and then clicking on the diagram near the respective entity. Label these appropriately (e.g., "Name", "Email" for a "User" entity).
- Create Relationships
Establish relationships by clicking on the relationship icon (often a diamond) and then drawing lines between the entities you want to link.
- Review and Edit
Take a moment to review your diagram. Boardmix allows you to easily edit labels, move components around, and delete anything as needed.
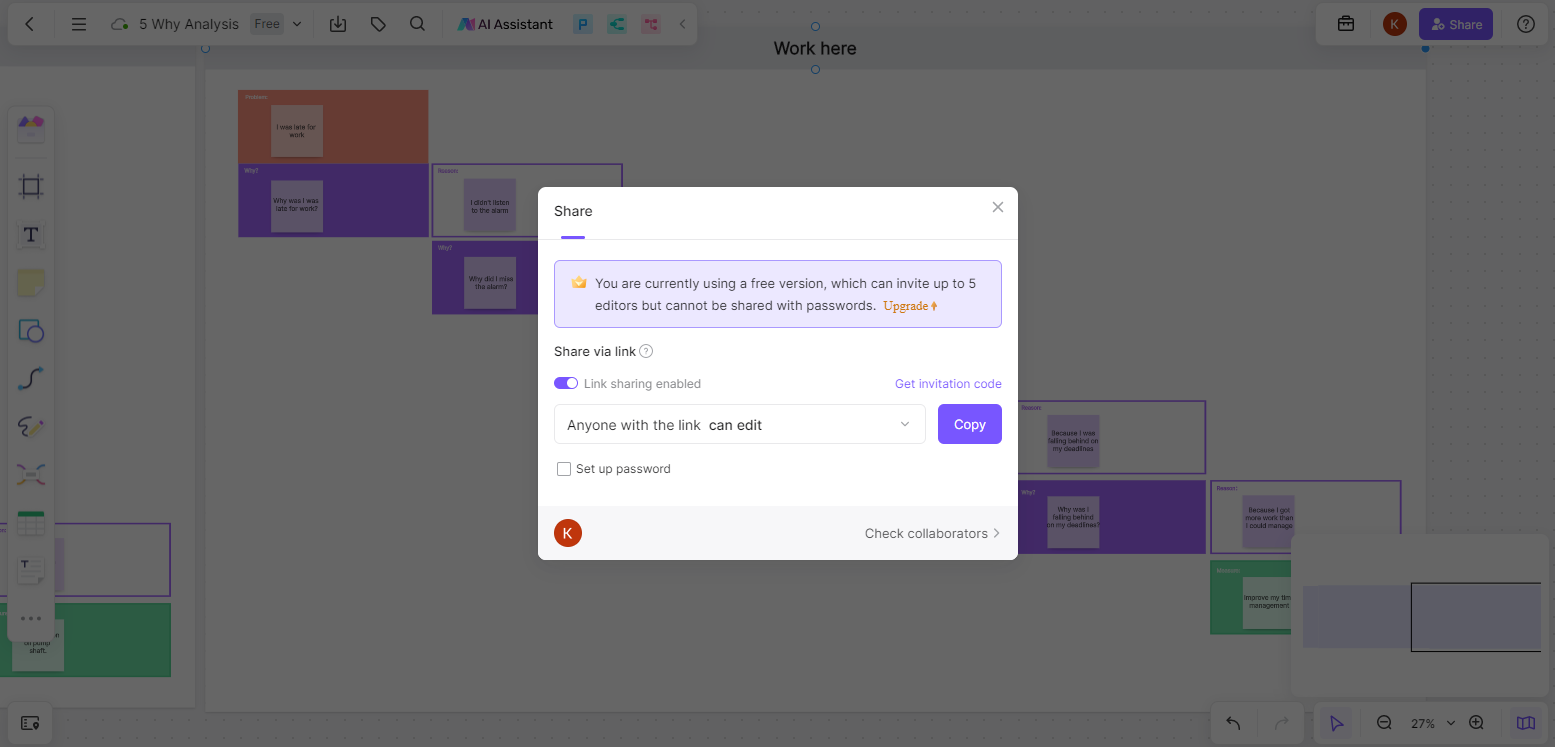
- Save and Share
After you've verified that all information is correct, save your diagram. Boardmix also allows you to share your diagrams with others, export them into different formats, or print them directly.
In these easy steps, you can create an ER diagram using Boardmix that not only helps in effective database modeling but also improves communication within your team.


