


In the rapidly advancing field of computer science, clarity and precision are paramount. Complex algorithms, data structures, and processes require careful planning and thorough understanding. This is where the role of flowcharts comes into play. A flowchart can serve as a universal language bridging the gap between computer science professionals and laymen, providing a clear, visual representation of abstract concepts.
This article will show you what is a flowchart for computer science, why use it and how to make one. Keep reading!
What Is a Flowchart for Computer Science
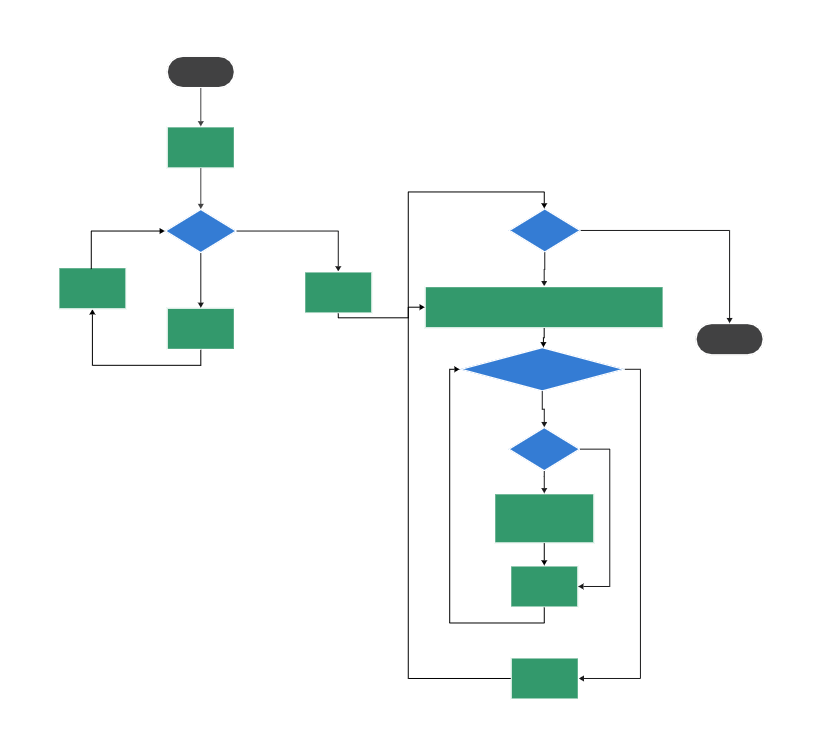
A flowchart for computer science is a graphical representation of an algorithm or a process within the computer science realm. It uses predefined symbols and connecting lines to depict a sequence of operations, leading to a desired outcome.
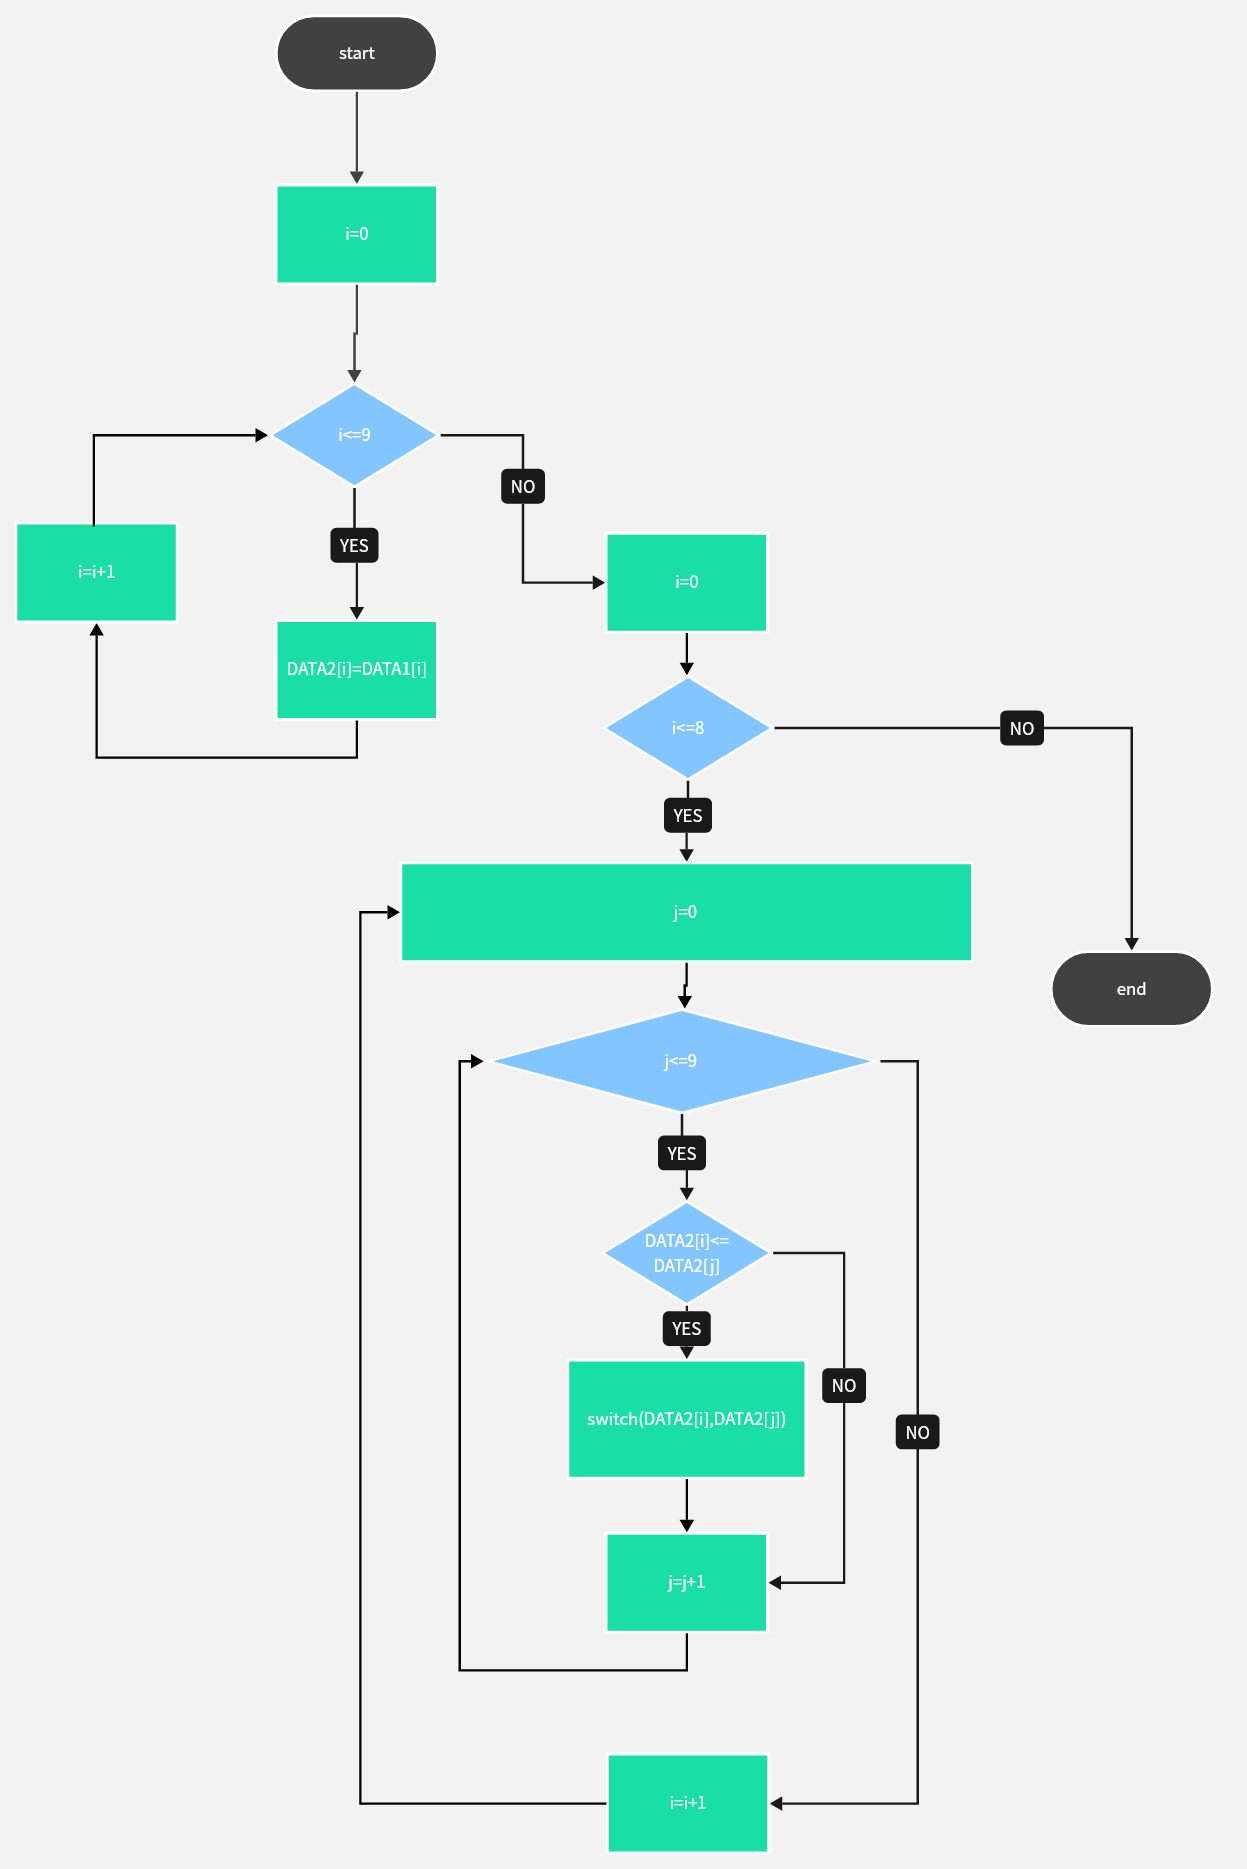
The symbols used in these flowcharts have specific meanings, from representing different processes to denoting decision-making points or indicating the flow of information. These charts help simplify complex concepts, allowing both technical and non-technical individuals to understand a process without requiring in-depth knowledge of coding or computer science.
Why Use a Flowchart for Computer Science
Flowcharts for computer science are incredibly valuable for several reasons. They aid in understanding complex processes and algorithms, like the C language, by breaking them down into simpler steps. They foster better communication among team members, making it easier for everyone involved in a project to visualize how a system works.
Flowcharts also provide a blueprint for programming. By laying out the steps in a flowchart first, you can help avoid potential mistakes or inefficiencies when it comes time to code. Additionally, they help document the workflow for future reference, making troubleshooting and enhancements more efficient.
Benefits of Computer Science Flow Charts
Computer Science flowcharts offer numerous benefits as showed below:
- Efficiency: Flowcharts can help identify bottlenecks, redundancies, or unnecessary steps in a process, thus improving efficiency.
- Clarity: By visualizing an algorithm or process, flowcharts can clarify complex ideas, leading to better comprehension and communication among team members.
- Problem-Solving: Flowcharts can assist in problem-solving by enabling visualization of all possible outcomes and steps in a process.
- Documentation: Flowcharts provide a useful tool for documenting existing processes or systems for future reference.
Computer Science Flow Chart Symbols
Various symbols are used in computer science flowcharts, each with its unique meaning:
- Oval: Represents the start or end of a process.
- Rectangle: Indicates a process or action.
- Diamond: Denotes a decision point.
- Parallelogram: Signifies input or output.
- Arrows: Show the direction of the workflow.
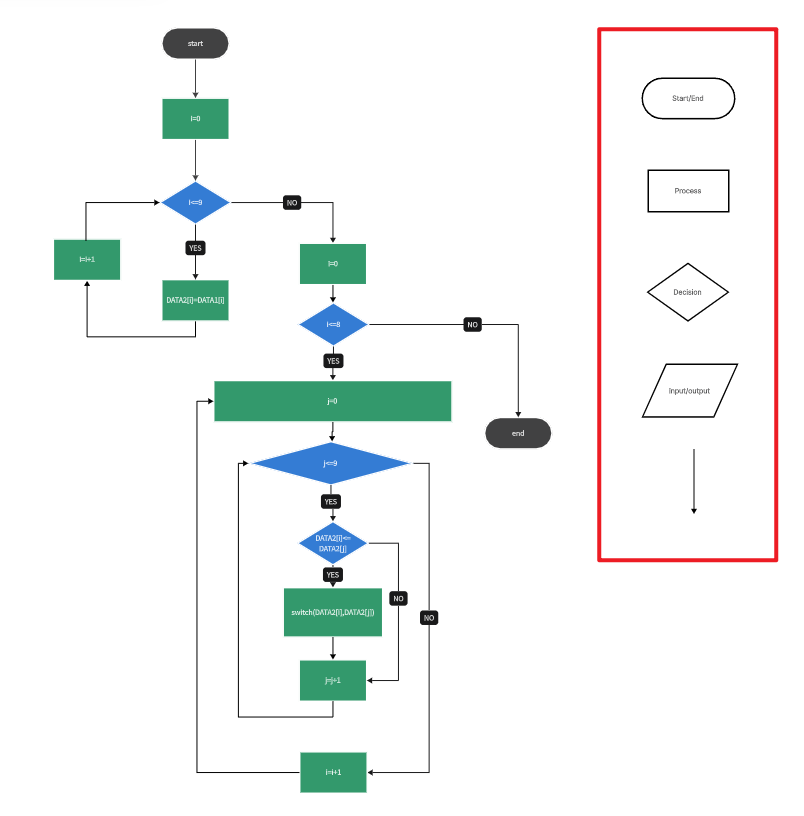
Understanding these symbols is crucial to interpreting and creating effective computer science flowcharts.
How to Make a Flowchart for Computer Science in Boardmix
Flowcharts are an invaluable tool in computer science. They provide a visual representation of an algorithm or process, allowing for easy understanding and analysis. When it comes to creating these flowcharts, Boardmix is a top-tier choice due to its flexibility, extensive features, and user-friendly interface. Here's a step-by-step guide on how to make a flowchart for computer science using Boardmix.

Step 1: Understand Your Algorithm or Process
Before creating your flowchart, make sure you thoroughly understand the algorithm or process you intend to represent. Know what the input is, what the desired output is, and all the steps in between.
Step 2: Create a New Board
Open Boardmix and create a new board.

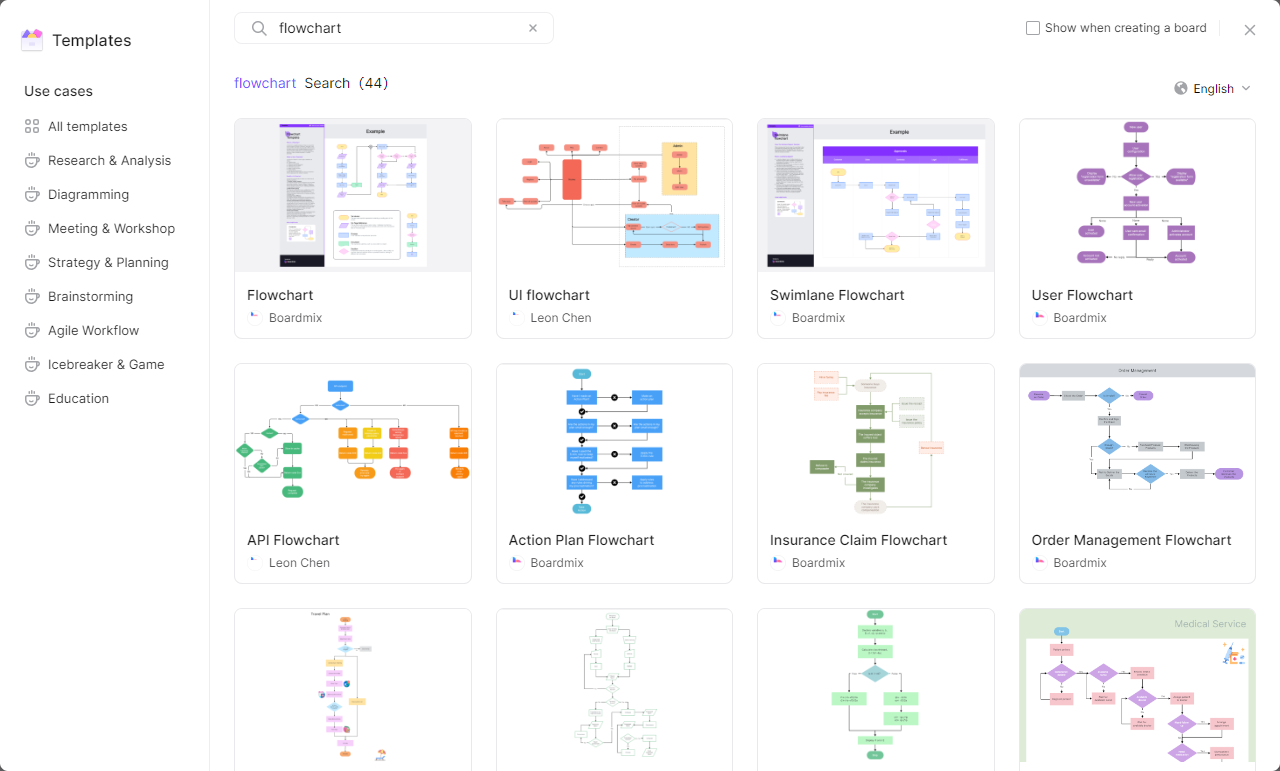
Step 3: Choose a Template or Start from Scratch
Boardmix offers numerous templates which can serve as a starting point. If none of the templates fit your needs, you can start from scratch.
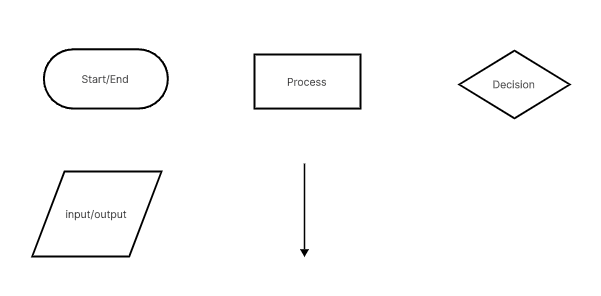
Step 4: Add Flowchart Symbols
Add the necessary flowchart symbols by dragging them onto your workspace from the toolbar. Each symbol represents a specific part of your algorithm:
- Ovals represent the start and end points.
- Rectangles stand for processes or actions.
- Diamonds symbolize decision points.
- Parallelograms indicate input and output.
- Arrows show the direction of workflow.
Step 5: Connect Symbols
Use arrows to connect your symbols in the correct order of operations. You can adjust the direction of arrows as needed.
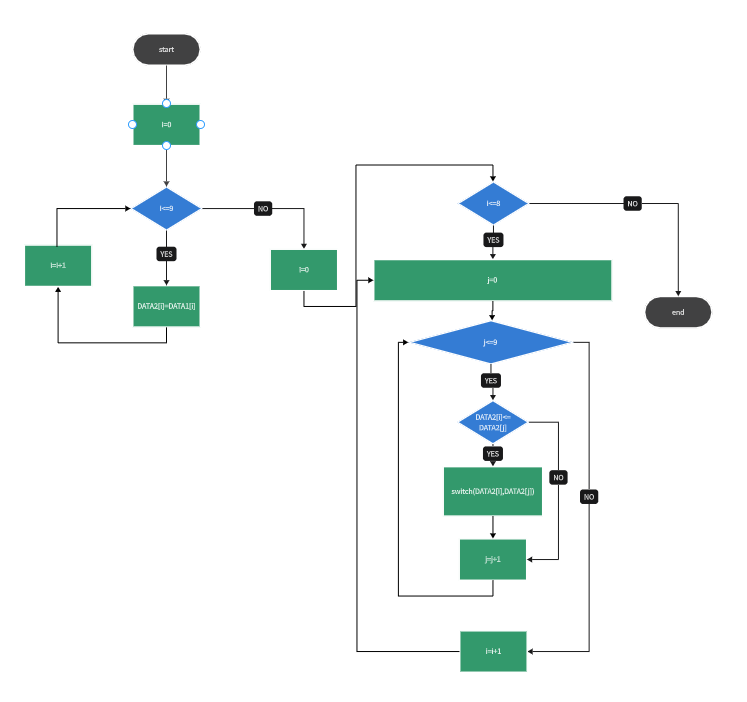
Step 6: Label Symbols
Add text to each symbol to denote its function in the process. Ensure each label is clear and concise.
Step 7: Adjust and Customize Your Flowchart
Boardmix offers customization options like changing colors, fonts, and sizes. Adjust your flowchart as desired to enhance clarity or match your preferred aesthetic.
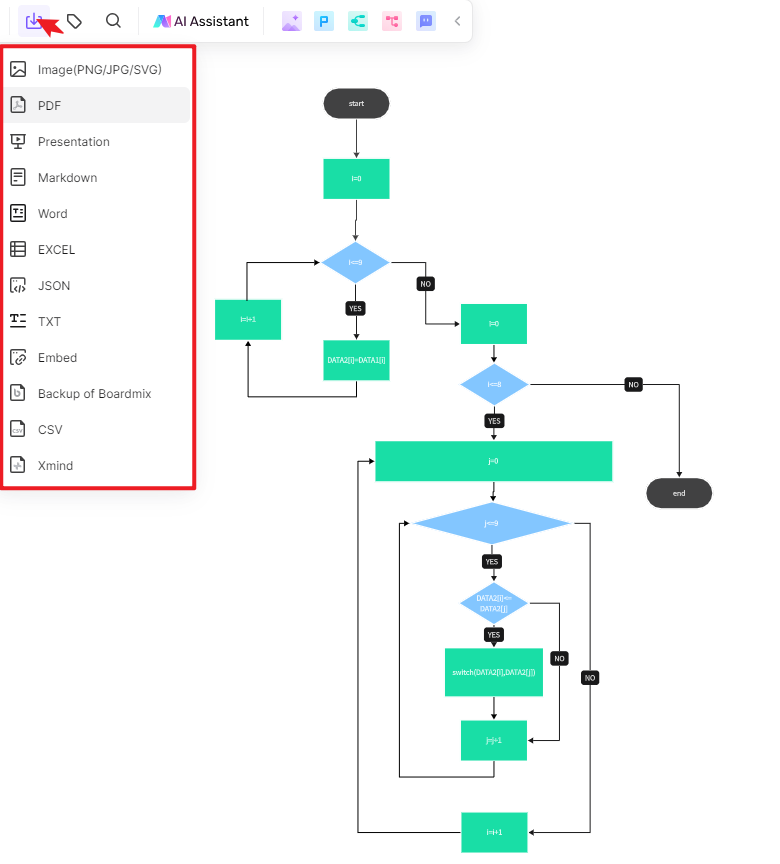
Step 8: Review and Save Your Flowchart
Once your flowchart is complete, review it carefully to ensure accuracy and completeness. When you're satisfied with your work, save your project.
Boardmix offers an easy-to-use platform for creating detailed and clear flowcharts for computer science processes and algorithms. Whether you're designing a simple process or visualizing a complex algorithm, Boardmix has the tools you need to create effective flowcharts.
Tips and Tricks on Making a Flowchart for Computer Science
Flowcharts are an essential tool in computer science, allowing us to visually represent algorithms, systems, and processes. Creating a successful flowchart involves more than just choosing the right shapes and arrows. Here are some practical tips and tricks on making a flowchart for computer science:
- Understand Your Process or Algorithm
Before beginning, ensure you have a thorough understanding of the process or algorithm you plan to represent. This knowledge will allow you to depict the steps accurately and efficiently.
- Use Standard Symbols
To ensure universal comprehension, use standard symbols in your flowchart. Ovals for start/end points, rectangles for actions or processes, diamonds for decisions, and parallelograms for inputs or outputs.
- Keep it Simple
While it's important to be detailed, you also need to avoid unnecessary complexity. Flowcharts should simplify understanding, not complicate it. Ensure your chart is easy to read and comprehend at a glance.
- Use Clear, Concise Labeling
Labels on each symbol should be clear and concise, making it easy for anyone to understand the step it represents.
- Direction Matters
Flowcharts should generally flow from top to bottom or left to right, following conventional reading directions in most cultures.
- Keep Decision Points Clear
Decision points, represented by diamond symbols, can become complex. Make sure that each decision point only has one question and two outcomes – typically 'yes' or 'no'.
- Use Sub-Flowcharts
For more complex processes, consider using sub-flowcharts to break down individual components. This keeps the main flowchart simple, while still providing necessary details.
- Test Your Flowchart
After creating your flowchart, test it to ensure it accurately represents the process or algorithm. Run through each step to check for logical errors or missed steps.
- Review and Refine
After testing your flowchart, refine it based on what you’ve learned. This may involve reordering steps, relabeling actions, or even changing your symbols.
- Use Flowchart Software
Today's flowchart software tools offer powerful features for designing, editing, and sharing your flowcharts. They can make the process easier, faster, and more collaborative.
Remember that creating effective flowcharts is both an art and a science. With practice and attention to detail, you can create flowcharts that clearly convey complex computer science concepts.


