


Introduction
Flowcharts are an essential tool in the world of visual communication, offering a clear and concise way to represent complex processes and workflows. They are used across various industries, from software development to business management, to educate, inform, and streamline operations. With the ever-evolving landscape of digital technology, it's crucial to understand the different types of flowcharts and their visual representation techniques to ensure your message is communicated effectively. In this article, we'll explore the various flowchart types and how they can enhance your ability to convey information visually.
9 Different Types of Flowcharts
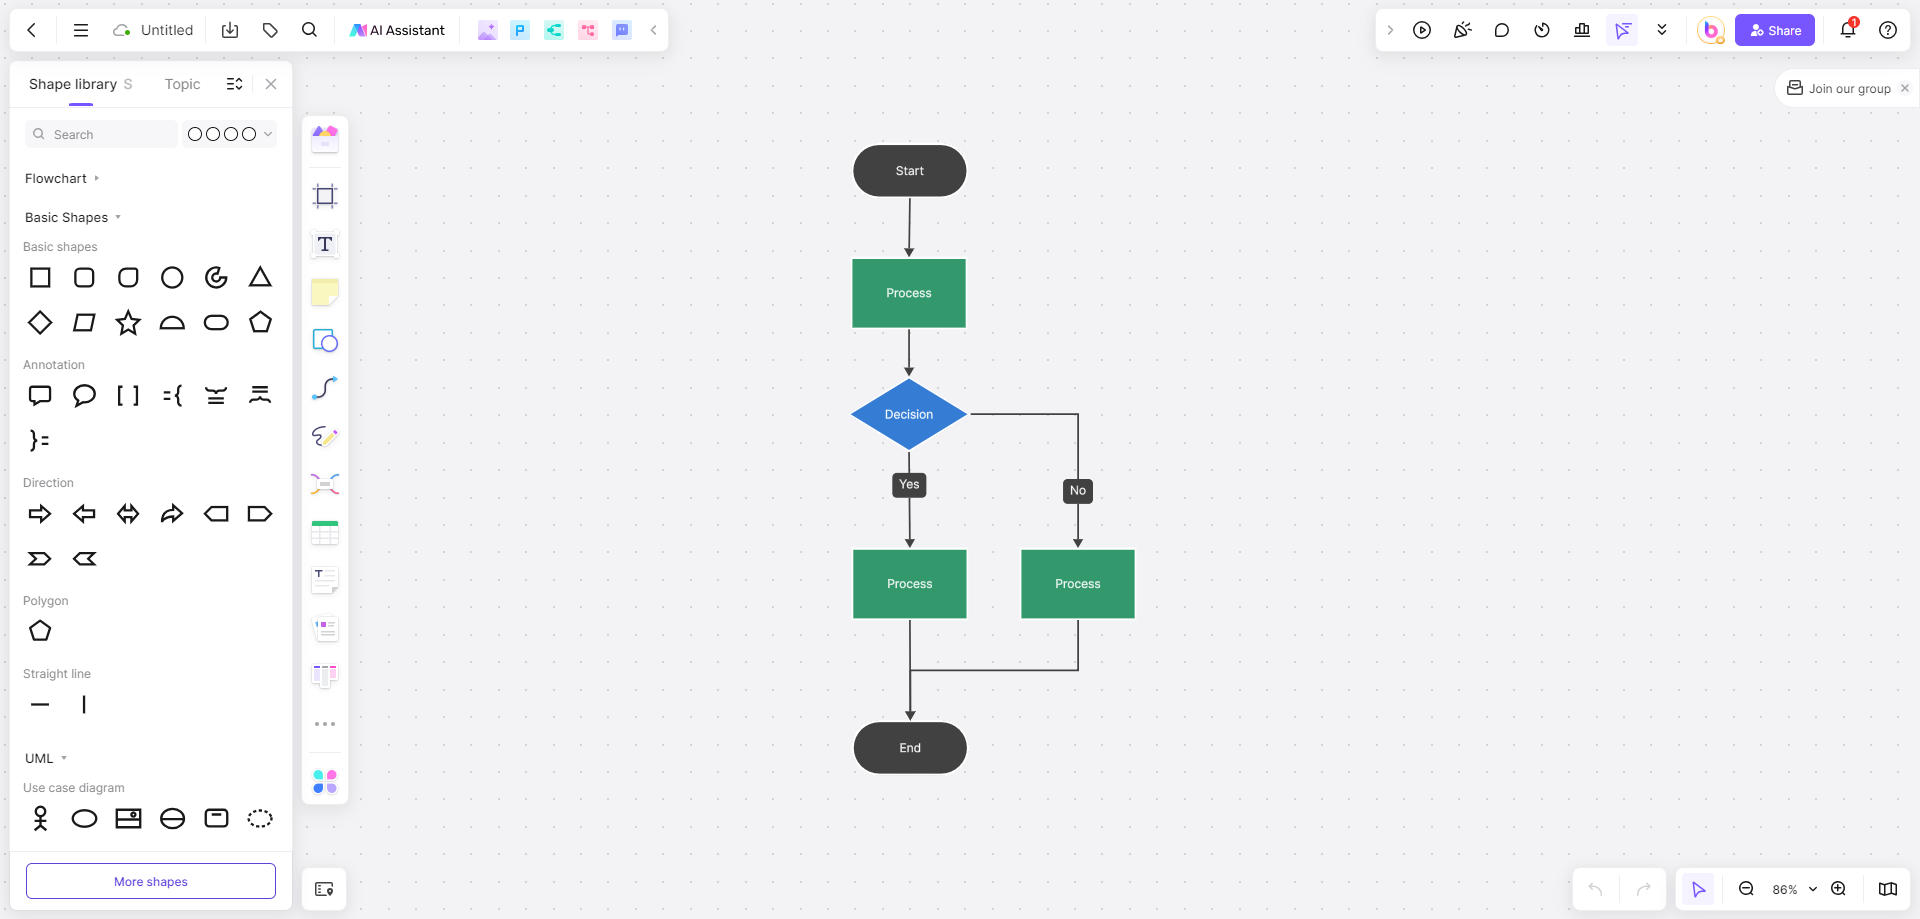
1. Basic Flowcharts
The basic flowchart is the foundation of all flowchart types. It consists of a series of boxes or shapes connected by arrows, each representing a step or action in a process. The standard shapes include:
- Rectangles or boxes for steps or actions
- Diamonds for decision points
- Ovals or circles for start and end points
These flowcharts are best suited for simple processes with a linear progression.
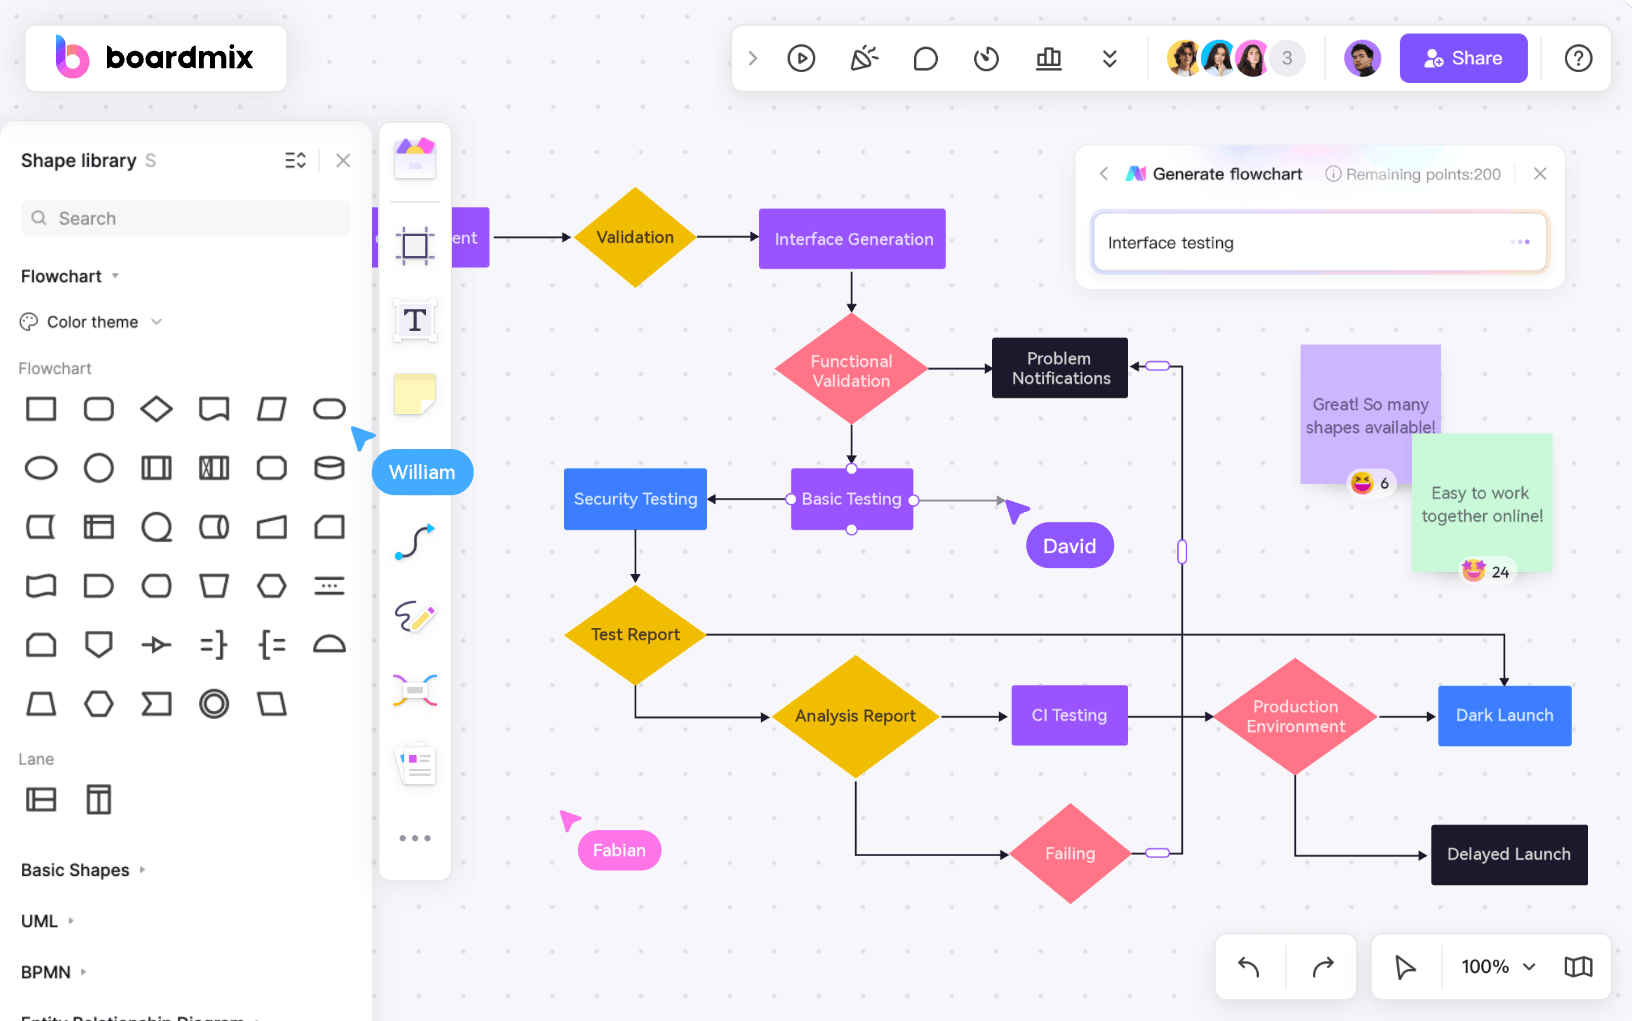
2. Cross-Functional Flowcharts
Cross-functional flowcharts are used to illustrate processes that involve multiple departments or teams. They often include swimlanes, which are horizontal or vertical lines that separate different responsibilities within the process. This type of flowchart is particularly useful for complex workflows where collaboration and handoffs are common.
![]()
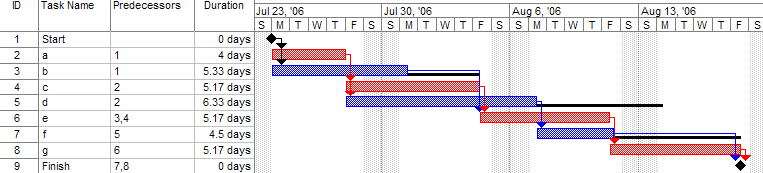
3. Gantt Charts
Gantt charts are a specialized type of flowchart used in project management. They display the start and end dates for tasks, along with their dependencies, on a timeline. This visual representation helps project managers track progress and adjust schedules as needed.
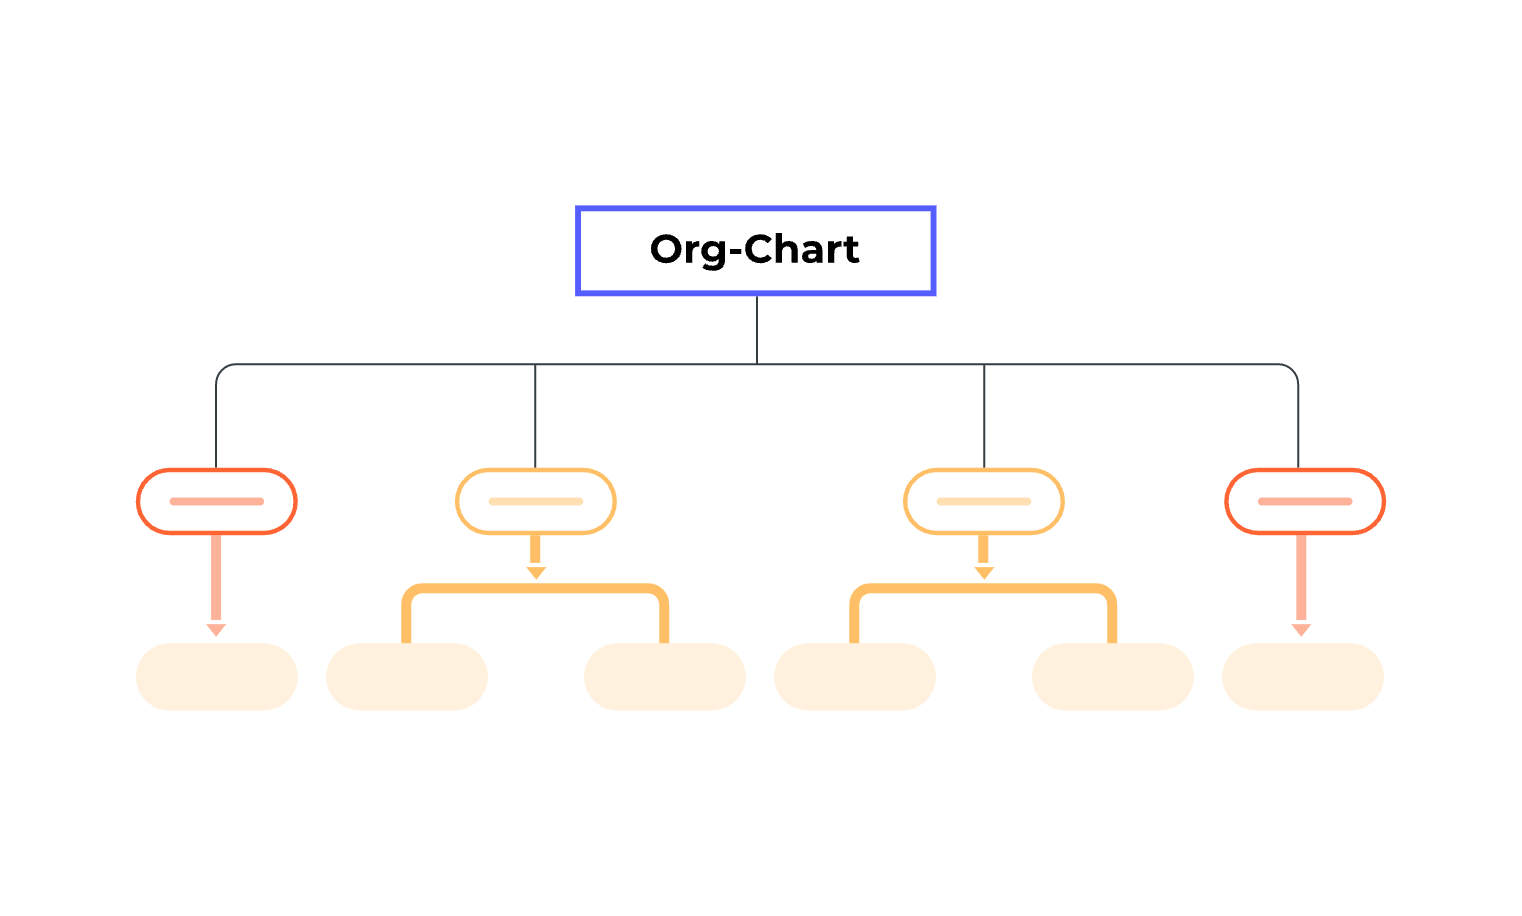
4. Org Charts
Organizational charts, or org charts, depict the structure of an organization, showing the relationships between different positions and departments. They typically use a hierarchical structure with boxes for individuals or departments and lines indicating reporting relationships.
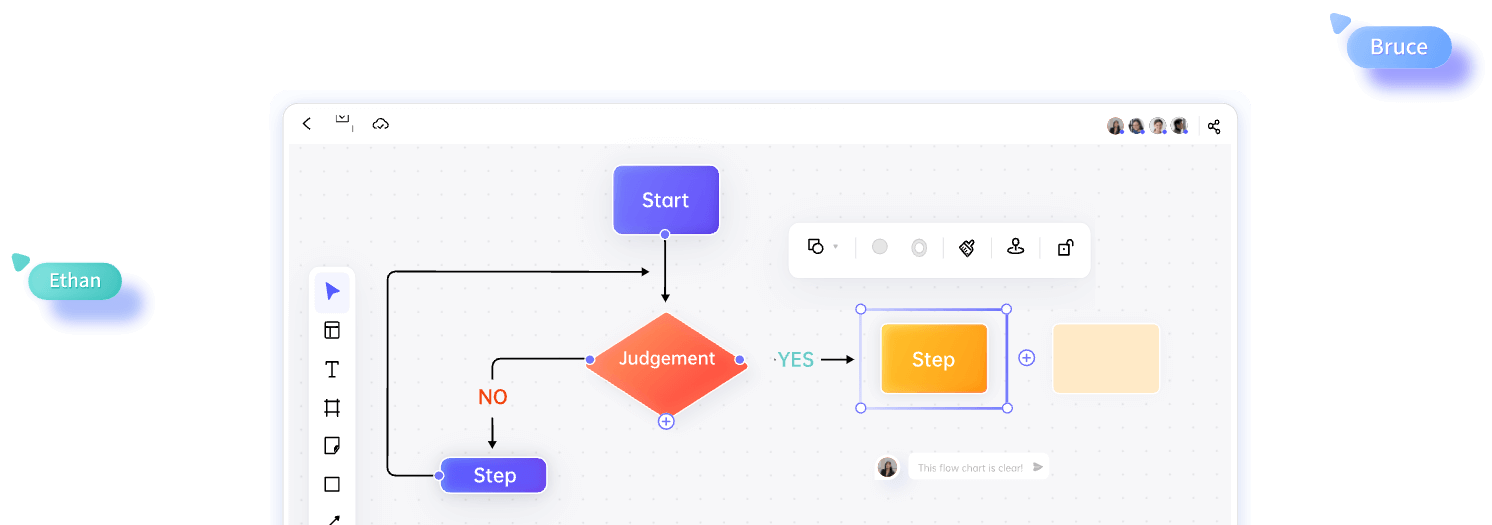
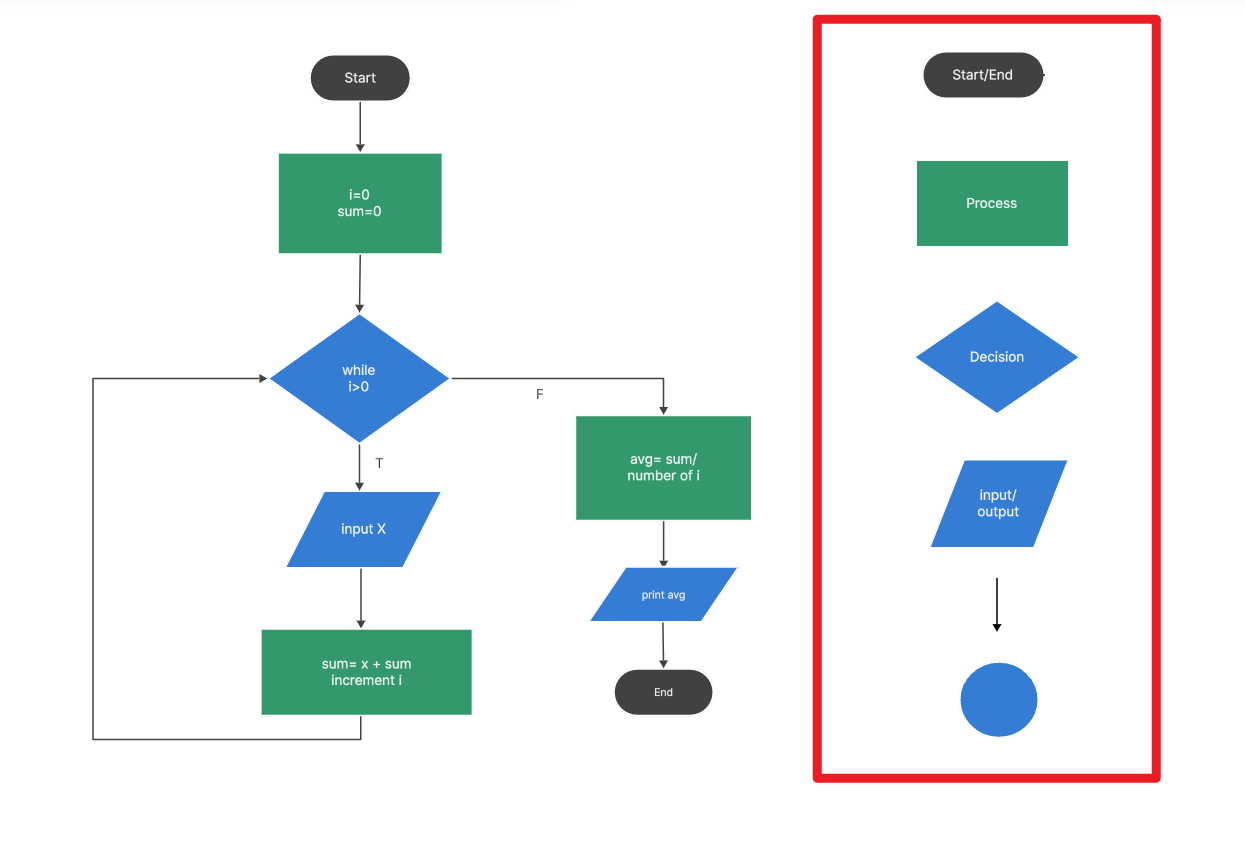
5. Process Flowcharts
Process flowcharts focus on the sequence of tasks within a process, highlighting the flow of work from one step to the next. They often include icons or symbols to represent different types of activities, such as data input, processing, and output.
![]()
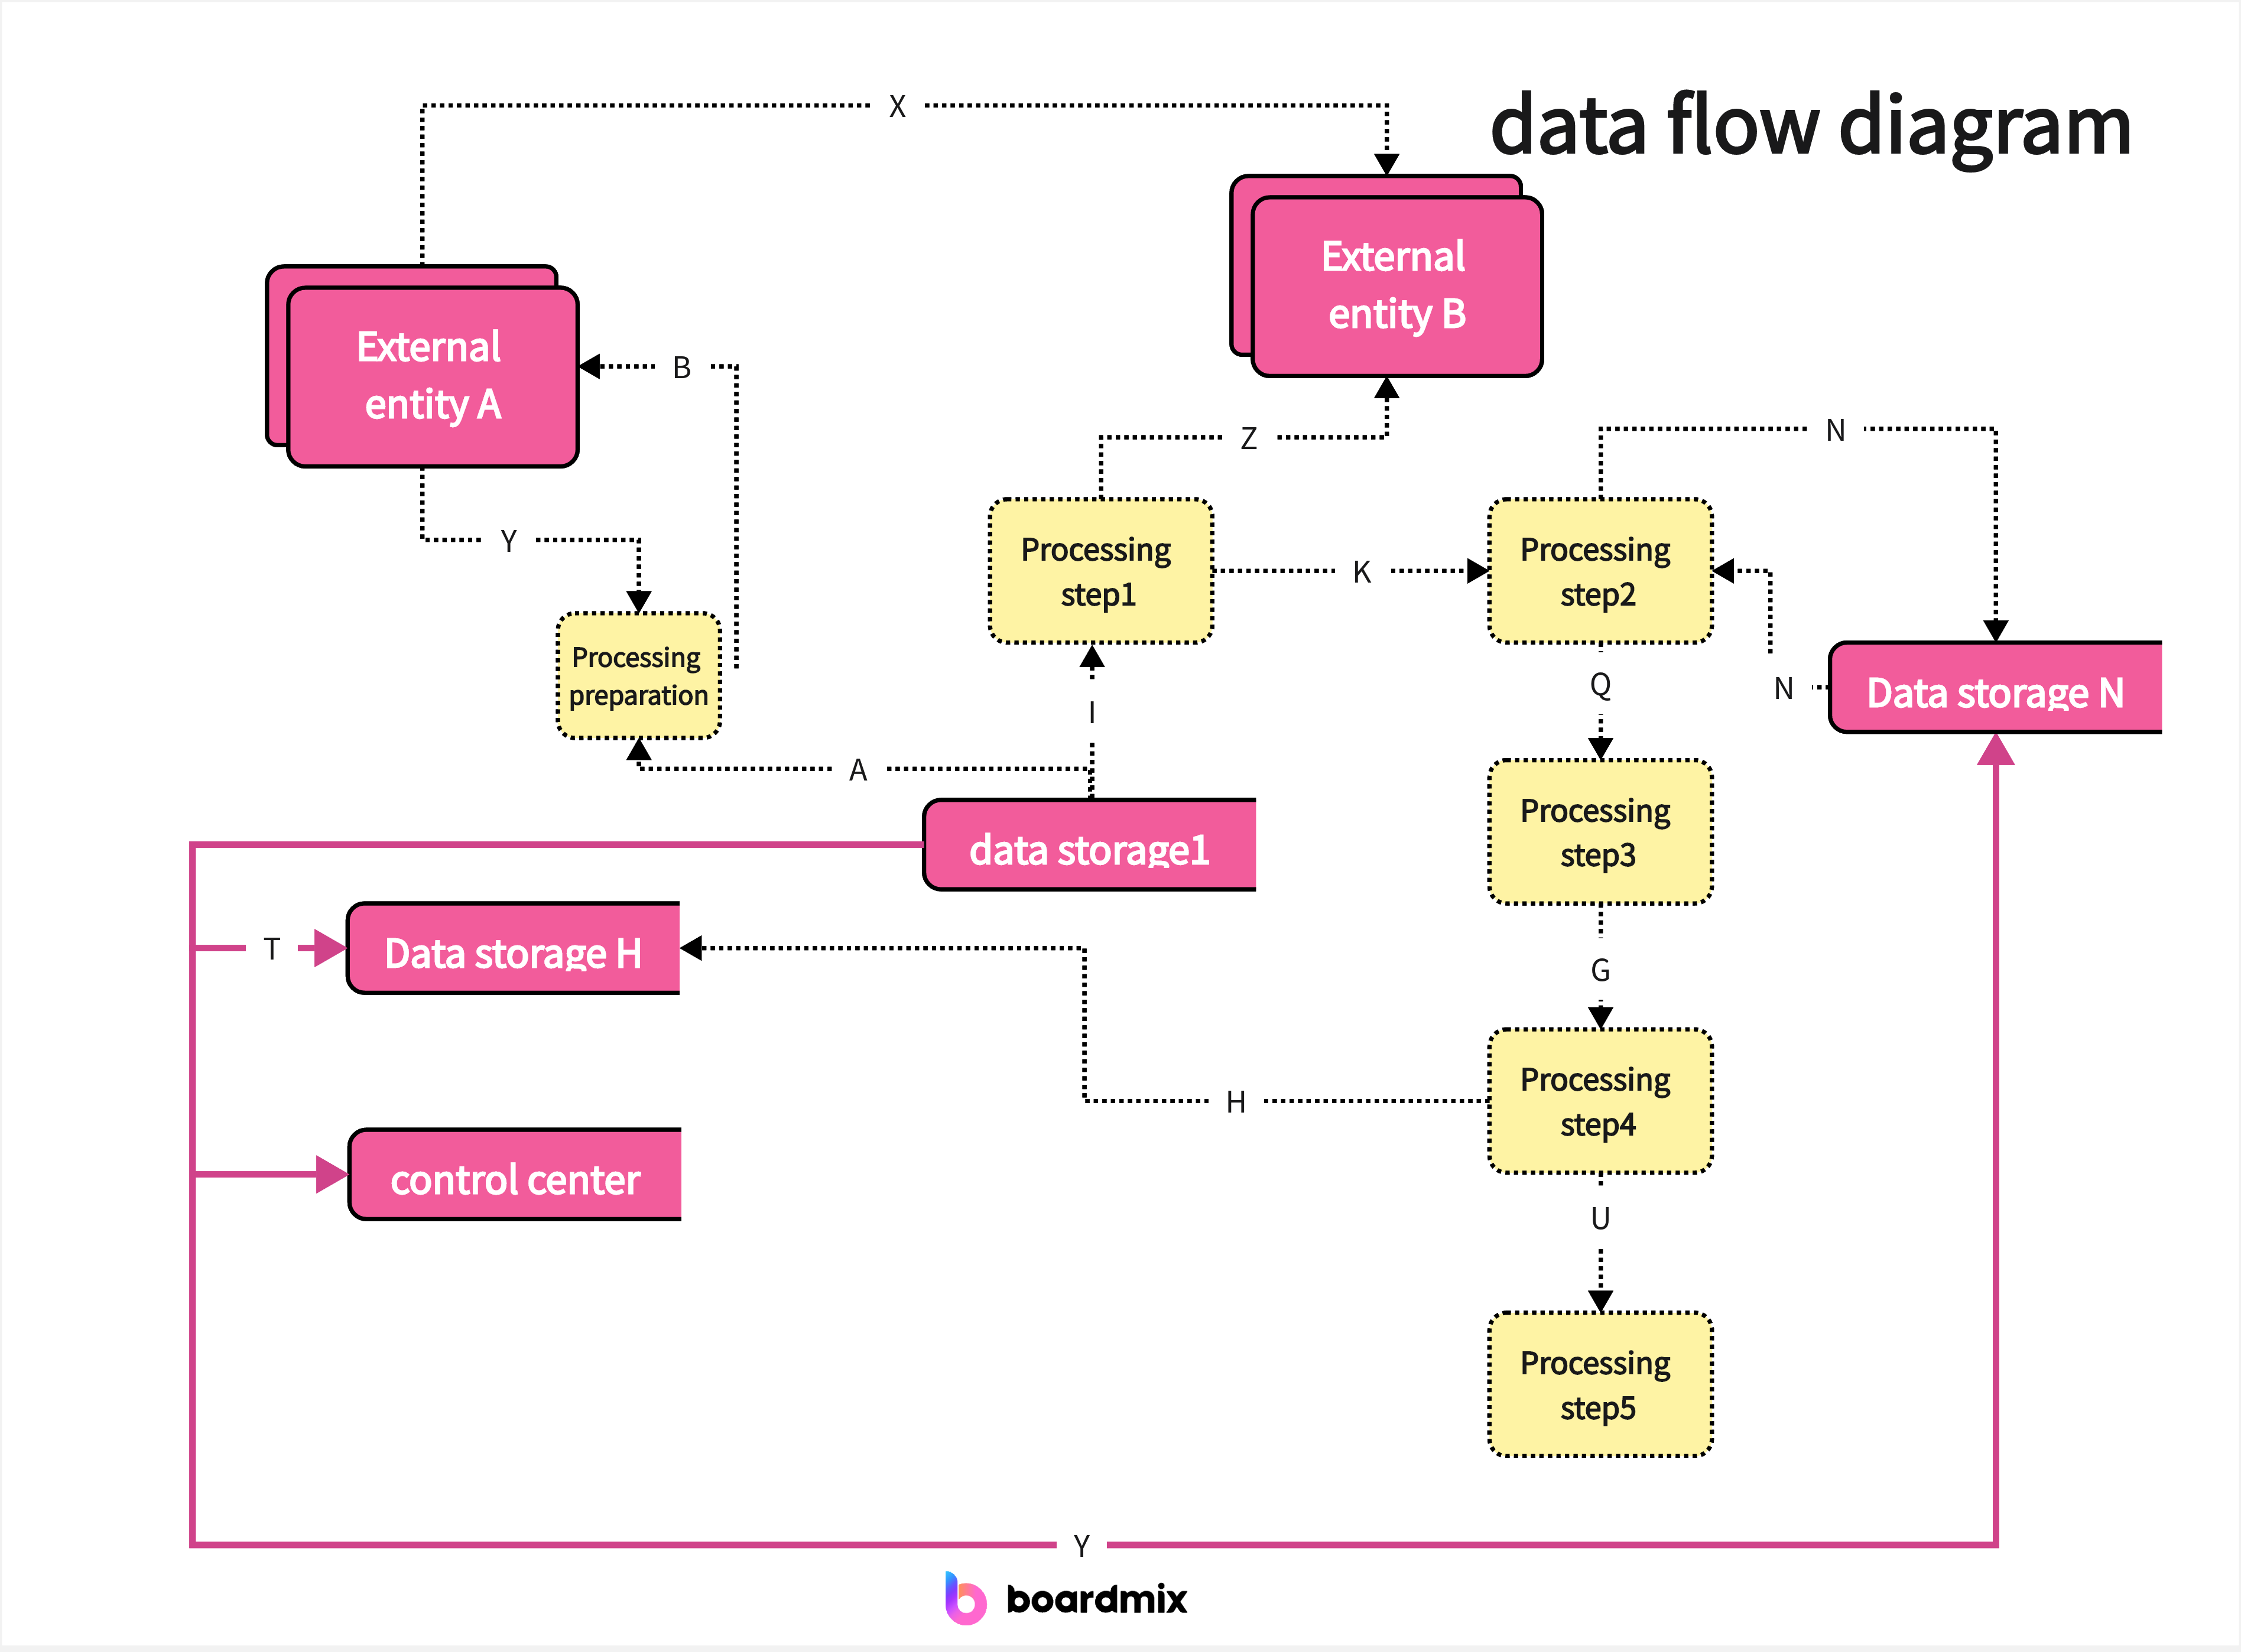
6. Data Flow Diagrams (DFDs)
Data flow diagrams are used to represent the movement of data within a system. They show the flow of data between processes and storage locations, helping to identify potential bottlenecks and data redundancy issues.
7. State Diagrams
State diagrams, also known as state flowcharts, illustrate the various states an object or system can be in and the transitions between these states. They are commonly used in software development to model the behavior of objects.
![]()
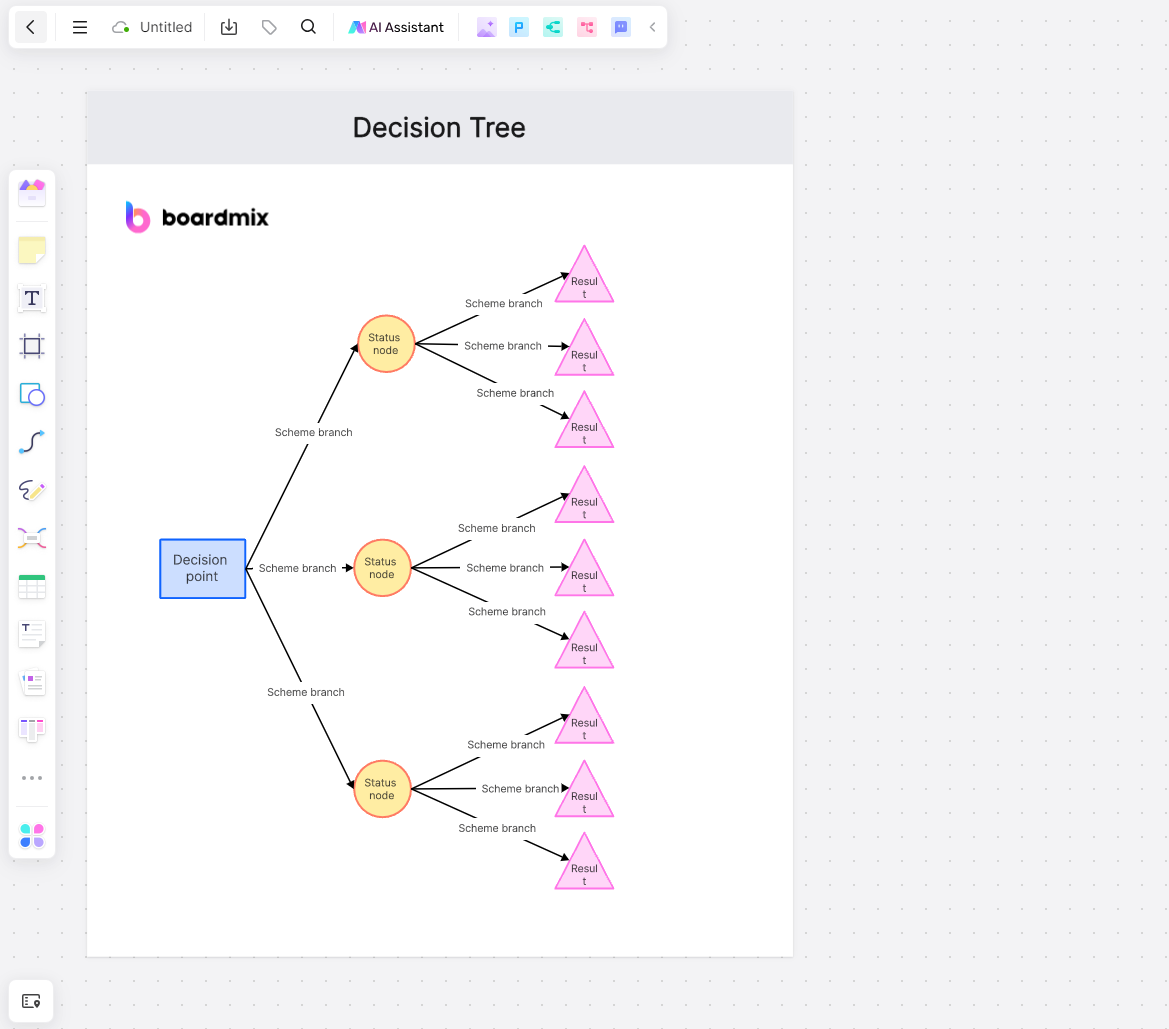
8. Decision Trees
Decision trees are a visual representation of decision-making processes. They start with a root node and branch out into possible outcomes, each leading to further decisions or conclusions. This type of flowchart is ideal for complex decision-making scenarios.
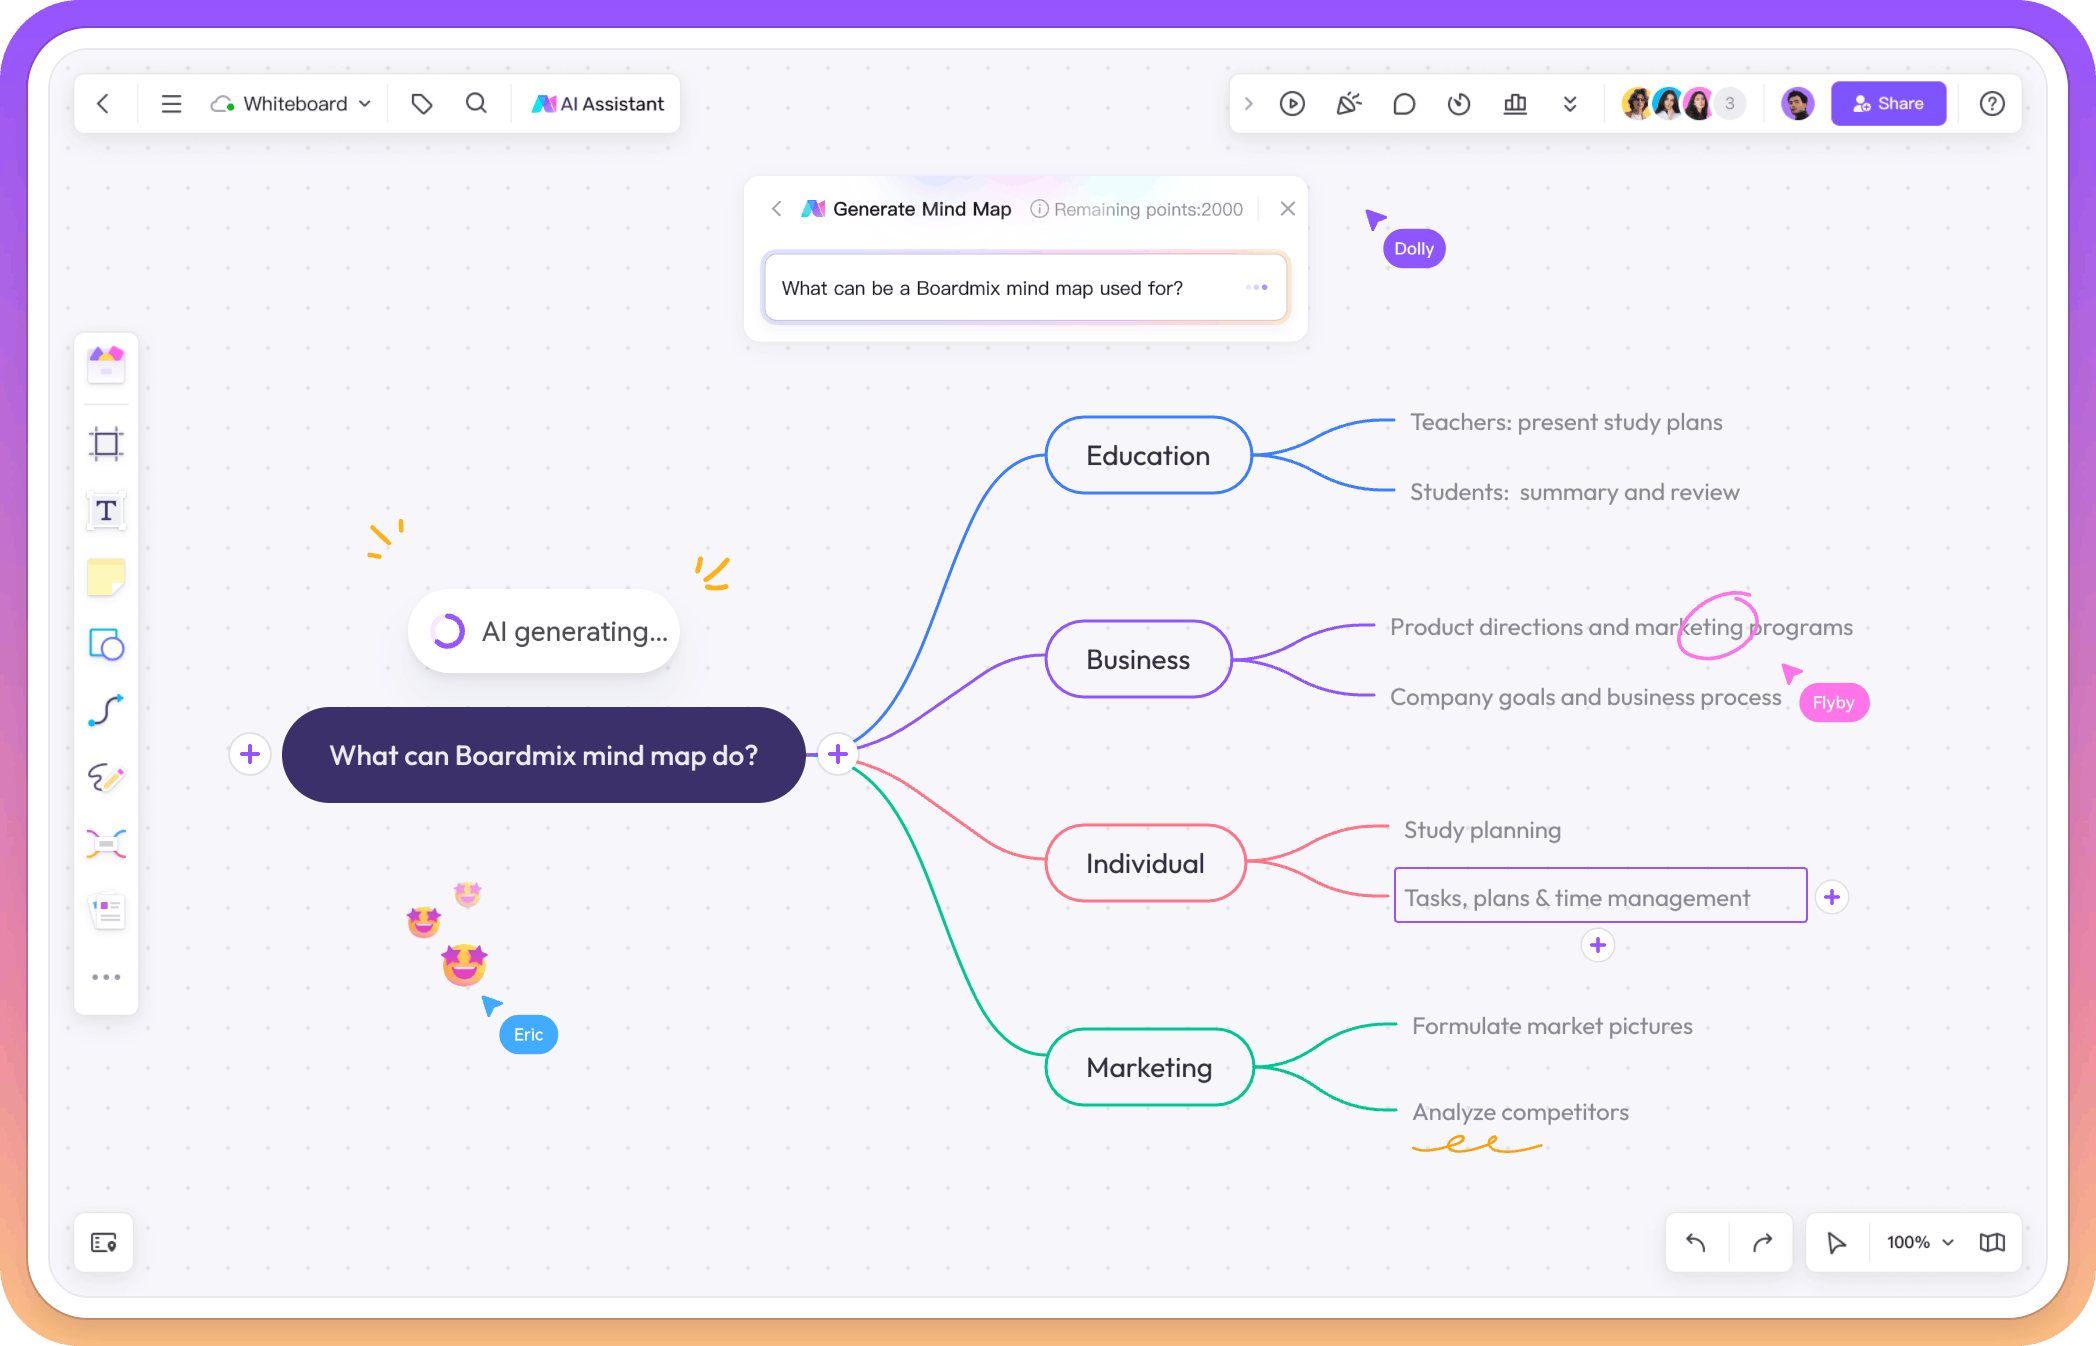
9. Mind Maps
While not strictly a flowchart, mind maps are a powerful visual tool for brainstorming and organizing information. They start with a central idea and branch out into related subtopics, creating a web of interconnected concepts.

Boardmix: Get Free Types of Flowcharts Online
When it comes to creating flowcharts, Boardmix Whiteboard is a great option for a free online flowchart maker. With Boardmix Whiteboard, you can easily create professional-looking flowcharts in a user-friendly interface.
Key features of Boardmix Whiteboard for flowchart creation
- Easy-to-use Interface: Boardmix Whiteboard offers a simple and intuitive interface that allows you to create flowcharts effortlessly. The drag-and-drop functionality makes it easy to add shapes, connectors, and text to your flowchart.
- Variety of Templates: Boardmix Whiteboard provides a wide range of templates specifically designed for different types of flowcharts. Whether you need a process flowchart, workflow diagram, data flow diagram, swimlane diagram, or decision tree, Boardmix Whiteboard has you covered.
- Customization Options: With Boardmix Whiteboard, you have the flexibility to customize your flowchart to suit your specific needs. You can choose from a variety of shapes, colors, and styles to create a visually appealing flowchart that effectively communicates your ideas.
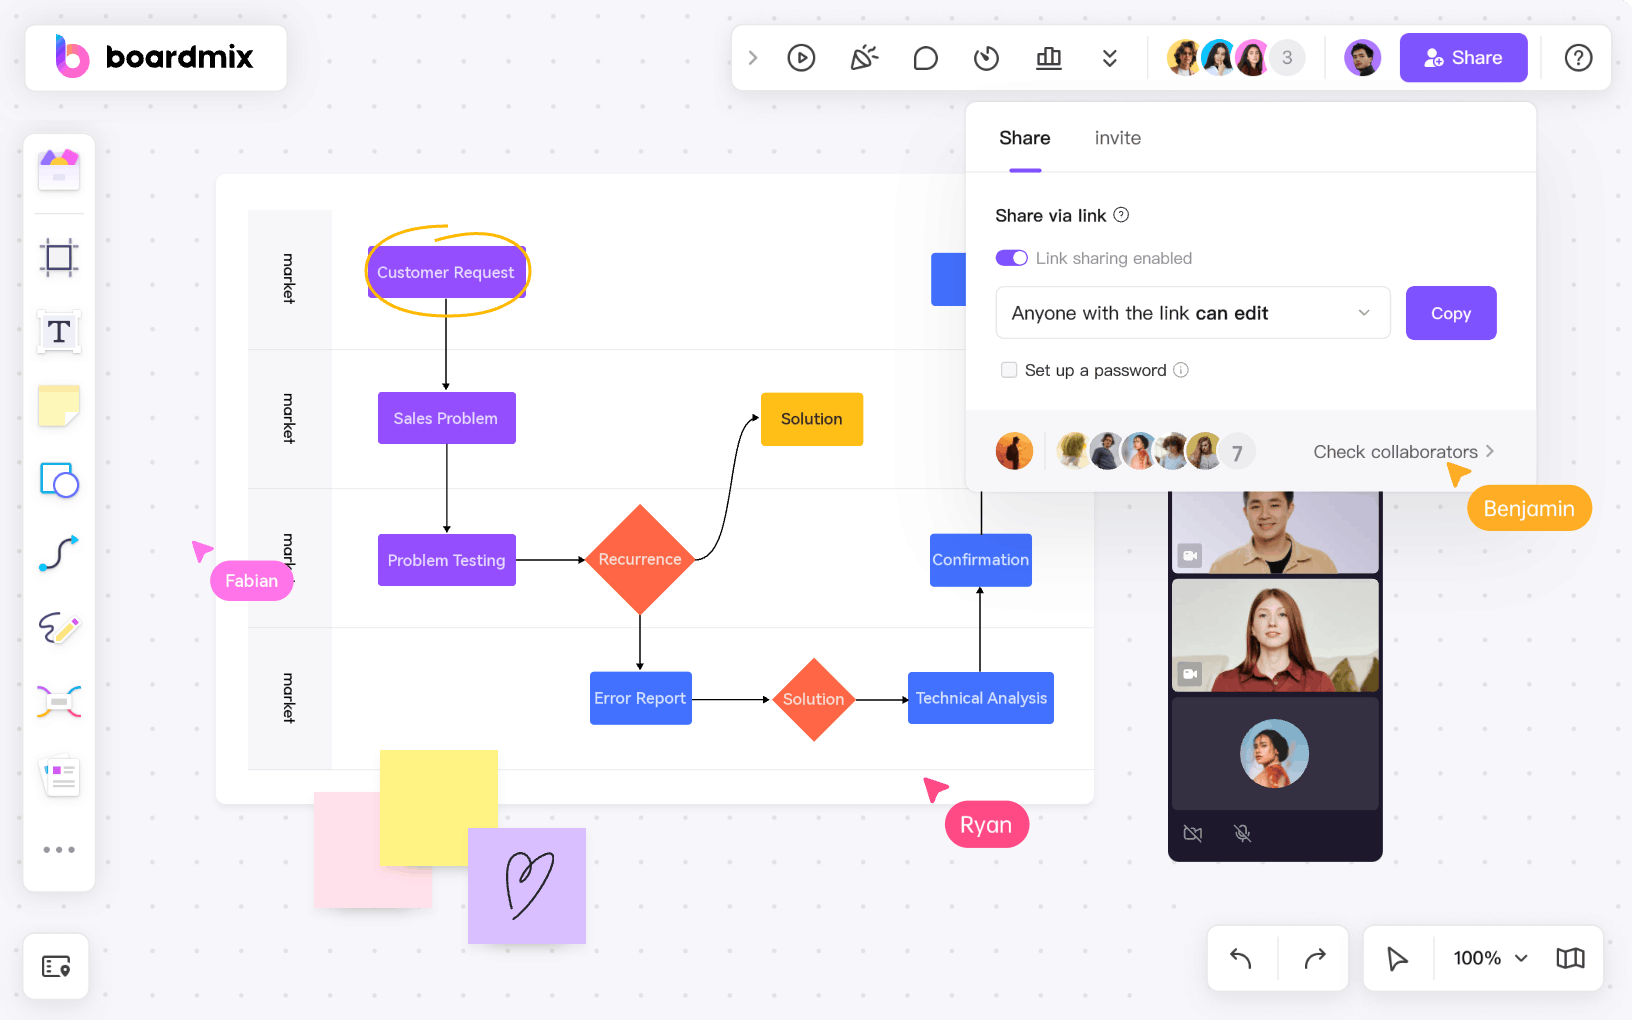
- Collaboration Features: Boardmix Whiteboard allows you to collaborate with team members in real time. You can invite others to view and edit your flowchart, making it easy to work together and make changes as needed.
- Cloud Storage: Boardmix Whiteboard offers cloud storage, so you can access your flowcharts from anywhere, at any time. This ensures that your work is always backed up and readily available whenever you need it.
Whether you're a beginner or an experienced flowchart creator, Boardmix Whiteboard is a reliable and user-friendly tool that can help you create professional-looking flowcharts for various purposes.
Step-by steps guide on Creating Flowcharts
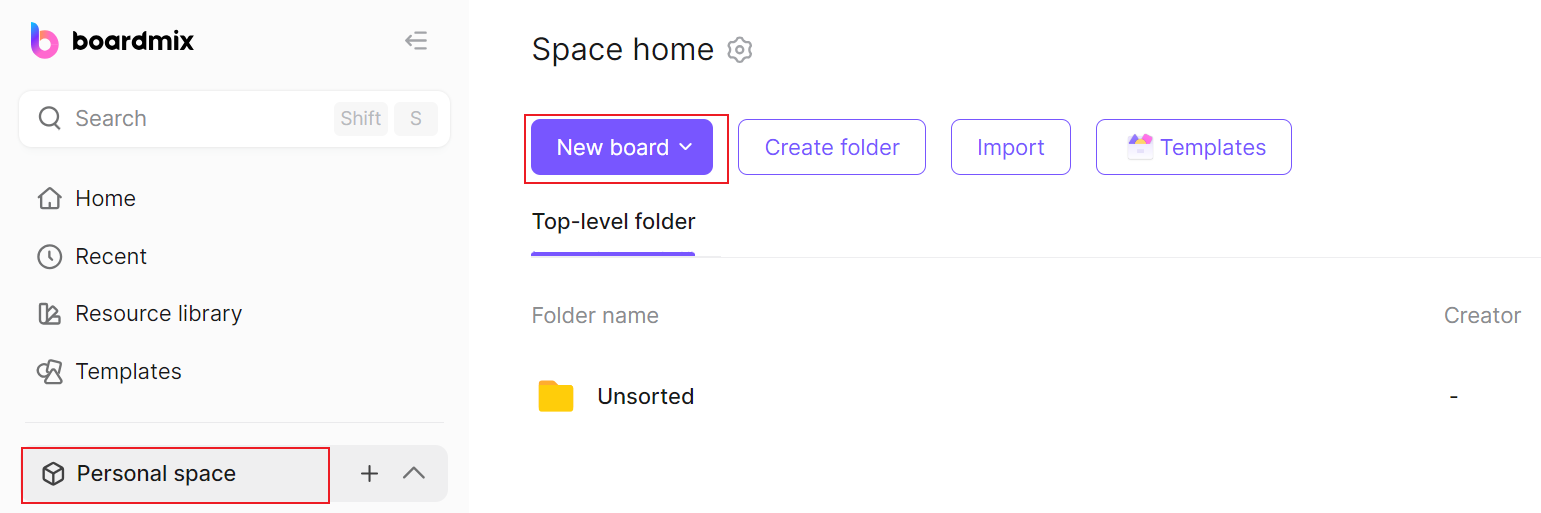
Making flowcharts in Boardmix Whiteboard is simple and easy. Here is a step-by-step guide:
- Start by creating a new whiteboard. You can either choose a blank canvas or select a template from the wide range of available options.
- Once you have your whiteboard set up, you can begin adding shapes and connectors to represent the different elements of your flowchart. Boardmix Whiteboard provides a variety of shapes and symbols that you can use, such as rectangles, diamonds, circles, arrows, and lines.
- To add a shape, simply click on the shape you want to use from the toolbar and then click on the canvas to place it. You can then resize and reposition the shape as needed.
- To connect shapes, click on the connector tool in the toolbar and then click and drag from one shape to another. This will create a connector line between the two shapes, representing the flow of information or process steps.
- Add text to your flowchart by selecting the text tool from the toolbar and clicking on the canvas where you want to add text. You can then type in your desired text and customize the font, size, and color.
- Customize the appearance of your flowchart by selecting shapes or connectors and using the formatting options in the toolbar. You can change colors, add gradients, adjust line thickness, and more.
- Collaborate with team members by inviting them to view or edit your flowchart. Boardmix Whiteboard allows real-time collaboration, making it easy to work together and make changes as needed.
- Once you're done creating your flowchart, you can save it in Boardmix Whiteboard or export it as an image or PDF file. This way, you can easily share your flowchart with others or use it in presentations and documents.
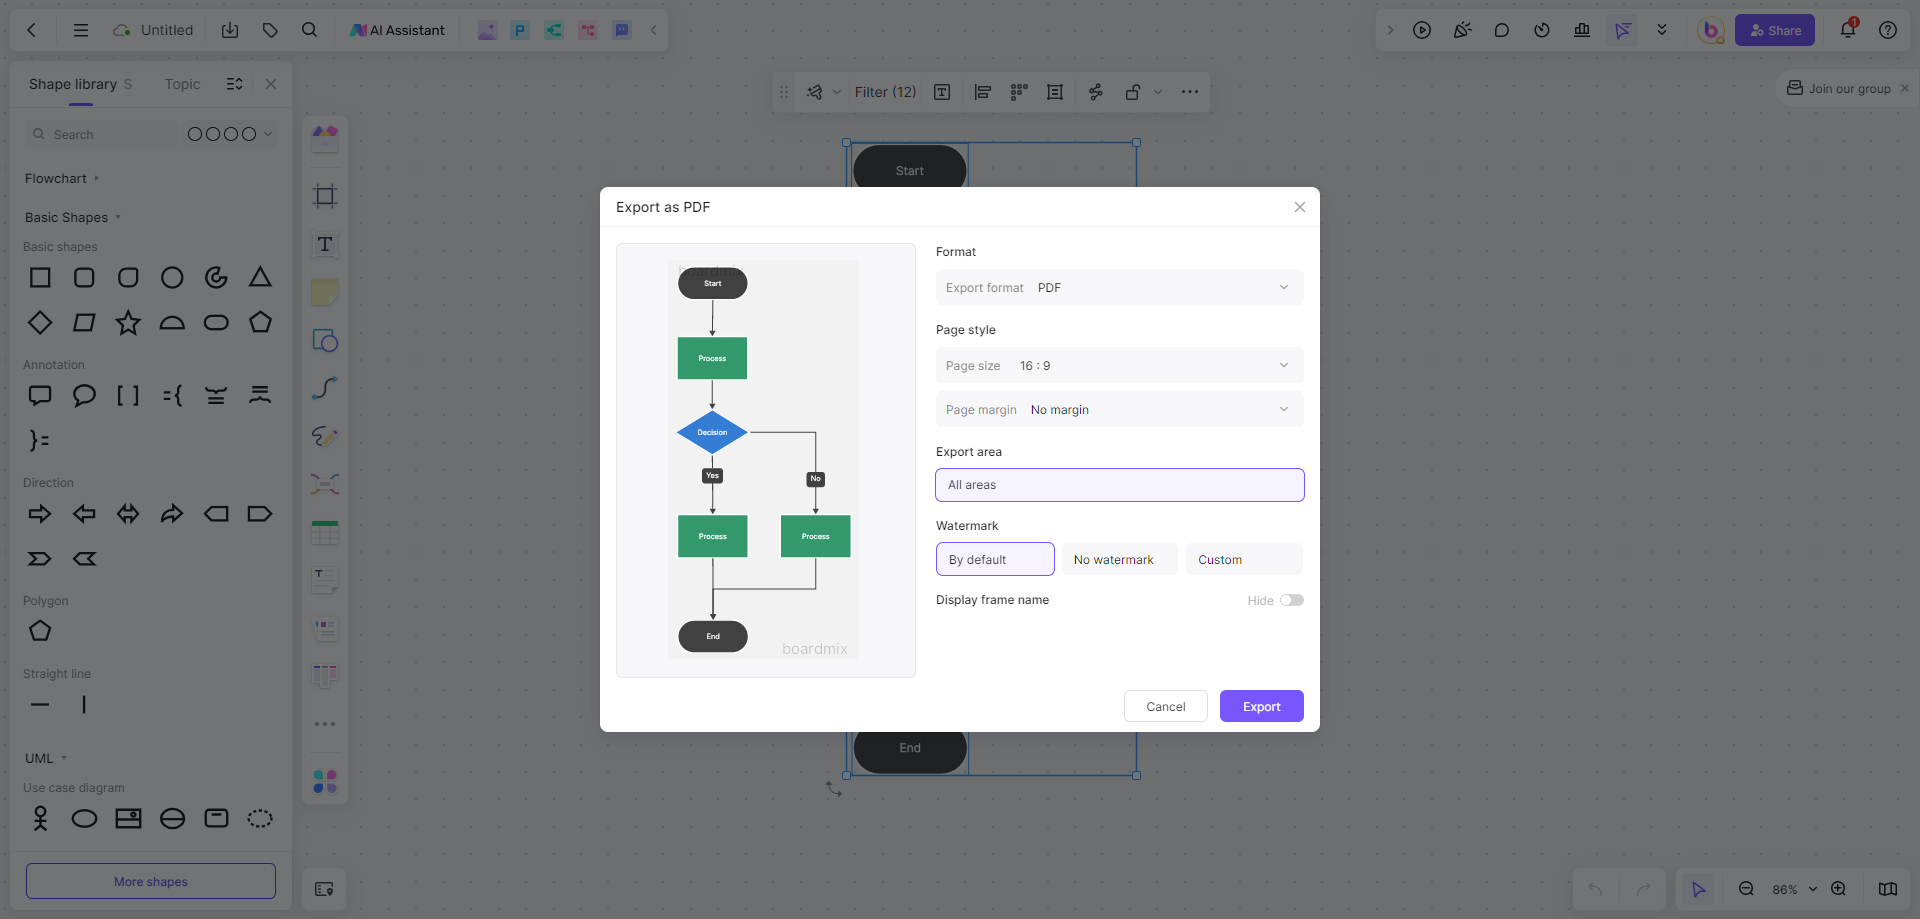
That's it! You now know how to make flowcharts in Boardmix Whiteboard. Have fun creating professional-looking flowcharts for your projects or presentations.
How to Apply flowcharts effectively?
Applying flowcharts effectively requires a strategic approach that aligns with your objectives and ensures clarity and understanding for your audience. Here's a step-by-step guide on how to use flowcharts effectively:
1. Define the Purpose
Before you start drawing, clearly define the purpose of your flowchart. Are you trying to outline a process, illustrate a decision-making process, or map out an organization's structure? Knowing the purpose will guide your choice of flowchart type and the elements you include.
2. Identify the Key Steps or Components
Break down the process or system you're trying to represent into its key steps, components, or stages. This will help you determine what needs to be included in your flowchart and in what order.
3. Choose the Right Flowchart Type
Select the flowchart type that best fits your purpose. For example, use a cross-functional flowchart for complex processes involving multiple departments, a Gantt chart for project timelines, or an org chart for organizational structures.
4. Simplify and Organize
Keep your flowchart as simple as possible. Avoid clutter by removing unnecessary details and organizing the steps logically. Group related steps or components together and use clear, concise labels for each element.
5. Use Standard Symbols and Conventions
Stick to standard symbols and conventions for shapes, arrows, and lines to ensure your flowchart is universally understood. For example, use diamonds for decision points, ovals for start and end points, and rectangles for steps or actions.
6. Maintain Consistency
Ensure that your flowchart is consistent in terms of style, color, and formatting. This helps maintain a professional appearance and makes it easier for your audience to follow the flow.
7. Test for Clarity
Before finalizing your flowchart, test it for clarity. Walk through the process with a colleague or friend who is unfamiliar with the subject matter. Their feedback can help you identify areas that may need improvement.
8. Incorporate Feedback
Incorporate any feedback you receive to refine your flowchart. Make adjustments to improve clarity, simplify complexity, and ensure that the flowchart accurately represents the process or system.
9. Use Appropriate Tools
Utilize flowchart software or tools that can help you create professional-looking flowcharts like online whiteboard Boardmix, which comes with templates and drag-and-drop functionality, making it easier to design and modify your flowchart.
10. Communicate Effectively
When presenting your flowchart, provide context and explain any non-standard elements or symbols you've used. This will ensure that your audience understands the flowchart and can apply the information effectively.
11. Revise as Needed
Flowcharts are not static documents. As processes evolve or new information becomes available, be prepared to revise your flowchart to maintain its accuracy and relevance.
By following these steps, you can create flowcharts that are not only visually appealing but also serve as powerful tools for communication, process improvement, and decision-making. Remember, the goal is to convey information in a way that is easy to understand and actionable.
Conclusion
Understanding the different types of flowcharts and their visual representation techniques is crucial for effective communication in both digital and traditional environments. Whether you're a project manager, a software developer, or a business analyst, the right flowchart can help you convey complex information in a clear, concise, and visually appealing manner. By choosing the appropriate flowchart type for your needs, you can ensure that your audience grasps your message quickly and accurately, leading to more efficient processes and better decision-making. As an online collaboration whiteboard for team collaboration, Boardmix provides diverse flowcharts and free templates to simplify your workflow. Start using Boardmix Whiteboard today and streamline your flowchart creation process today!


