


In the domain of systems analysis and software engineering, effective communication is vital for project success. One pivotal tool that aids in presenting complex information in an easy-to-understand manner is an Information Flow Diagram. This diagrammatic tool helps convey how data flows through a system, which aids in system design, troubleshooting, and optimization.
This article will show you every aspect about the Information Flow Diagram and introduce a versatile tool to make it smoothly. Keep reading.
What Is an Information Flow Diagram
An Information Flow Diagram (IFD) is a type of graphical representation that depicts how information moves throughout a system. It illustrates what kind of information is input and output, where it comes from, and where it goes.
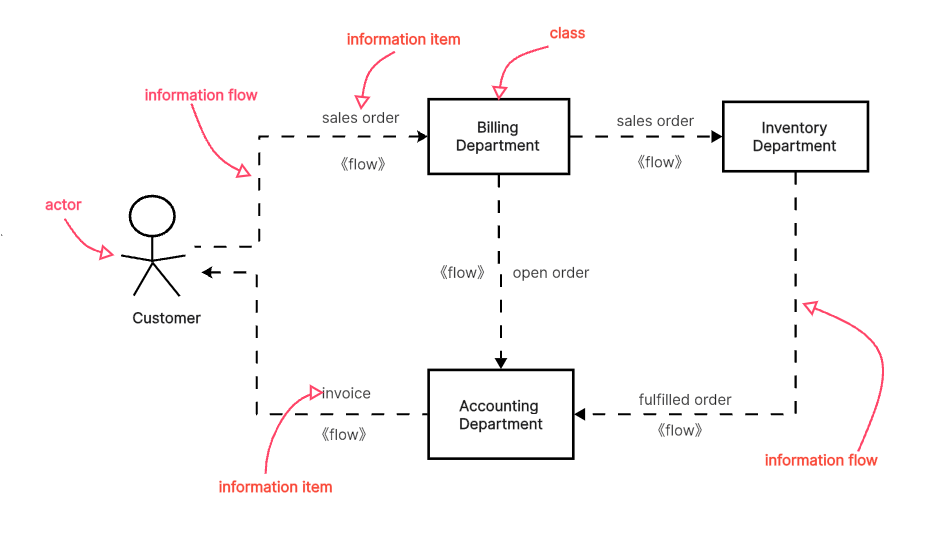
The diagram displays entities such as data sources, destinations, storage spaces, and processes. Arrows connecting these entities represent the movement of data, while the entities themselves demonstrate where the data originates, undergoes transformation, or where it ends up.
An IFD acts as a roadmap of information within a system. It provides clear visibility into complex systems by breaking them down into smaller, understandable components and showcasing their interconnections.
When to Use an Information Flow Diagram
Employing an Information Flow Diagram can be beneficial in several situations:
- System Analysis: An IFD can help analysts understand the current information flow within a system to identify potential areas of improvement or locate problems.
- Design Phase: During the design phase of a new system, IFDs can help visualize how data should flow and interact.
- Documentation: IFDs can serve as documentation, aiding in understanding the system for future maintenance or upgrades.
- Communication Tool: For teams or stakeholders, IFDs can act as a communication tool to help them understand complex systems.
By applying an Information Flow Diagram in these scenarios, systems analysts, engineers, and project managers can achieve a clearer understanding of the systems they work with, ultimately leading to more effective decision-making.
Benefits of Information Flow Diagrams
The usage of Information Flow Diagrams (IFDs) brings several benefits that significantly contribute to the effective management and understanding of complex systems:
- Simplified Visualization: IFDs break down complex systems into manageable visualizations, enabling an easier understanding of data flow.
- Problem Identification: IFDs can help identify problematic areas in a system by visualizing how data flows and interacts.
- Facilitates Decision Making: By understanding how data moves within a system, decision-makers can more effectively manage and optimize system operations.
- Promotes Communication: IFDs serve as a universal language, promoting understanding and communication among diverse stakeholders.
- Improved System Design: Using IFDs in the design phase can lead to more robust and efficient systems as they provide a clear roadmap of how information should flow.
Information Flow Diagram Symbols
Understanding the symbols used in Information Flow Diagrams is key to interpreting and creating these useful diagrams. Some commonly used symbols include:
- Arrows: These represent the movement or flow of data from one entity to another within the system.
- Rectangles: These represent entities that either produce or consume data.
- Circles or Ovals: These represent processes that transform input data into output data.
- Open-Ended Rectangles: These denote data stores or repositories where information is kept for future use.
- Parallel Lines: Represent 'Data Pipes' where data flows from one point to another.
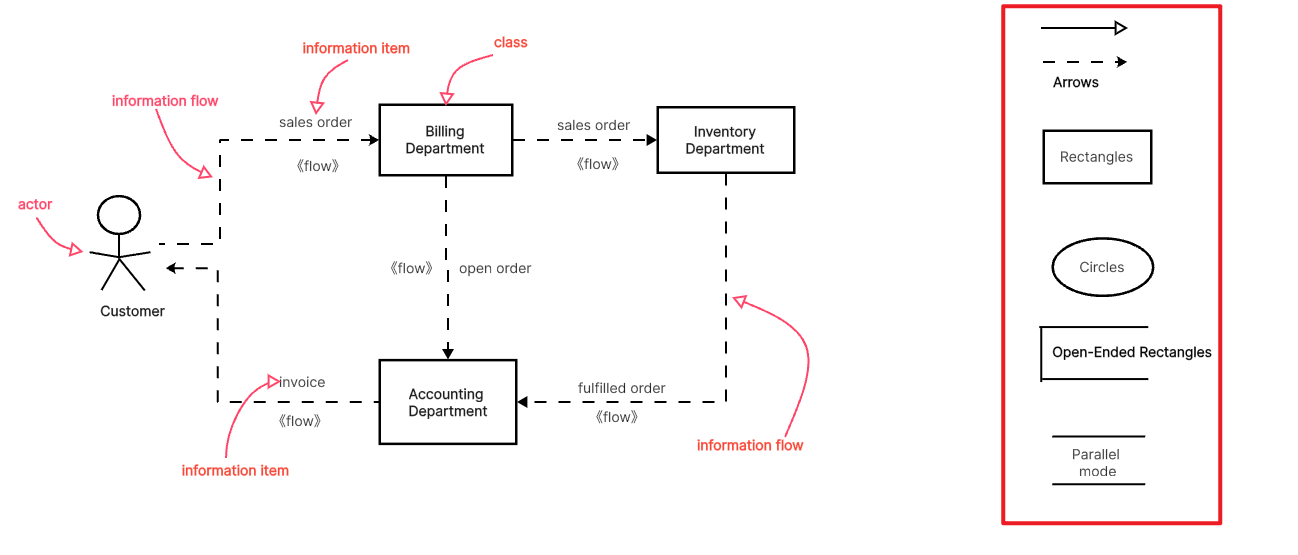
These symbols work together to create a structured representation of the information flow within a system, enabling its easy comprehension and efficient management.
A Versatile Information Flow Diagram Maker - Boardmix
When it comes to crafting meticulous and effective Information Flow Diagrams (IFDs), a standout tool is Boardmix. Boardmix is an innovative diagramming software that enables users to design, customize, and share IFDs with ease and precision.

Boardmix’s intuitive interface simplifies the diagramming process, allowing users to construct IFDs from scratch or choose from various professionally designed templates. With its robust set of features such as drag-and-drop functionality, precision control for elements, color coding, and collaboration tools, Boardmix turns the creation of Information Flow Diagrams into an effortless task.
Boardmix also enables real-time collaboration, making it an ideal tool for teams working remotely or in different locations. Team members can edit diagrams concurrently, leave comments, track revisions, promoting efficient teamwork and communication.
Tips and Tricks on Making a Information Flow Diagram
Designing an Information Flow Diagram can significantly enhance system analysis and design. Here are some useful tips and tricks for crafting a comprehensive IFD:
- Keep It Simple: Avoid over-complication. Start with high-level entities and processes and gradually drill down into details.
- Use Standard Symbols: Use universally accepted symbols for elements like data flows, processes, entities, and data stores.
- Label Clearly: Each symbol should be clearly labeled to avoid confusion and misinterpretation.
- Maintain Consistency: Ensure that similar processes or data flows are represented consistently throughout the diagram.
- Validate the Diagram: Once completed, validate the diagram with all stakeholders to ensure accuracy and completeness.
- Use Colors Strategically: Use colors to differentiate between different types of data or processes.
- Use Software Tools: Utilize software tools like Boardmix for creating professional-looking, easily shareable Information Flow Diagrams.


