


A matrix diagram is a powerful data analysis tool often utilized for decision-making and problem-solving. Understanding its nature, the reasons for using it, and when it's appropriate to employ can enable more effective usage. This article comprehensively details the aspects of a matrix diagram. Let’s dive in!
What Is a Matrix Diagram
A matrix diagram, also known as a matrix chart, is a visual representation tool used to show the relationship between two, three, or four groups of information. It has rows and columns that illustrate the correlation between items. Each cell in the matrix can represent the relationship between two items through color coding, symbols, or numbers.
This diagram is a useful tool for identifying, displaying, and exploring relationships, making it a valuable component of project management, strategic planning, process optimization, and team brainstorming sessions.
Why Use a Matrix Diagram
The application of a matrix diagram carries several benefits:
- Efficient Decision Making: By clearly illustrating relationships or correlations between different elements, a matrix diagram facilitates more informed decision-making.
- Problem-Solving: With the ability to outline and clarify complex relationships, it's an effective tool for identifying root causes and finding potential solutions.
- Communication: As a visual tool, it's excellent for communicating complex relationships in a simple, understandable manner.
- Resource Allocation: Matrix diagrams can help organizations understand connections and dependencies, enabling them to allocate resources more effectively.
- Risk Management: By plotting risks against severity or probability, it assists in risk identification and management.
When to Use a Matrix Diagram
A matrix diagram can be employed in various situations. Here are a few examples:
- Project Management: To visualize project tasks against resources or time frames for better allocation and scheduling.
- Risk Analysis: To plot risks against their impact and likelihood to assist in risk management planning.
- Product Comparison: To compare different products or services against various parameters for informed decision-making.
- Process Optimization: To identify and address gaps in processes by displaying correlations between process steps and performance indicators.
- Conflict Resolution: To understand the relationships between different team members or departments to facilitate resolution of conflicts.
Matrix diagrams are versatile tools that effectively depict and analyze relationships between multiple groups of data. Utilizing them appropriately can lead to improved decision-making, efficient resource allocation, and optimized processes.
Types of Matrix Diagrams
Matrix diagrams are a multifaceted tool employed across various fields, with each type serving a unique purpose. By understanding the distinctive features and applications of different matrix diagrams, you can select the best type to analyze and illustrate complex relationships.
L-Shaped Matrix Diagram
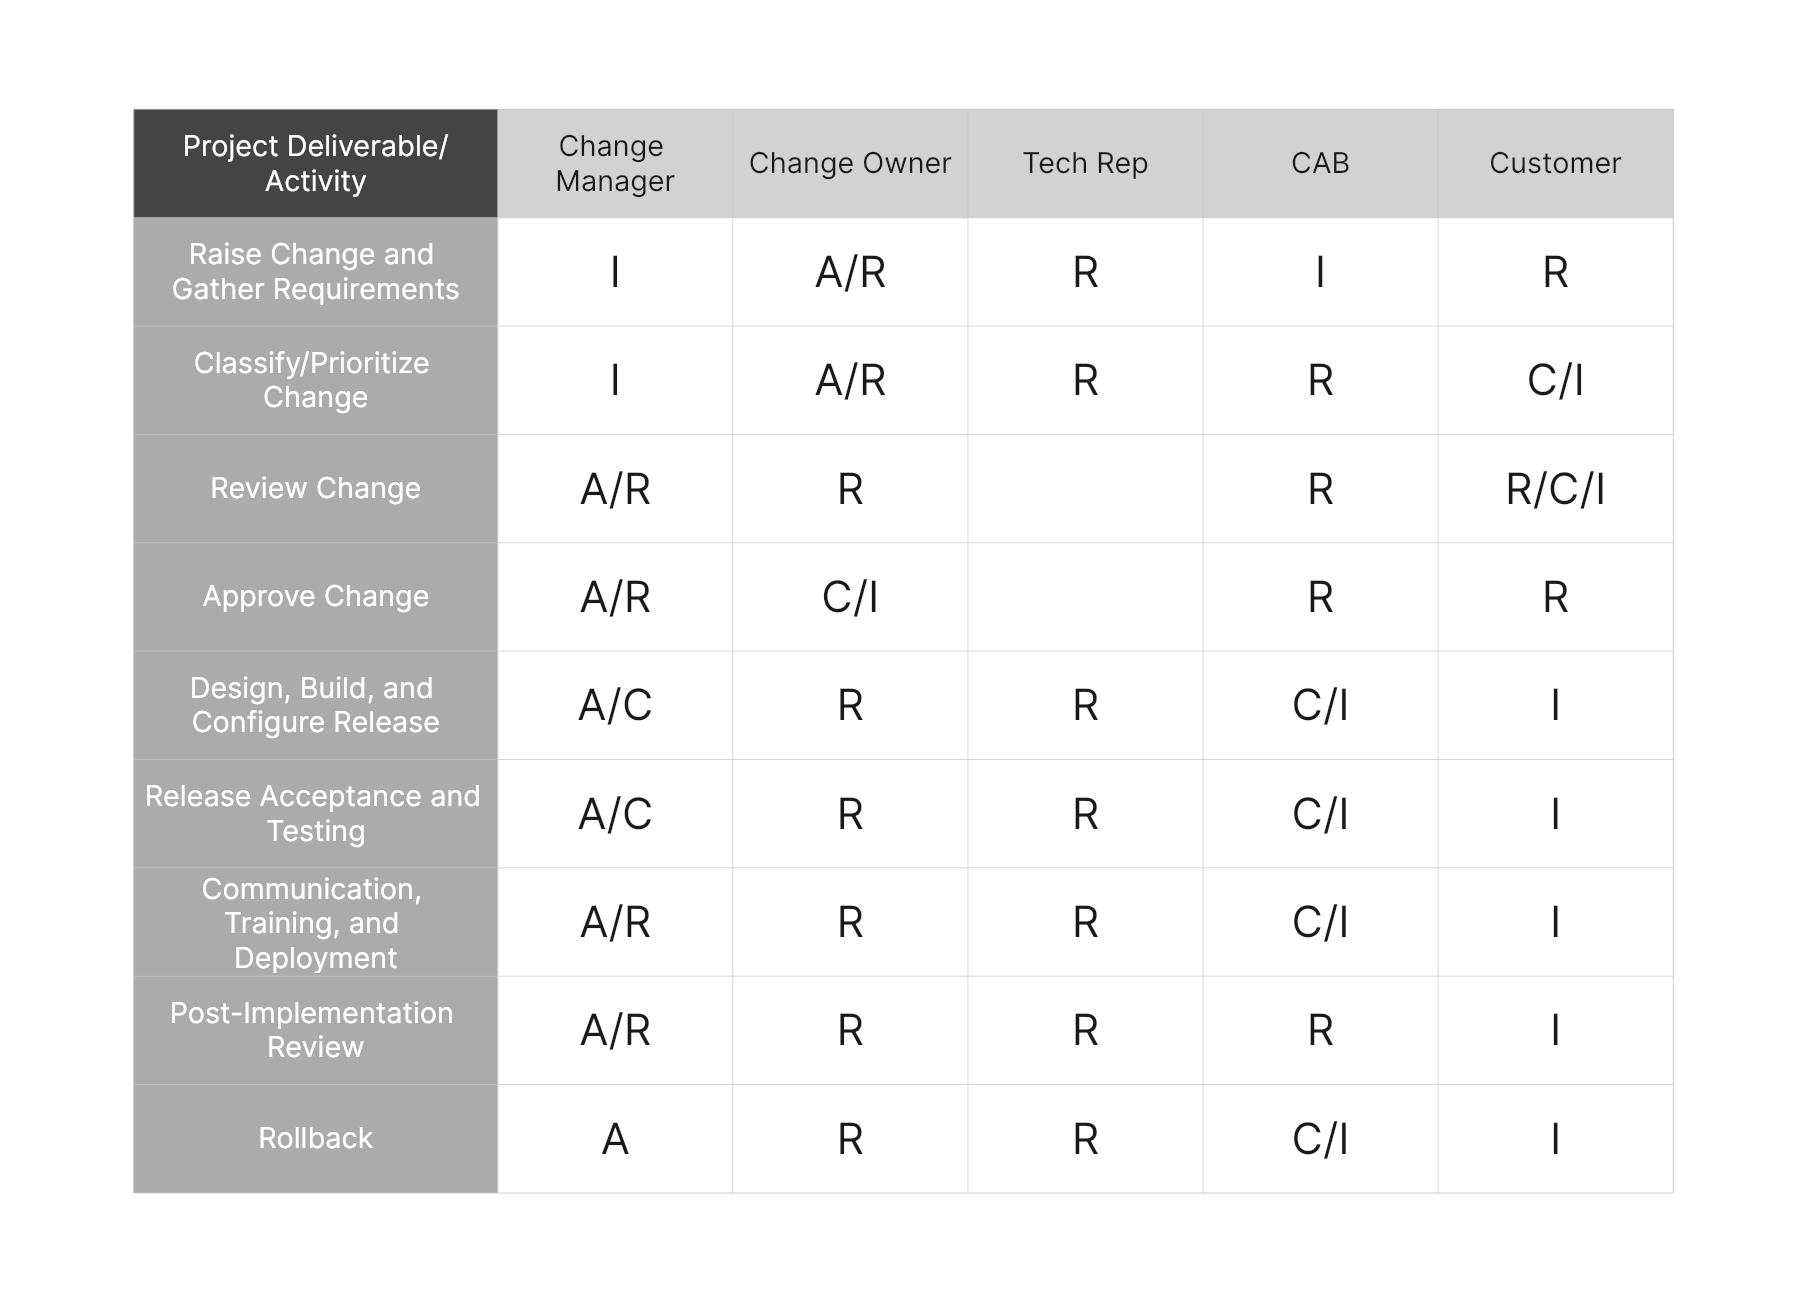
An L-Shaped Matrix Diagram examines the relationship between two groups of items. Arranged as a two-dimensional grid, it provides a clear overview of correlations or potential cause-and-effect relationships between different factors.
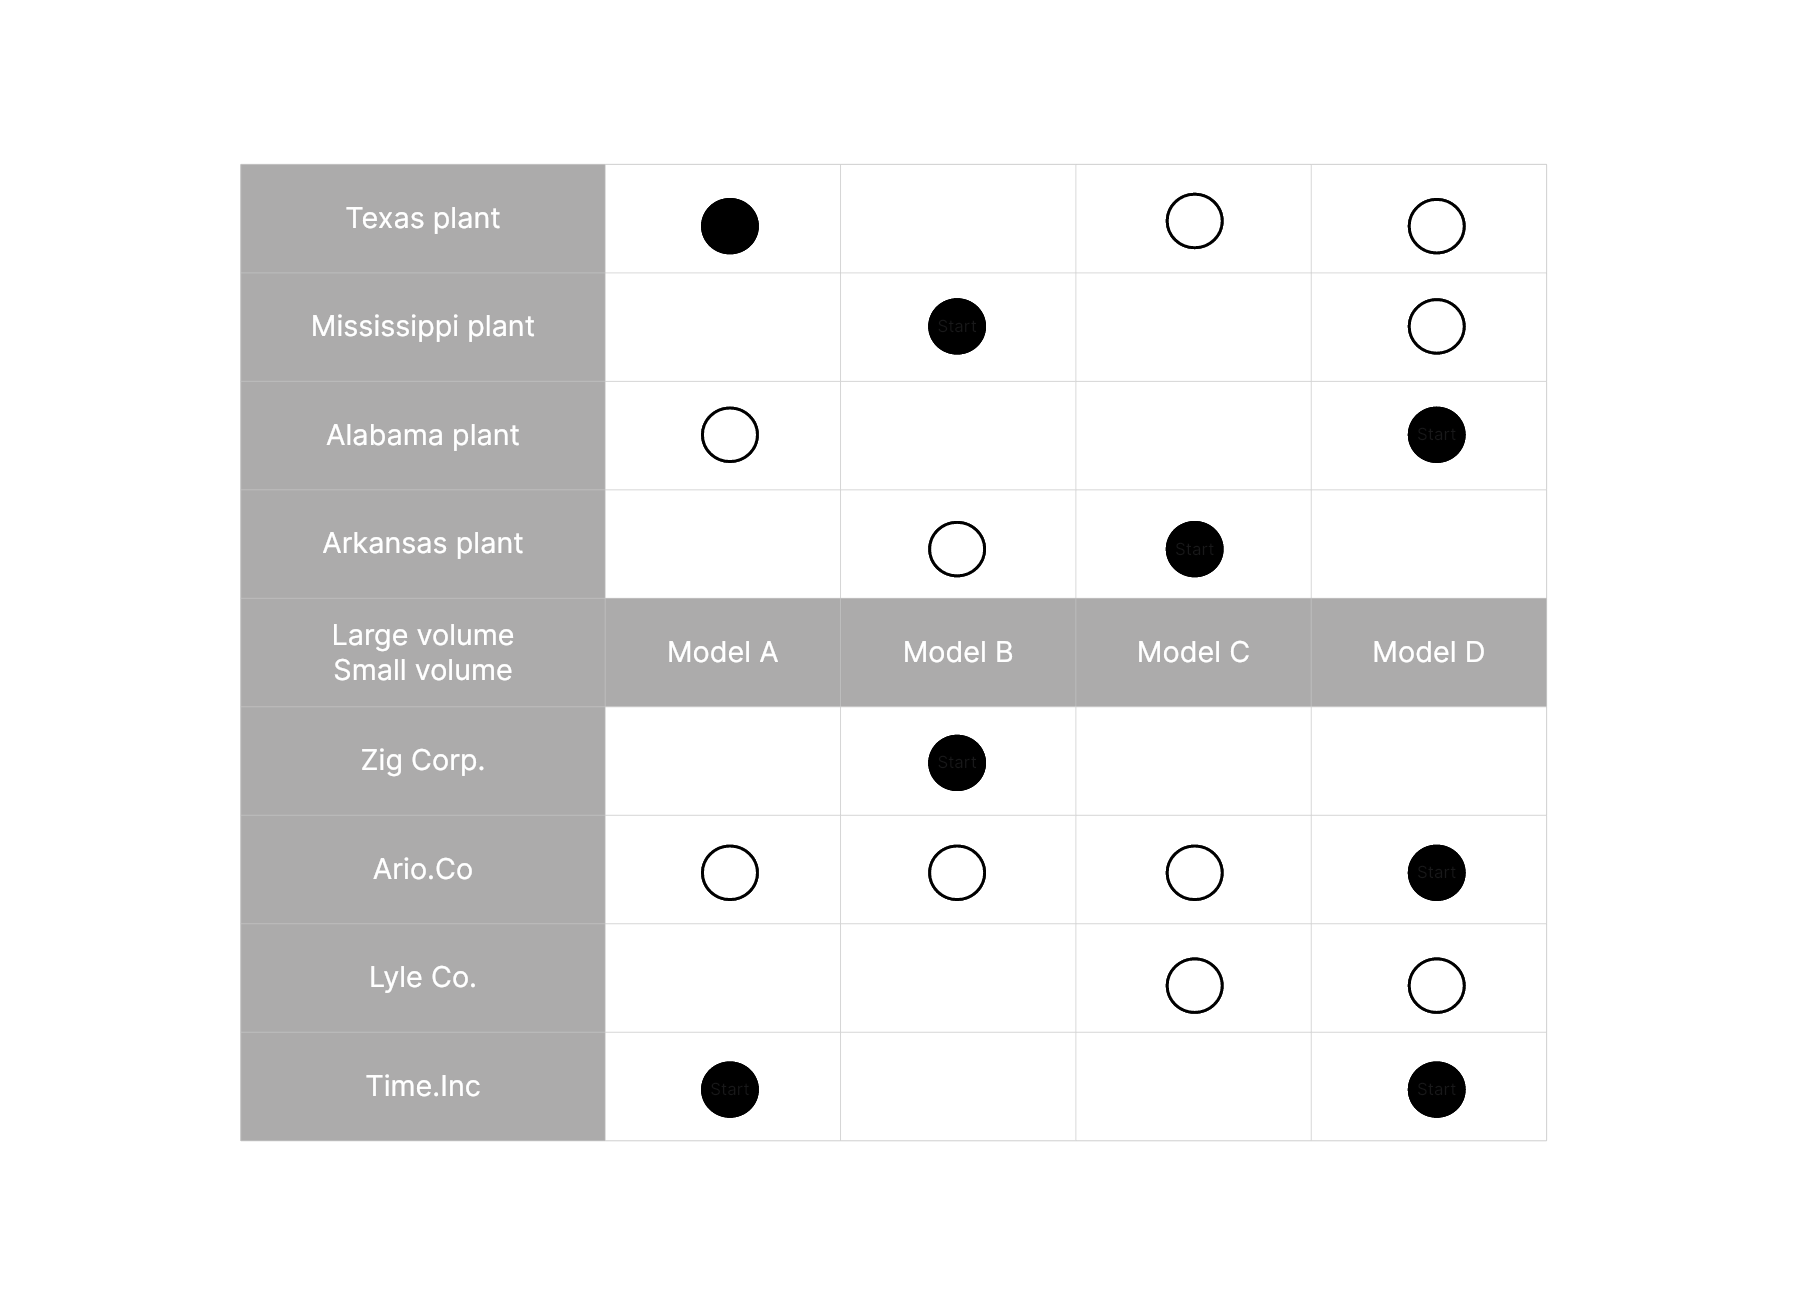
T-Shaped Matrix Diagram
A T-Shaped Matrix Diagram explores the relationship among three groups of items. One group relates to the other two groups independently, forming a 'T' shape. This diagram aids in investigating the interactions between multiple variables and analyzing how changes in one aspect could influence the others.
Y-Shaped Matrix Diagram
In a Y-Shaped Matrix Diagram, three sets of items are analyzed. This diagram is particularly useful when you need to assess interdependencies among three related components. It depicts the relationship in a 'Y' form, offering a detailed view of interactions among elements.
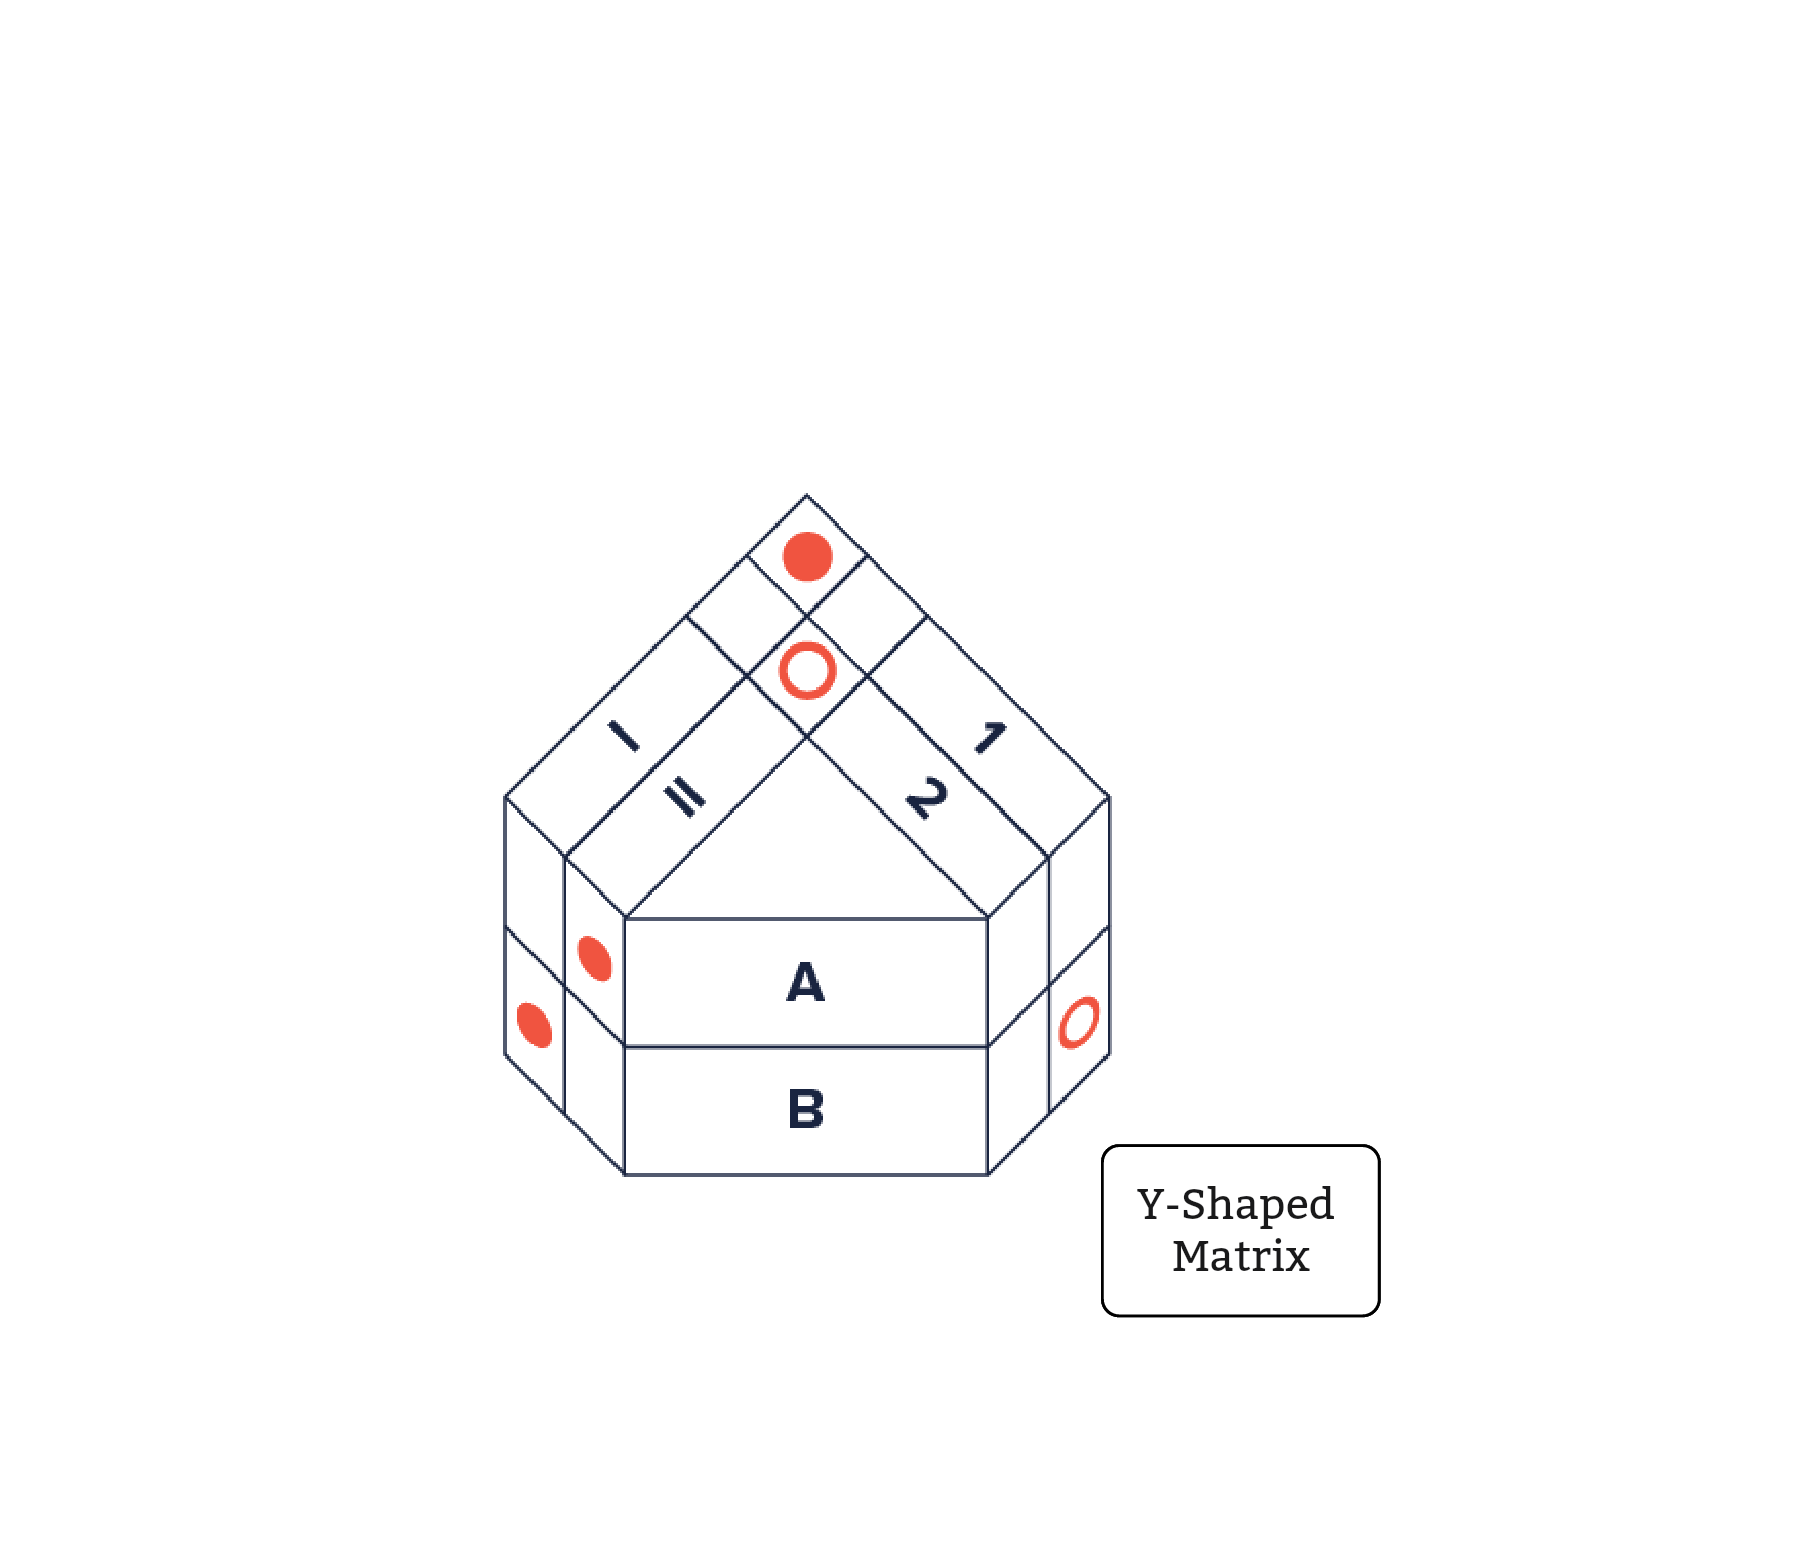
Image from vis.zone
C-Shaped Matrix Diagram
The C-Shaped Matrix Diagram highlights the relationship among three sets of items in a circular format. Each group impacts and is impacted by the other two groups, representing a continuous cycle of interaction. This format is handy when evaluating complex systems where factors are heavily interconnected.
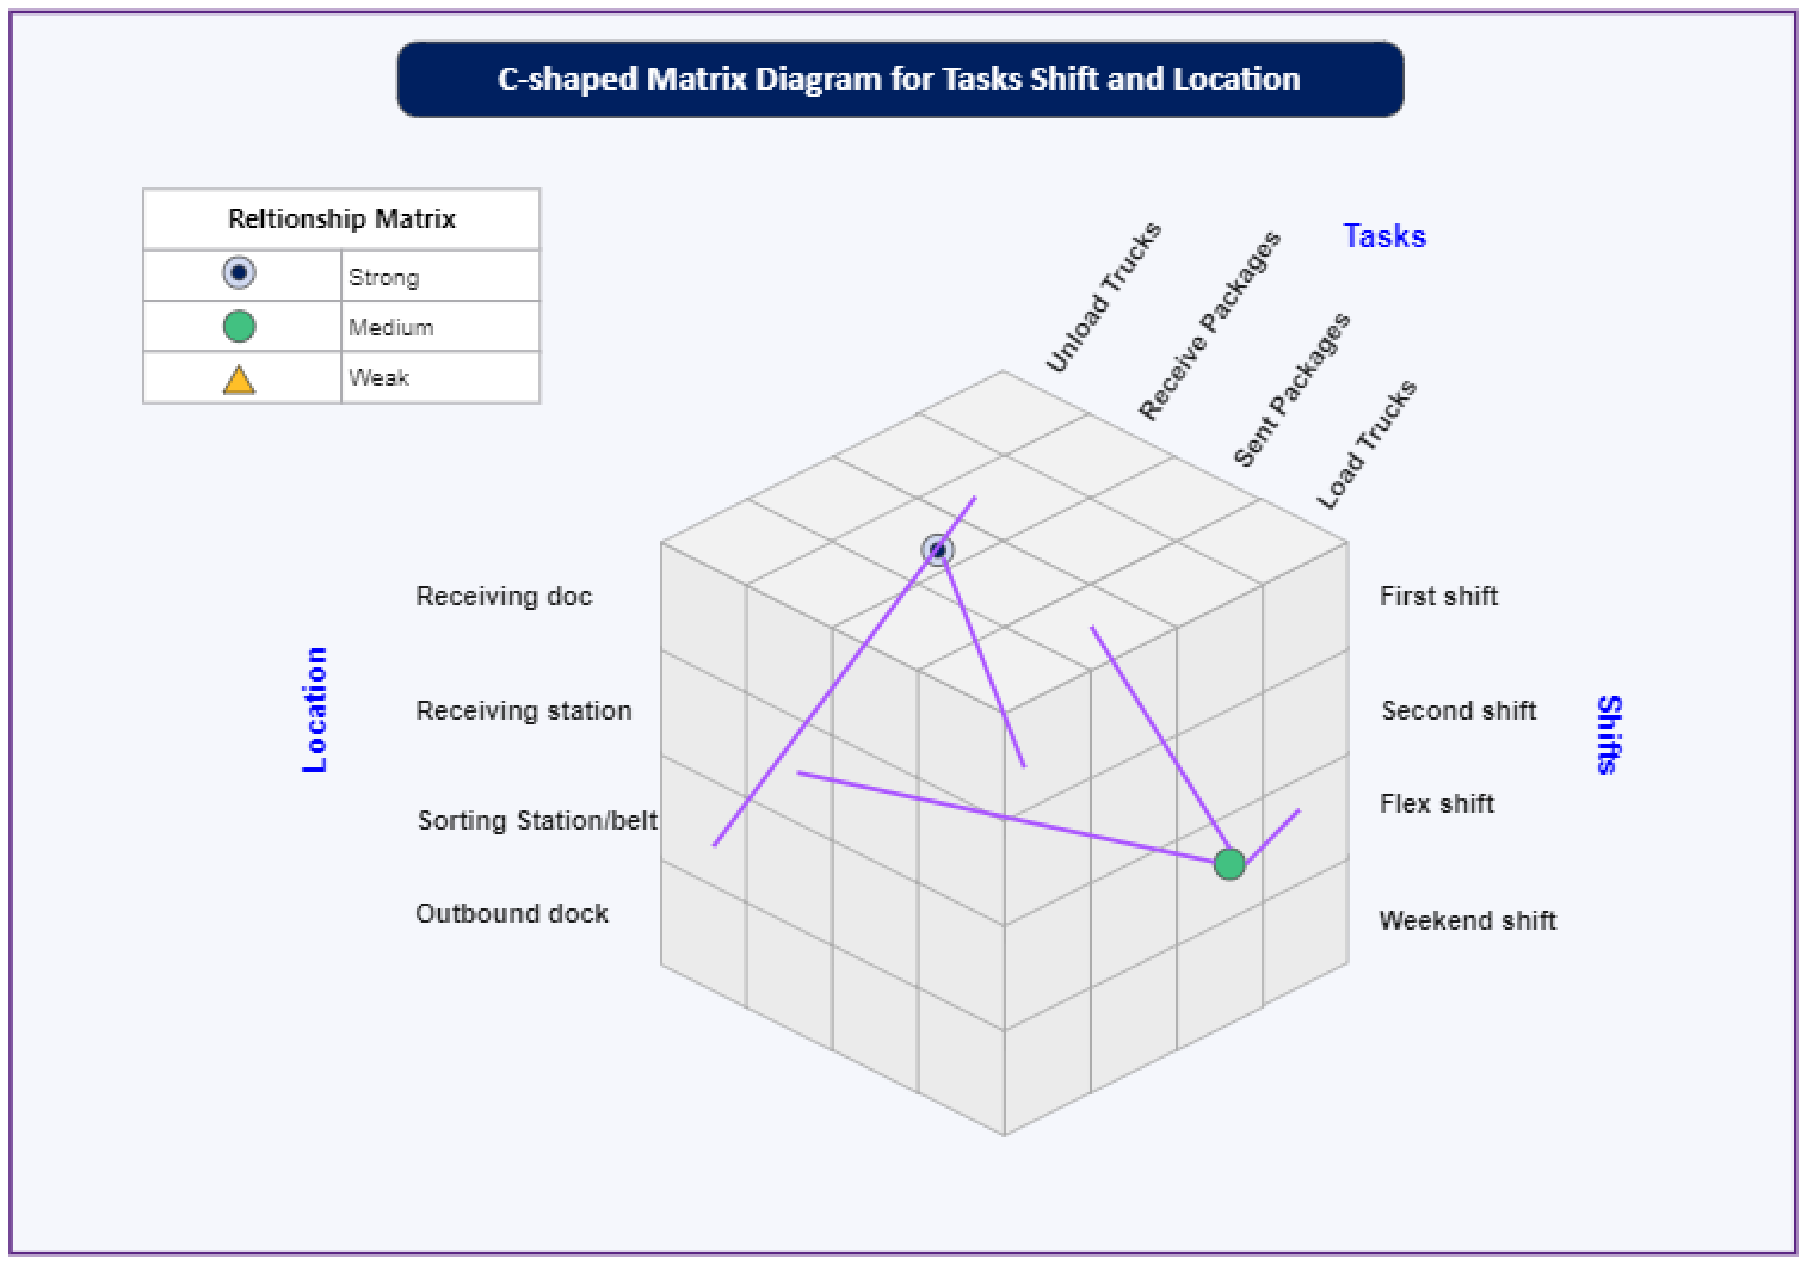
Image from EdrawMax
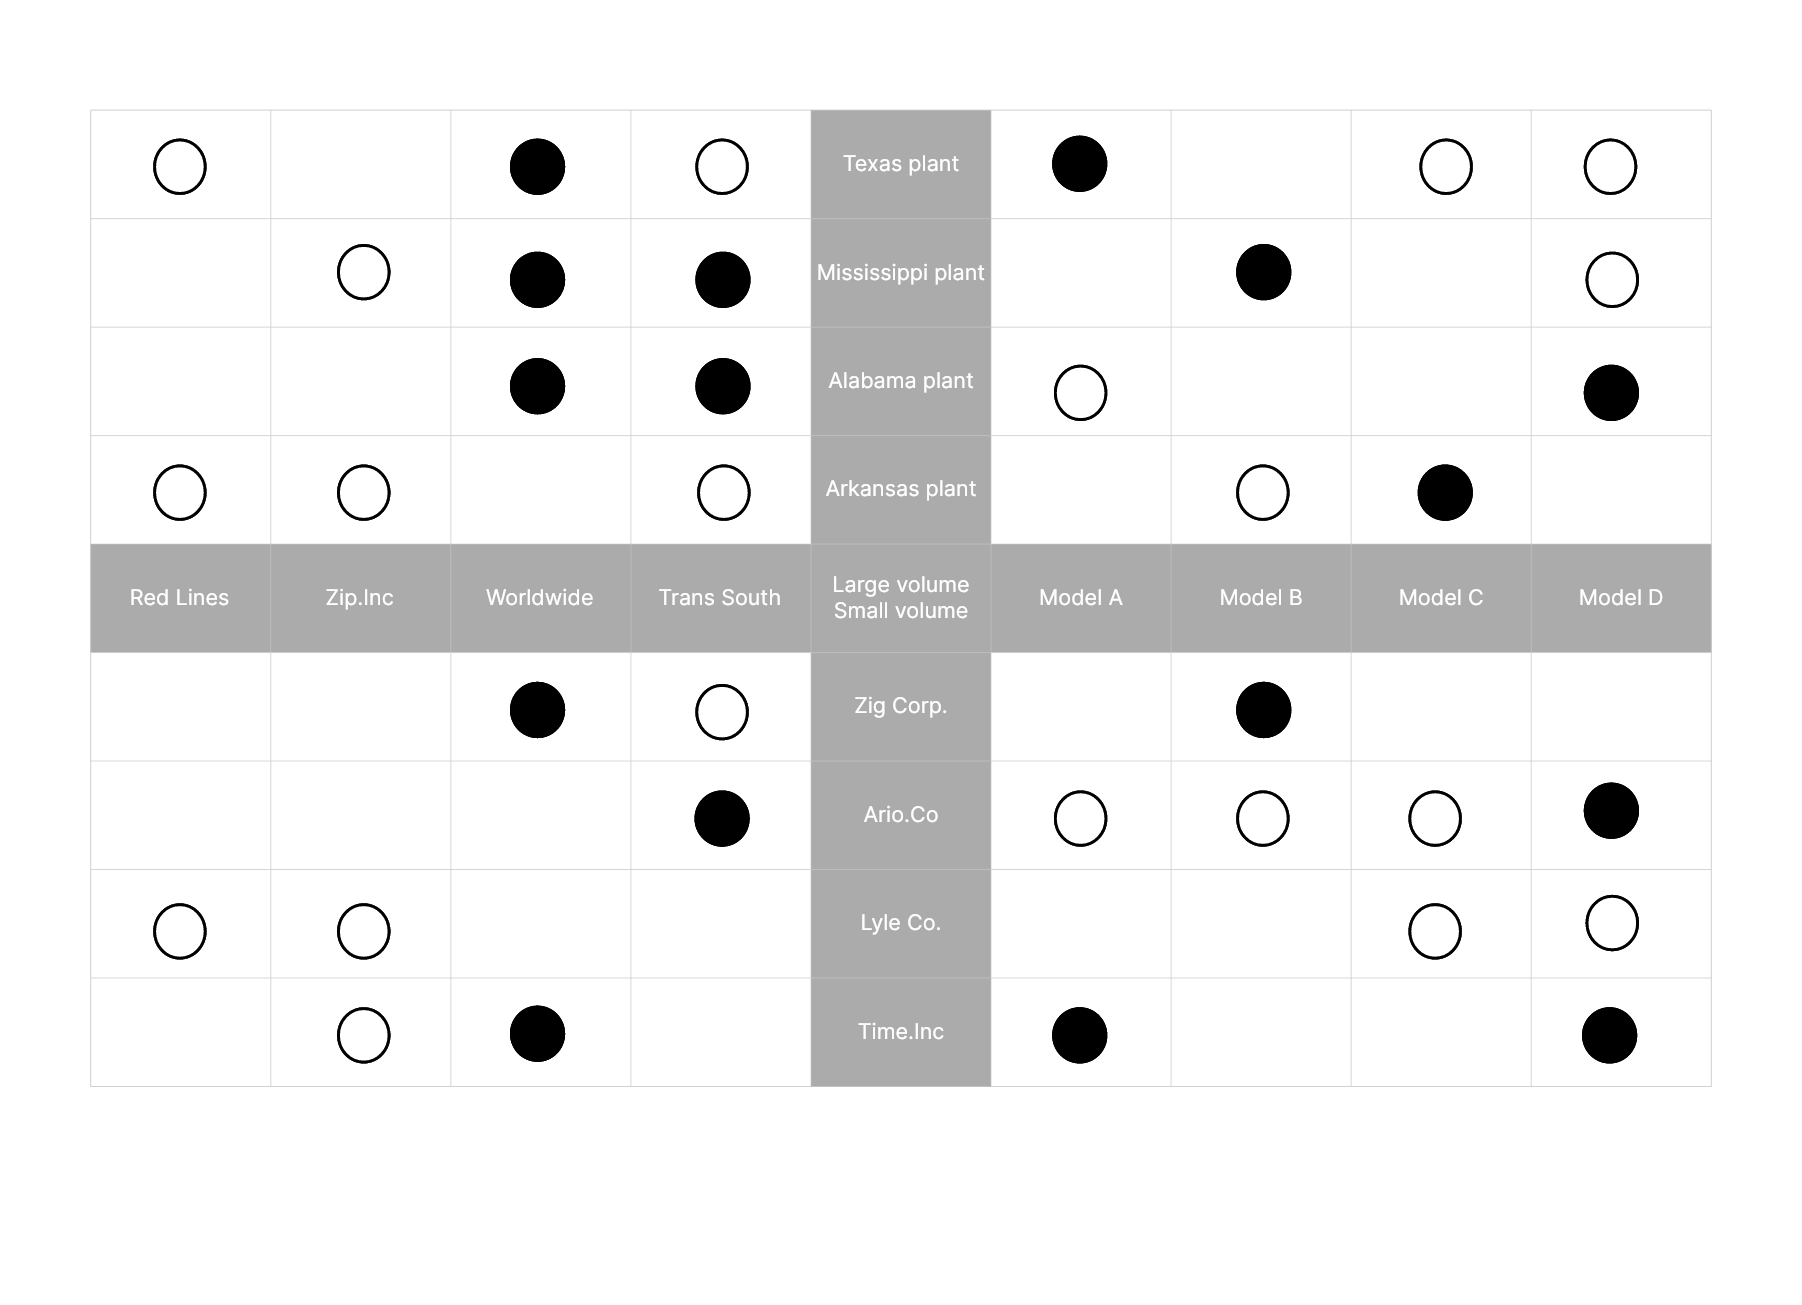
X-Shaped Matrix Diagram
An X-Shaped Matrix Diagram brings four groups of elements into analysis. Essentially two L-shaped matrix diagrams combined, this configuration allows a comprehensive understanding of correlations among all four groups.
Roof-Shaped Matrix Diagram
Also known as a Kano Model Diagram, the roof-shaped matrix demonstrates how various factors can support or counteract each other. By identifying positive and negative influences among elements, this type of matrix diagram can guide decisions regarding improvement initiatives or resource allocation.

Image from Data Viz Project
In summary, the diverse range of matrix diagrams offers considerable flexibility in visualizing and analyzing relationships among various items. By selecting the appropriate type, you can illuminate patterns, uncover insights, and make informed decisions.
How to Make a Matrix Diagram
Creating a matrix diagram can be an easy and systematic process if you know the right steps. These diagrams can serve as effective tools for visualizing relationships between two or more groups of elements. Below is a comprehensive guide on how to create your own matrix diagram.
Step 1: Define the Purpose
Before starting, it is essential to clearly understand why you need a matrix diagram. Identifying the purpose will help you determine what kind of matrix diagram you require and the elements that need to be included.
Step 2: Choose the Right Matrix Diagram Type
After you have defined the purpose, the next step is choosing the right type of matrix diagram. The choice depends on the number of groups of items you want to analyze. For instance, if you want to examine the relationship between two groups of items, an L-Shaped matrix would be suitable.
Step 3: List Down the Elements
The next step involves identifying all the elements that need to be analyzed. Each group's items should be listed down. These elements will form the rows and columns in your matrix diagram.
Step 4: Determine the Relationships
Now it's time to define the relationships between each pair of items from different groups. These relationships are represented by the cells where a row and column intersect.
Step 5: Create Your Matrix Diagram
After identifying all elements and relationships, draw the matrix diagram. Each cell can be filled with symbols, numbers, or color codes to represent different kinds of relationships. Online tools like Boardmix can make this process easier and quicker.
Step 6: Analyze and Interpret Your Matrix Diagram
Once your matrix diagram is ready, it’s time for analysis. Look for patterns, significant correlations, or surprising results. Draw conclusions based on your findings to inform decision-making.
To conclude, making a matrix diagram is an organized process that involves defining purpose, selecting the right type of matrix, identifying elements and relationships, creating the diagram, and analyzing it for insights. Whether for project management, risk assessment, or strategic planning, these diagrams are a powerful tool for visual understanding and effective decision-making.
Your One-stop Matrix Diagram Maker - Boardmix
When it comes to creating matrix diagrams, finding a tool that balances functionality, usability, and versatility can be a challenge. Boardmix emerges as a solution, providing an intuitive and robust platform for crafting and analyzing matrix diagrams. Here is an in-depth look at why Boardmix is your ultimate matrix diagram maker.

Effortless Designing
Boardmix simplifies the process of creating matrix diagrams. The user-friendly interface requires no steep learning curve. All it takes is a few clicks and drags to build your diagram, thanks to the platform's drag-and-drop functionality.
Versatility of Types
Whether you need an L-shaped, T-shaped, or X-shaped matrix diagram, Boardmix has you covered. The platform offers a wide array of diagram types to cater to your varying analytical needs. The versatility extends to customizing the look and feel of your diagrams to match your presentation style.
Rich Collaboration Features
Boardmix takes collaboration to the next level. You can invite team members to work on the same diagram in real-time, enabling efficient teamwork regardless of geographic location. Also, the built-in chat feature makes communication effortless.
Integration Capabilities
With Boardmix, you can seamlessly integrate with other platforms. Whether you need to import data from Excel, integrate with project management tools, or export your diagrams for presentations, Boardmix supports a broad spectrum of integrations.
Effective Analysis
Boardmix doesn't just let you create matrix diagrams; it also helps you analyze them. The platform provides tools that enable you to decode complex relationships and patterns in your diagram. This aids in data-driven decision-making and problem-solving.
Secure and Reliable
When using Boardmix, you can rest assured about the security and integrity of your data. The platform provides robust security features, ensuring your diagrams and underlying data are safe.
If you are seeking a comprehensive matrix diagram solution that offers ease of use, versatility, and powerful features, Boardmix is worth considering. Its comprehensive capabilities make it an ideal choice for individuals and teams looking to harness the power of matrix diagrams for improved decision-making and strategic planning. Just try it out now!


