


Effective project management is a crucial factor in the success of any business. One of the key tools used by project managers around the globe is a PERT chart. In this article, we delve into what a PERT chart is, its uses, the benefits it offers, and how to make one for efficient project management. Let’s get started!

What Is a PERT Chart
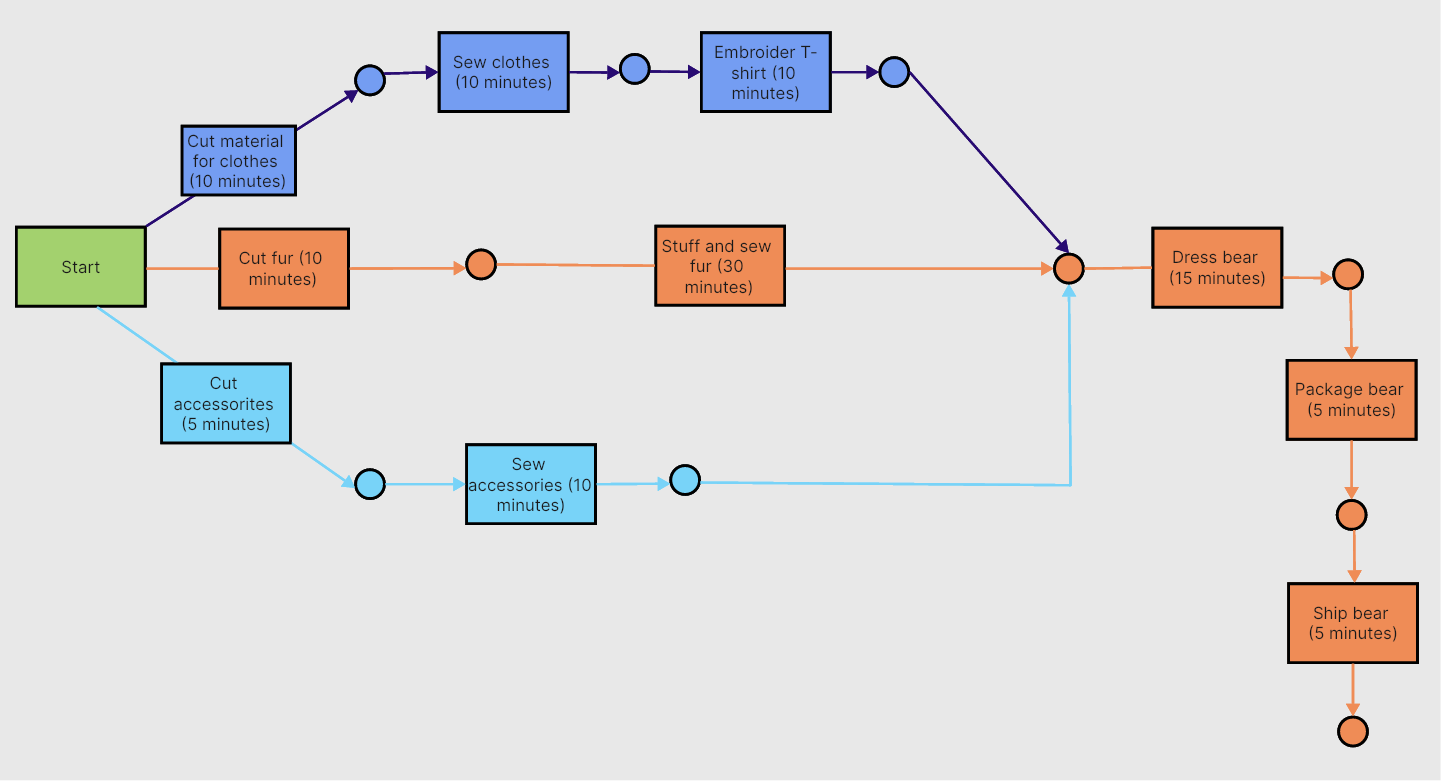
PERT, standing for Project Evaluation and Review Technique, is a diagrammatic tool that aids in planning and scheduling complex projects. A PERT chart presents an overview of the entire project scope, allowing managers to visualize tasks, their dependencies, and the projected time for completion. It's designed to illustrate the sequence of tasks needed to complete a project and help identify the critical path or the sequence of tasks that cannot be delayed without causing a delay in project completion.
What Is a PERT Chart Used for
PERT charts are used to analyze and represent the tasks involved in completing a given project. Key uses include:
- Project Planning: PERT charts aid in devising an efficient plan by outlining the sequence of tasks and their respective timelines.
- Task Sequencing: By visually presenting the order of tasks, they help identify dependencies, allowing teams to understand what tasks must be completed before others can start.
- Time Management: They provide an estimate of the minimum time required to complete the project by highlighting the critical path.
- Risk Identification: By predicting potential bottlenecks or delays in the process, PERT charts can help teams prepare for possible risks or setbacks.
Benefits of a PERT Diagram
PERT (Program Evaluation and Review Technique) diagrams offer several benefits in project management. Here are some of the key advantages:
Visual Representation
PERT diagrams provide a visual representation of the project schedule, making it easier for project managers and team members to understand the flow of tasks and dependencies.
Task Dependencies
PERT diagrams clearly illustrate task dependencies and relationships, helping project managers identify critical paths and ensure that tasks are sequenced in the most efficient way.
Identifying Critical Paths
Critical paths, which are the longest sequences of dependent tasks, are easily identified in PERT diagrams. Knowing the critical path is crucial for project managers to focus on tasks that could impact the overall project timeline.
Time Estimation
PERT allows for the estimation of time needed for each task. By incorporating optimistic, pessimistic, and most likely time estimates, project managers can create a more realistic timeline and manage expectations.
Project Coordination
PERT diagrams facilitate communication and coordination among team members. Everyone can see how their tasks fit into the overall project timeline, fostering collaboration and a shared understanding of project goals.
Risk Management
PERT encourages the identification of potential risks by considering optimistic and pessimistic time estimates. This helps project managers proactively address uncertainties and mitigate risks throughout the project lifecycle.
Resource Allocation
With a clear visualization of task dependencies, project managers can allocate resources more effectively, ensuring that team members are available when needed for specific tasks.
Performance Measurement
PERT diagrams enable the measurement of project performance against the planned schedule. Deviations from the critical path or delays in specific tasks can be easily identified and addressed.
Decision Support
PERT provides valuable information for decision-making. Project managers can use the diagram to assess the impact of changes in task sequences, resource allocation, or timelines on the overall project.
Documentation
PERT diagrams serve as documentation for project planning. They provide a historical record of how the project was initially planned, aiding in post-project analysis and lessons learned.
In summary, PERT diagrams enhance project management by providing a visual roadmap, aiding in time estimation, risk management, and decision-making, and fostering effective communication and coordination among team members.
How to Make a PERT Chart Step by Step
Boardmix offers project managers the ability to visually represent their project timelines and task dependencies in a PERT chart. With Boardmix, you can easily define tasks, establish task relationships, identify the critical path, and adjust project schedules, all within an interactive and collaborative platform. It's a versatile tool that accommodates any level of complexity and provides both simplicity and sophistication in managing your projects.

Creating a PERT chart using Boardmix is a simple and straightforward process. Here is a step-by-step guide on how to create a PERT chart using Boardmix:
Step 1: Sign in to Your Boardmix Account
Firstly, access the Boardmix platform and sign in using your credentials. If you do not have an account, register to create one.

Step 2: Create a New Board
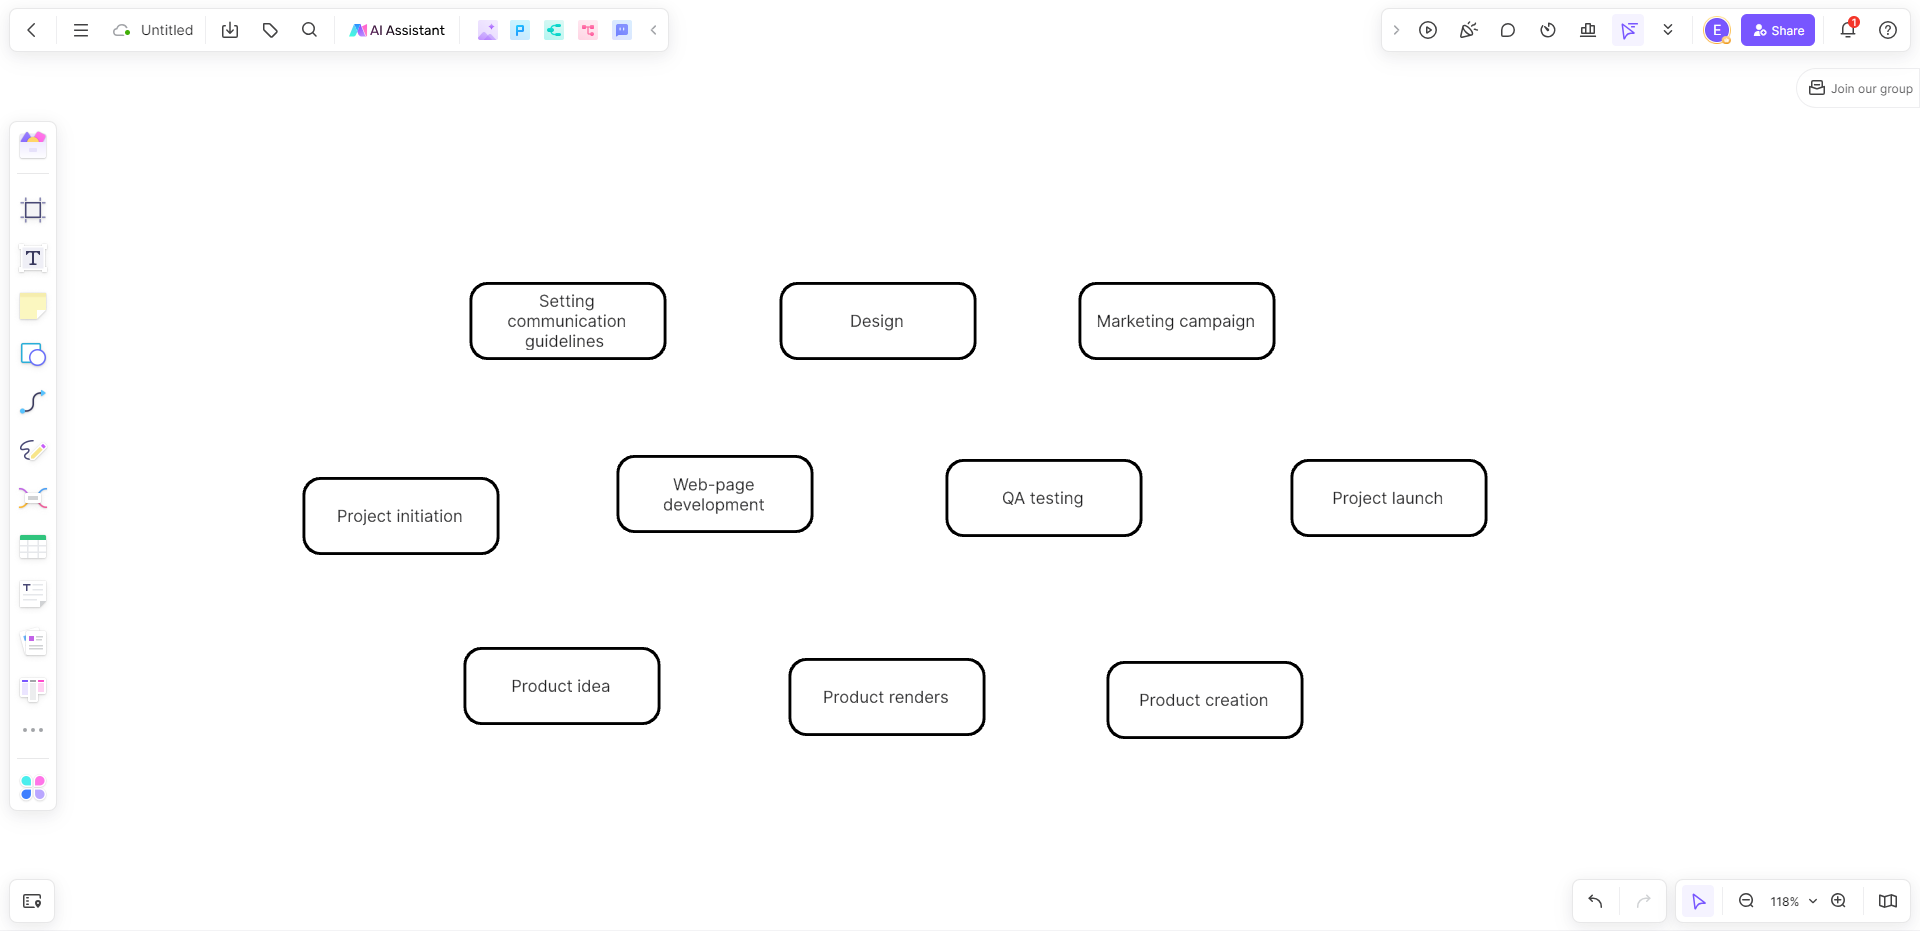
Click on the "New board" button located at the top left corner of the screen. Then you’ll enter the editor with the infinite canvas and various diagramming tools.

Step 3: Determine Tasks and Their Dependencies
You can decide all your tasks to be displayed in the chart. Once all tasks are defined, it's time to establish task dependencies.
Step 4: Identify the Critical Path
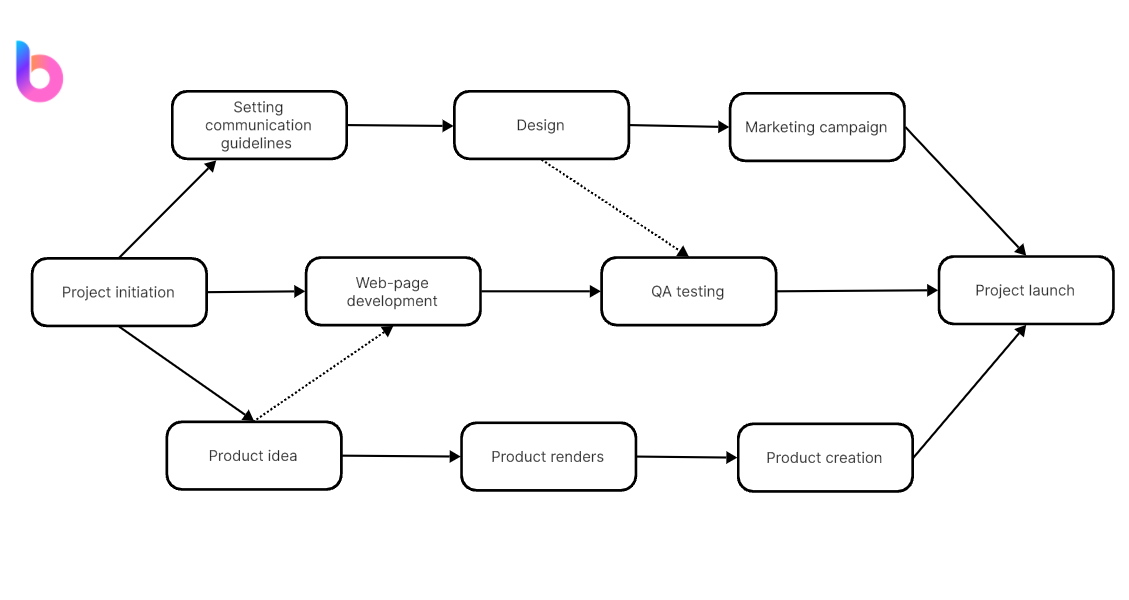
Boardmix provides the smart connection line for you to build the critical path in the PERT chart. Just type all the tasks and then connect them based on the dependencies.
Step 5: Adjust Schedules as Necessary
You can adjust task schedules when necessary. If a task's schedule changes, Boardmix will automatically update all changes in real time.
Step 6: Share Your PERT Chart
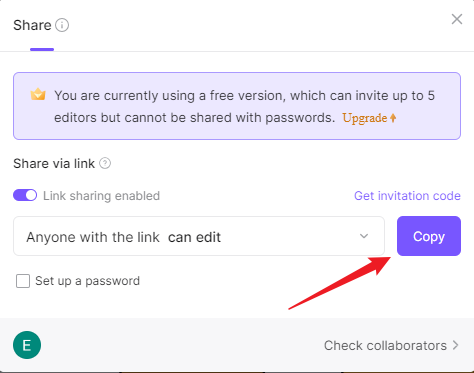
Once your PERT chart is complete, you can share it with team members or stakeholders directly from Boardmix.
With Boardmix’s intuitive platform, creating a PERT chart has never been easier. By visually displaying your project timeline, tasks and their dependencies, you can effectively manage your project and enhance overall productivity.
Tips and Tricks on Making a PERT Chart
A PERT (Project Evaluation and Review Technique) chart is an invaluable project management tool, enabling teams to visualize and coordinate tasks effectively. While creating a PERT chart is straightforward, there are tips and tricks that can streamline the process and optimize the use of this tool. Let's delve into them.
- Define All Tasks: Before you begin creating your PERT chart, it’s vital to have a complete list of all tasks needed to complete the project. Having a clear understanding of each task will enable you to correctly outline the sequence of tasks and their dependencies.
- Determine Task Dependencies: Knowing which tasks are dependent on the completion of others is crucial in plotting an accurate PERT chart. Proper identification of task dependencies allows you to establish an accurate project timeline.
- Identify Critical Path: The critical path represents the sequence of tasks that determine the project's shortest completion time. Identifying this path allows you to prioritize these tasks and ensure they are not delayed, which would subsequently delay the entire project.
- Use an Appropriate Scale: When designing your PERT chart, it's important to use an appropriate scale for your timeline. This helps avoid clutter and makes it easier to read and understand the chart.
- Update Your PERT Chart Regularly: PERT charts are not static and should be updated regularly to reflect changes in the project plan or schedule. Regular updates will keep your chart accurate and up-to-date, ensuring effective project management.
- Use Software Tools: Software tools can greatly simplify the process of creating a PERT chart. These tools allow you to quickly define tasks, establish dependencies, and automatically calculate your critical path. They also provide collaborative features that can enhance team coordination.
- Clearly Define Milestones: Milestones are key points in your project that signify important achievements or stages of development. Clearly defining these milestones in your PERT chart provides team members with a clear vision of what needs to be achieved and by when.
- Make Use of Colors: Colors can be used effectively to distinguish between different tasks, highlight critical paths, or denote task statuses. This can make your PERT chart easier to read and understand.
In conclusion, while creating a PERT chart might initially seem like a daunting task, understanding these tips and tricks will make the process significantly easier and more efficient. Implementing these practices will aid in managing complex projects effectively, ensuring a smoother path to project completion.
PERT Chart vs. Gantt Chart
- Visual Representation
While both charts provide visual representations of project tasks, they differ in presentation. PERT charts use arrows and nodes to represent tasks and their dependencies, providing a network model of the project. In contrast, Gantt charts use horizontal bars against a calendar timeline, making it easier to see task durations and overlaps.
- Task Dependencies
Both charts address task dependencies, but PERT charts excel in visualizing complex dependencies and multiple task paths. They are better suited for projects where tasks have multiple dependencies. Gantt charts can represent simple dependencies but can become difficult to interpret with complex, interdependent tasks.
- Time Management
Gantt charts provide a clear view of the task schedule, making it easy to understand when individual tasks should start or end and how long they should take. On the other hand, PERT charts highlight the critical path in the project, focusing on sequencing and prioritization of tasks rather than specific scheduling.
- Complexity of Projects
PERT charts are ideal for complex projects with uncertain task durations as they focus on task order and critical paths. They allow project managers to see the project's flow and identify potential bottlenecks or delays. Gantt charts are more suitable for straightforward projects with predictable task durations and simple dependencies.
- Flexibility
Gantt charts are generally more flexible for making adjustments as projects progress. They allow easy updates to task schedules by shifting the horizontal bars. Changes in PERT charts can affect the entire project network, making them less adaptable to schedule modifications.
In conclusion, both PERT charts and Gantt charts offer valuable tools for project management. The choice between them depends on the nature of your project. Understanding their strengths and weaknesses will enable you to choose the one that best suits your project's needs.


