


In the realm of biological sciences, understanding intricate processes like photosynthesis is paramount. A Photosynthesis Flow Chart can be a practical and effective way to visualize and grasp this complex sequence of reactions. This article provides an overview of photosynthesis, explains why a flow chart can simplify its understanding, and discusses the benefits of using a flow chart for studying photosynthesis. You can also have a deeper understanding of the photosynthesis process diagram via a detailed example. Let’s get started.
What is a Photosynthesis Process
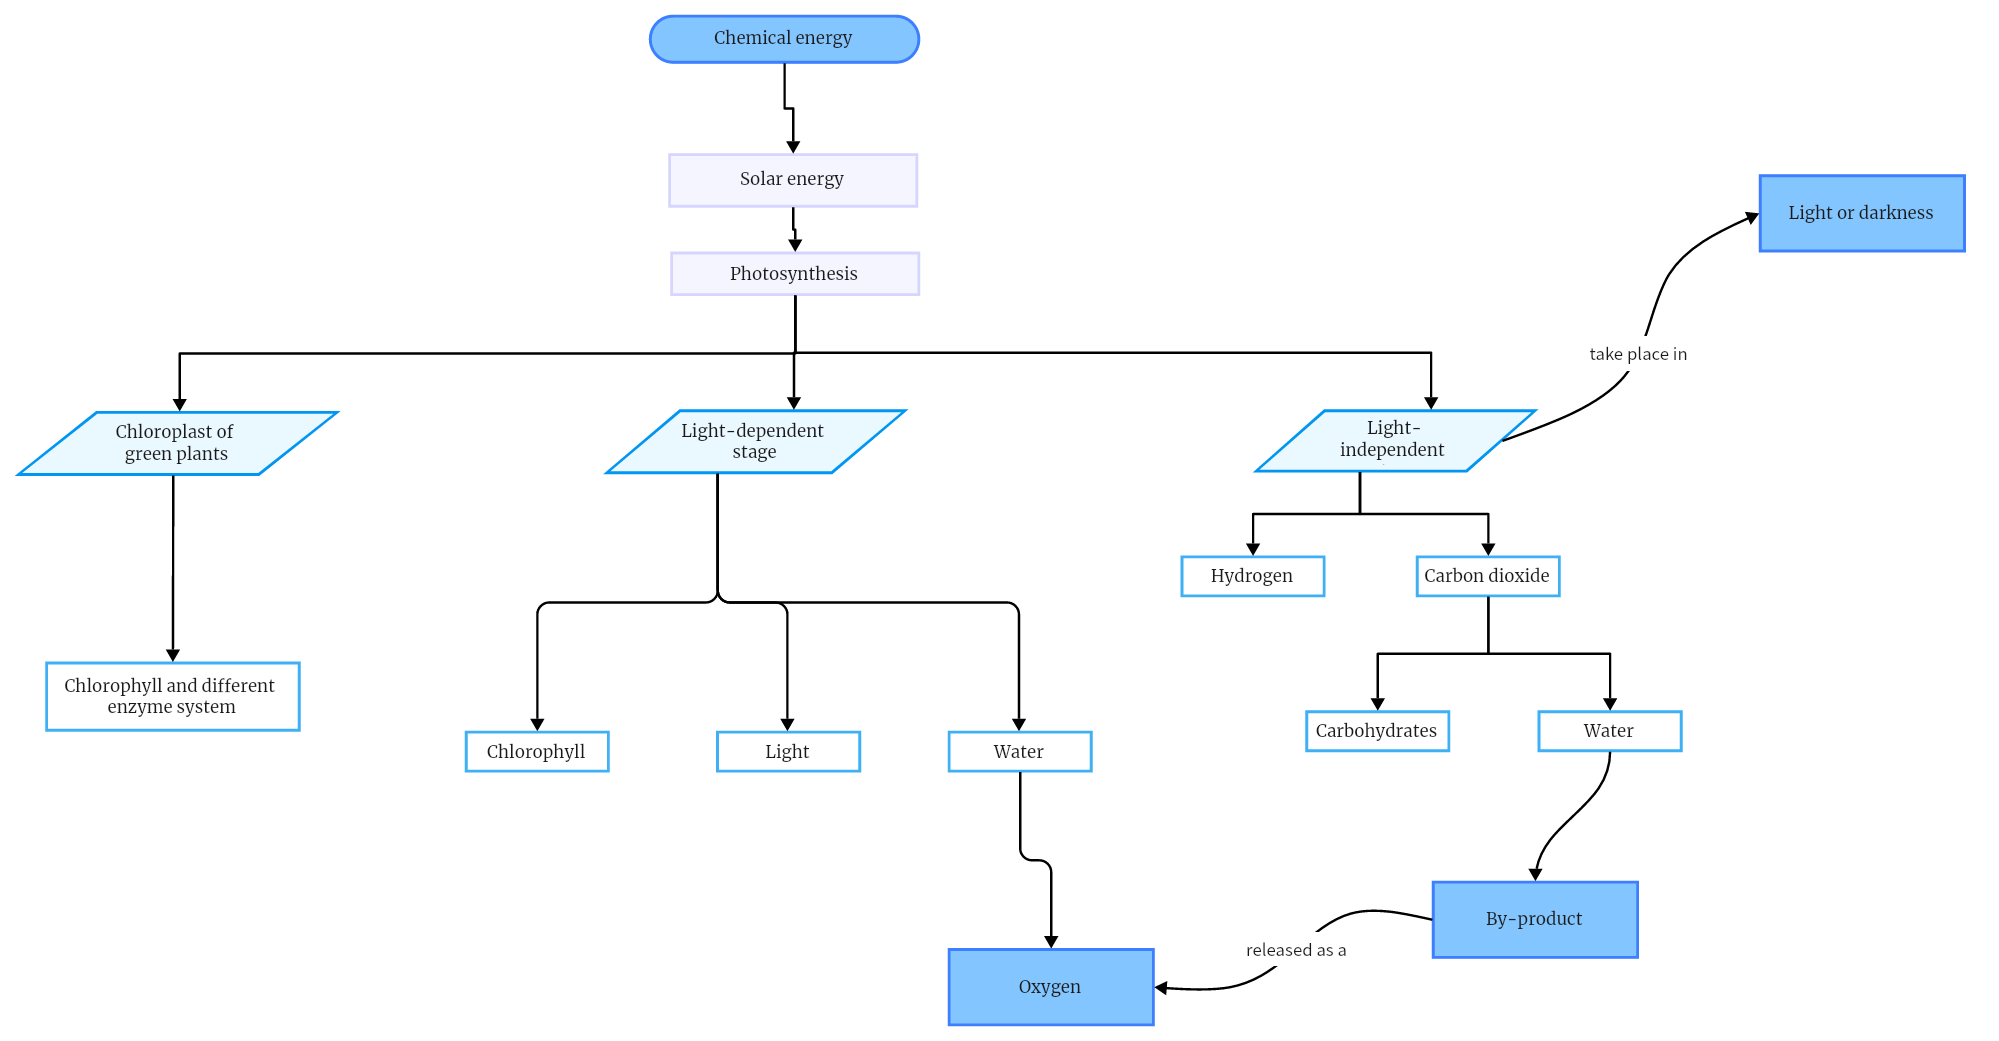
Photosynthesis is a biochemical process in which plants, algae, and some bacteria convert light energy, usually from the sun, into chemical energy in the form of glucose or sugar. This process is essential for life on Earth as it is the primary source of oxygen and it forms the foundation of the food chain.
Photosynthesis consists of two main stages: Light-dependent Reactions and Light-independent Reactions (also known as the Calvin Cycle). In the Light-dependent Reactions, which take place in the thylakoid membranes of the chloroplasts, light energy is converted into chemical energy (ATP and NADPH). The Light-independent Reactions or Calvin Cycle occurs in the stroma of the chloroplasts, where the chemical energy from ATP and NADPH is used to convert carbon dioxide into glucose.
Why Use a Flow Chart for Photosynthesis
Given the complexity and multi-stage nature of photosynthesis, representing this process visually through a flow chart can be incredibly beneficial. A photosynthesis flow chart allows learners to break down this intricate process into manageable parts and provides a visual representation of each stage and the sequence in which they occur.
The use of different shapes, arrows, and colors in a flowchart can also help distinguish between various stages, sub-stages, inputs, and outputs of photosynthesis. Additionally, visual learners particularly benefit from flowcharts as they provide an alternative learning tool to text-based materials.
Benefits of Photosynthesis Flow Chart
Utilizing a Photosynthesis Flow Chart offers numerous benefits:
- Enhanced Understanding: A flow chart simplifies the process of photosynthesis, breaking it down into individual steps. This step-by-step visualization helps students understand the sequence and interactions of reactions involved in photosynthesis.
- Easy Memorization: By visualizing each phase through a flowchart, learners can recall the process more easily. It also assists in remembering various components involved at different stages.
- Effective Communication: Flowcharts allow teachers and students to communicate complex ideas more effectively. They provide a universal language that bridges any understanding gaps.
- Efficient Revision Tool: Photosynthesis flow charts can serve as excellent revision tools. Reviewing a well-structured flowchart can help reinforce learning and prepare for examinations.
Flowcharts are a significant asset when trying to comprehend complex biological processes like photosynthesis. They streamline learning by providing a clear, visual representation of each stage of the process and enhancing overall understanding and recall.
A Detailed Photosynthesis Process Diagram Example
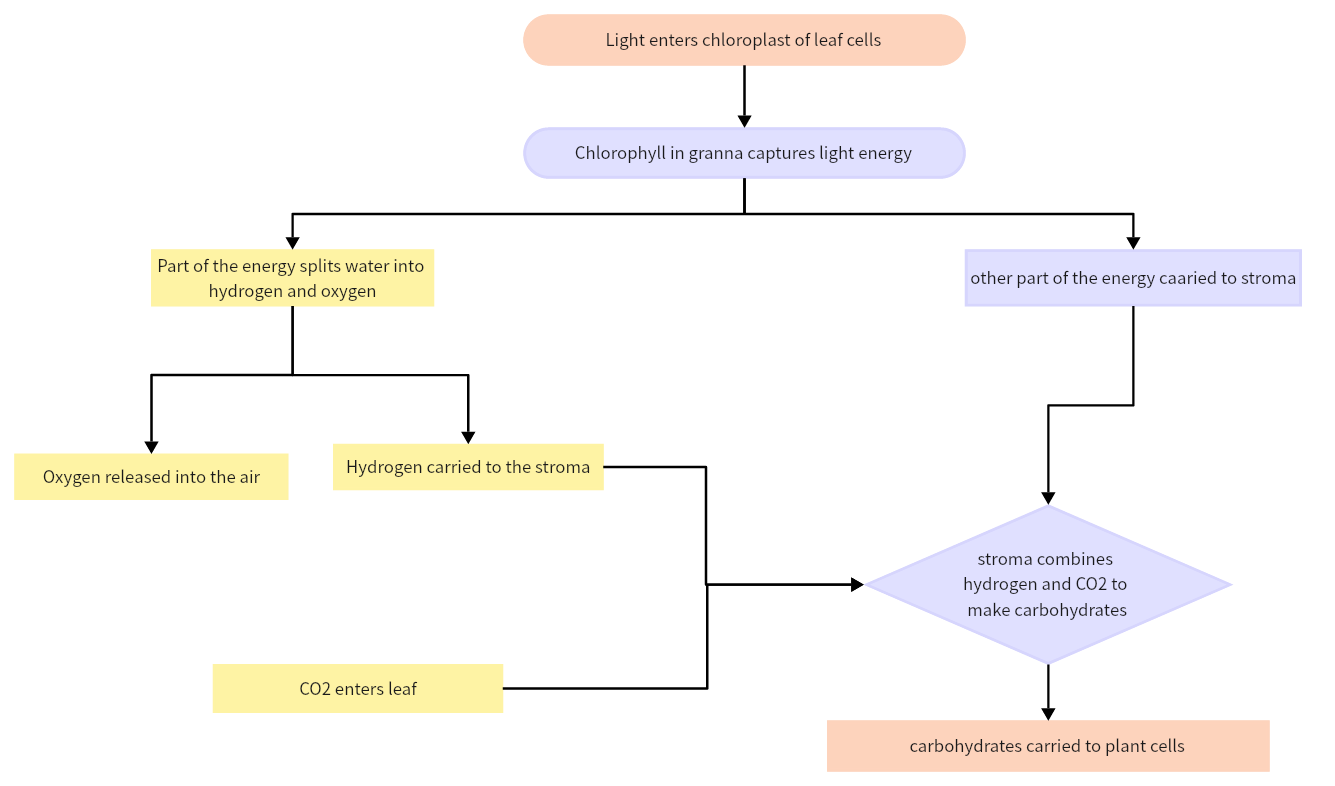
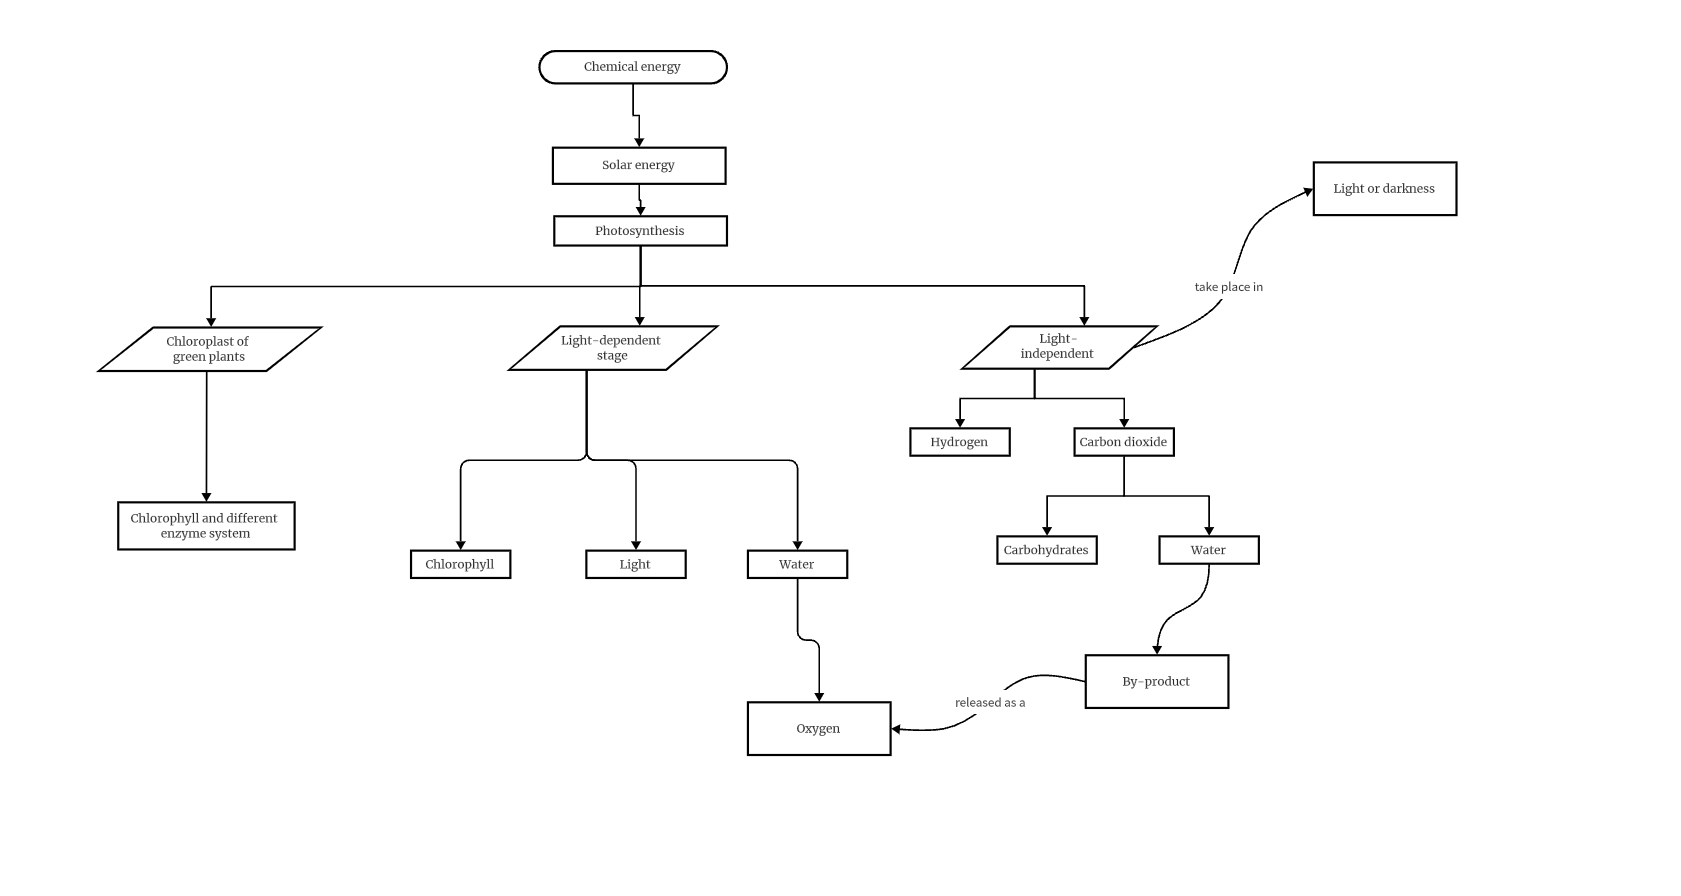
In this part, we'll dissect a specific photosynthesis process diagram. This particular flowchart displayed below gives a comprehensive, detailed, and visual overview of the photosynthesis process. It is divided into three main sections: Input, Process, and Output.
1. Input Section:
The input section, on the left side of the map, lists the requirements for photosynthesis to occur. There are three main inputs:
Light Energy: Typically from the sun, this is absorbed by chlorophyll within the chloroplasts.
Carbon Dioxide (CO2): Plants obtain carbon dioxide from the atmosphere through their leaves.
Water (H2O): Water is drawn up from the roots to the leaves.
2. Process Section:
The process section is in the middle of the map, illustrating two stages of photosynthesis:
Light-dependent Reactions: In these reactions, which take place in the thylakoid membranes of chloroplasts, light energy is converted into chemical energy - ATP (Adenosine Triphosphate) and NADPH (Nicotinamide Adenine Dinucleotide Phosphate). Oxygen is released as a by-product during these reactions.
Light-independent Reactions (Calvin Cycle): Occurring in the stroma of chloroplasts, ATP and NADPH from the light-dependent reactions are used to convert carbon dioxide into glucose. This process does not directly require light, hence the term "light-independent".
3. Output Section:
The output section is on the right side of the map. There are two main products of photosynthesis:
Oxygen (O2): This is produced as a by-product during light-dependent reactions and is released into the atmosphere.
Glucose (C6H12O6): This is produced during the Calvin Cycle and used by the plant for growth and energy.
This detailed photosynthesis flow chart effectively presents an overview of photosynthesis, breaking down its complexity into manageable sections. It showcases the inputs required, the steps involved in the process, and the outputs produced, enhancing understanding and recall of this crucial biological process.
How to Make a Photosynthesis Flow Chart in Boardmix
Boardmix, with its intuitive and easy-to-use features, is an excellent tool for creating visual representations such as flow charts. Here's how you can make a photosynthesis flow chart using Boardmix.

Create a New Boardmix Board: Open Boardmix and click on "New Project". Give your project a name related to photosynthesis to easily locate it later.

Select Flowchart Template: Choose the flowchart template from the library of templates. This will provide a basic layout for your flowchart.

Define Inputs and Outputs: Start your flowchart by defining the inputs (light, water, and carbon dioxide) and outputs (oxygen and glucose) of photosynthesis. Use the shapes or images provided by Boardmix to visually represent these elements.
Illustrate Process Components: Divide the process of photosynthesis into two main stages: the light-dependent reactions and the Calvin cycle. You can use different shapes to differentiate between these two stages.
Add Details: Within each stage, break down the process further by highlighting key reactions and their products. You can use arrows or lines to show the progression of reactions and how one step leads to another.
Label Appropriately: Make sure every shape, image, or line used in your flowchart is clearly labeled for easy understanding. Use text boxes to add any necessary explanations or details.
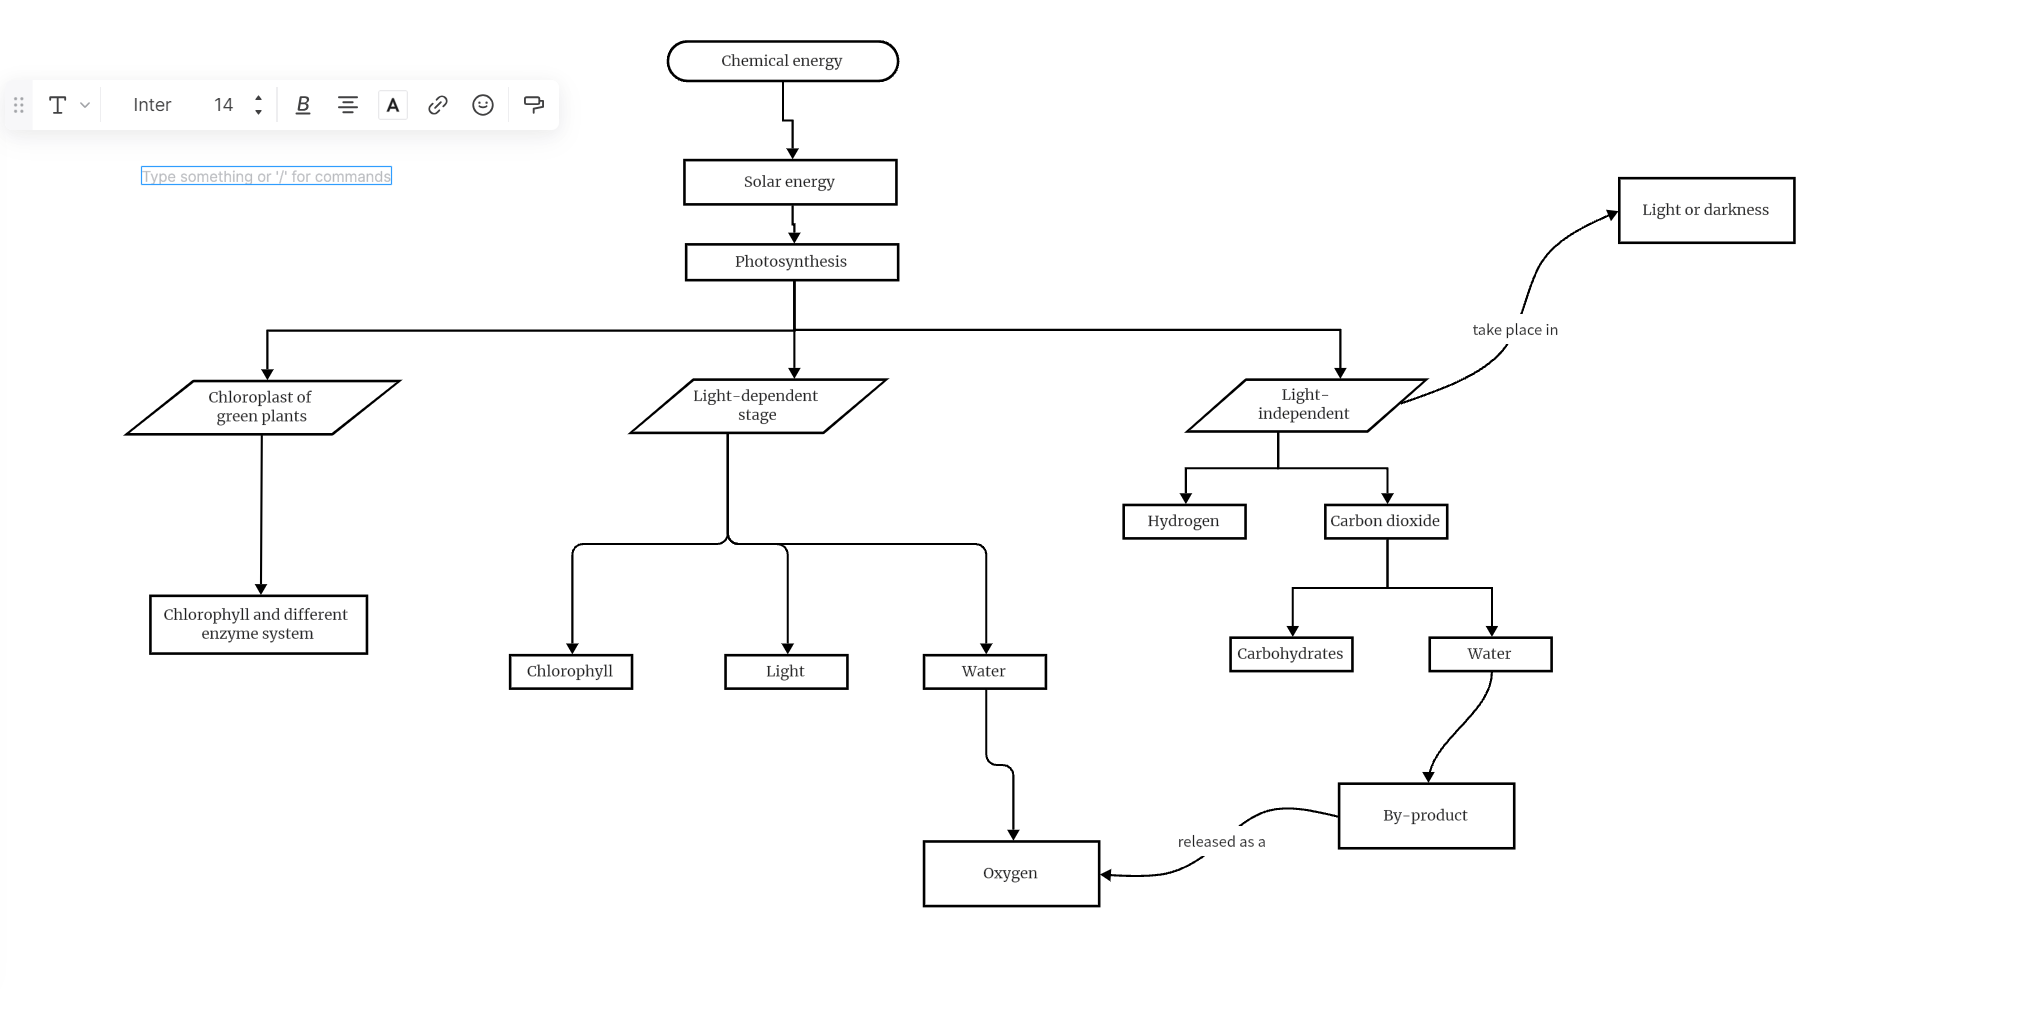
Review and Adjust: Once you've finished, review your flowchart for any errors or areas that might need clarification. Boardmix allows you to easily move, resize, or change colors of shapes, lines, and text for better visualization.
Share and Export: After you're satisfied with your flowchart, you can share it with others. You can also export it in various formats for printing or for use in presentations.
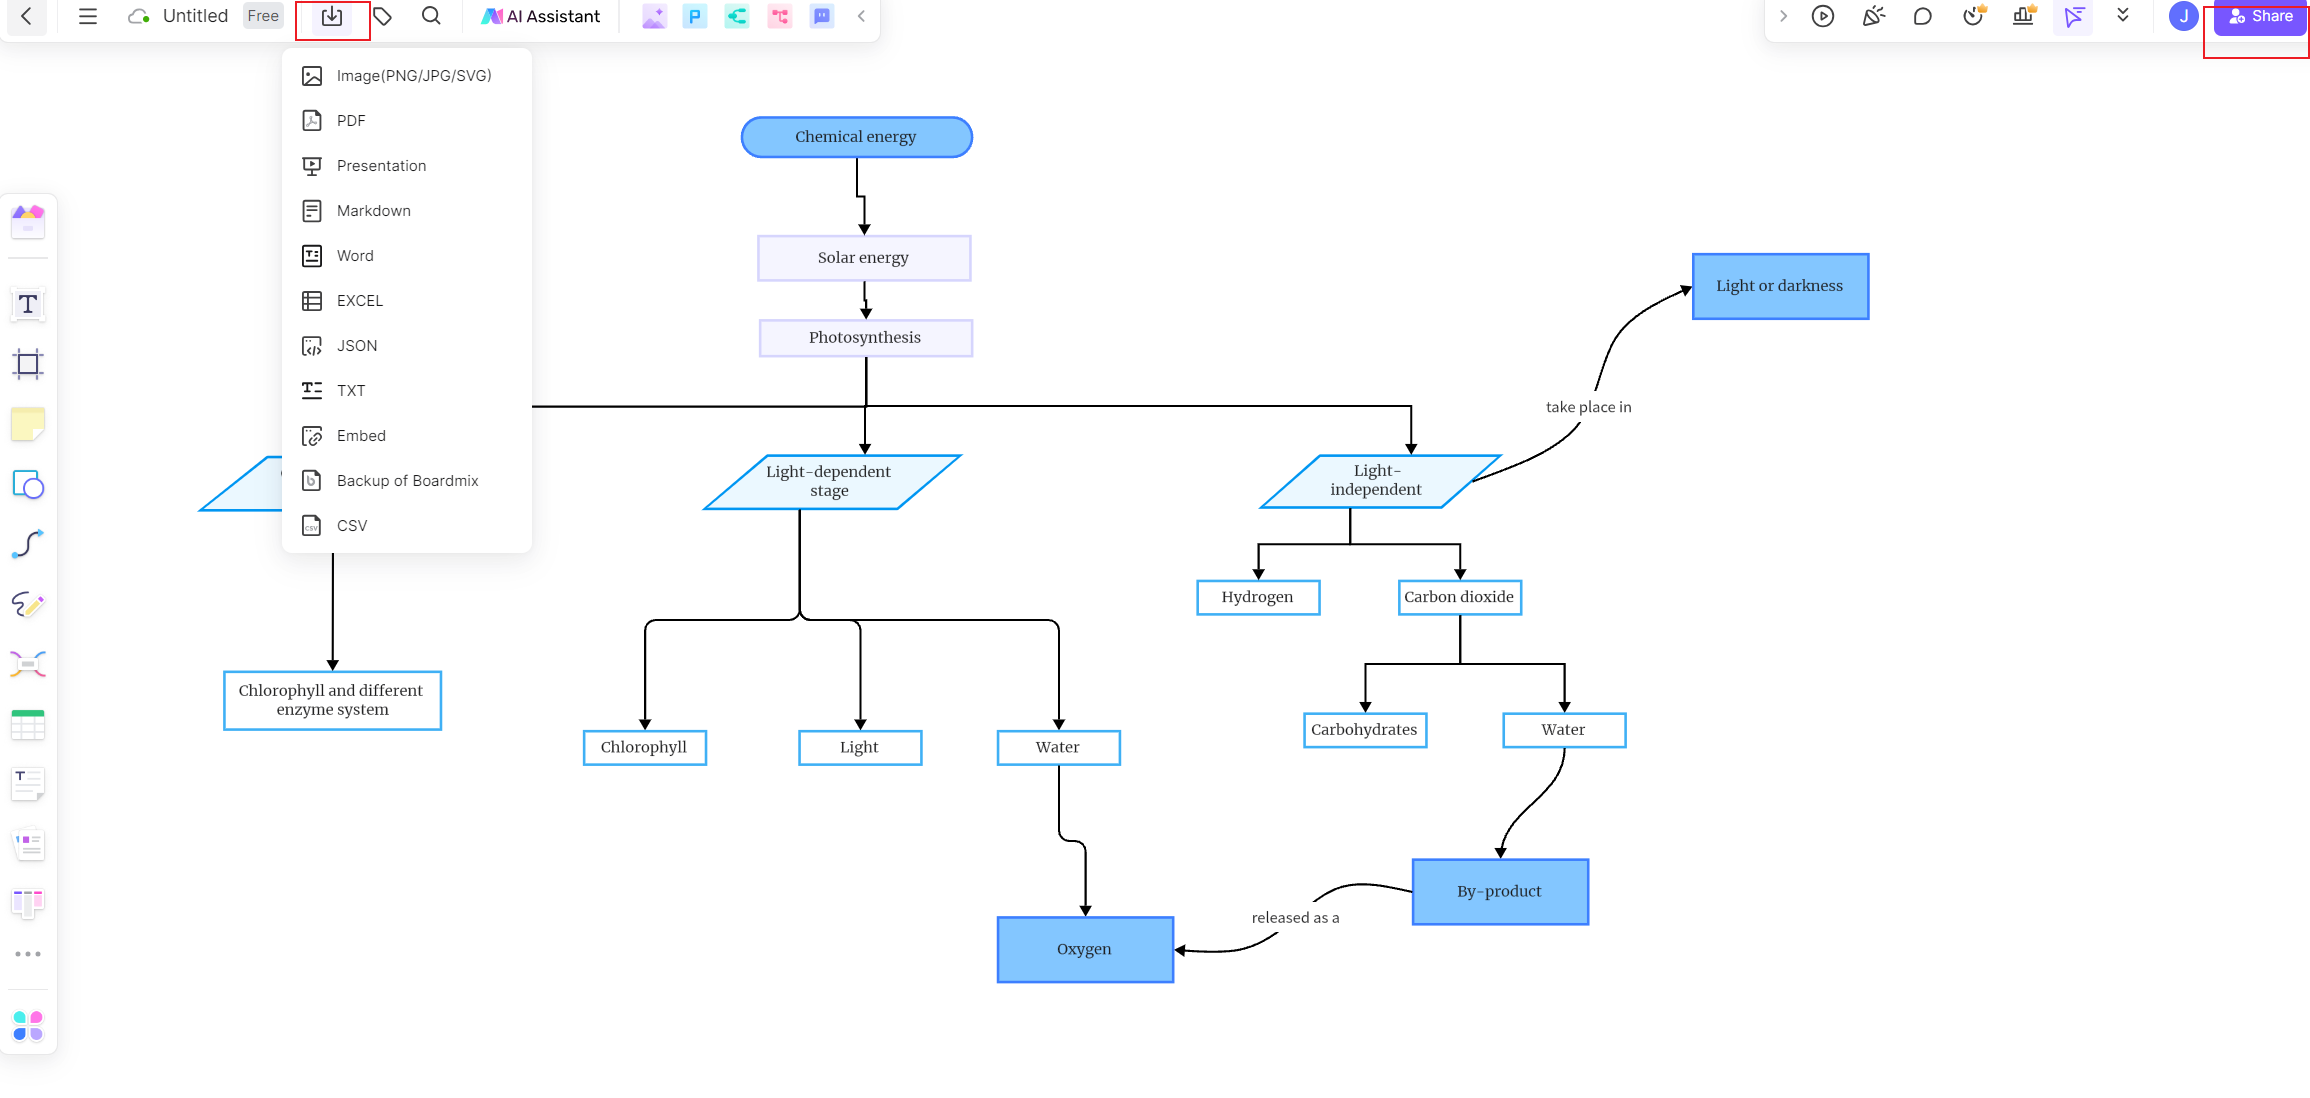
By following these steps, you can effectively create a detailed and comprehensive photosynthesis flow chart on Boardmix that visually explains this intricate biological process.
Tips and Tricks on Making a Photosynthesis Process Diagram
Creating a photosynthesis process diagram is not merely about the placement of arrows and shapes. It requires a keen understanding of the process and the ability to represent it clearly and logically. Here are some valuable tips and tricks to aid you in creating an effective photosynthesis process diagram:
- Simplify Complex Processes: The photosynthesis process can be complex and overwhelming. Break it down into smaller, manageable sections or stages, such as light-dependent reactions and light-independent reactions (Calvin Cycle), to simplify it.
- Use Symbols Wisely: Symbols can greatly enhance the visual appeal and understandability of your diagram. However, too many can be confusing. Stick to basic shapes like circles, rectangles, and arrows, ensuring they are used consistently throughout the diagram.
- Make Effective Use of Colors: Colors are not just for aesthetic purposes. They can be used to distinguish between different stages, processes, or components of photosynthesis. For instance, you could use one color for inputs, another for processes, and a third for outputs.
- Ensure Readability: Your diagram should be easily readable. Make sure the text in your diagram is large enough to read and use fonts that are clear and simple. It's also important to make sure any arrows or lines are distinct and visible.
- Logical Flow: Arrange your diagram elements so they flow logically. This usually means having inputs on one side (left), processes in the middle, and outputs on the other side (right). Arrows should indicate the direction of flow.
- Add Explanatory Notes: If a certain part of the process is complex, don't hesitate to add explanatory notes near it. These can provide additional clarification for people less familiar with the process.
- Review and Refine: Always review your diagram once it's done. Check for logical flow, readability, and any potential areas of confusion. Get feedback from others who can provide a fresh perspective.
By adhering to these tips and tricks, you can create a photosynthesis process diagram that is visually appealing, clear, and effective in conveying the complex sequence of photosynthesis reactions.


