What is the Sequence Graphic Organizer?
A Sequence Graphic Organizer is a type of visual tool used to arrange and display the progression of events or steps in a linear format. This organizer helps students, writers, project managers, etc., to illustrate a series of events in the order in which they occur, demonstrating their relationship and flow.
Key Elements of a Sequence Graphic Organizer
Events or Steps: These are individual boxes or spaces that represent each action or occurrence in the sequence.
Arrows or Lines: These show the progression and direction of the sequence, linking the events together in chronological order.
Different Types of Sequence Graphic Organizers
Different types of sequence graphic organizers are suited for varying purposes. For example:
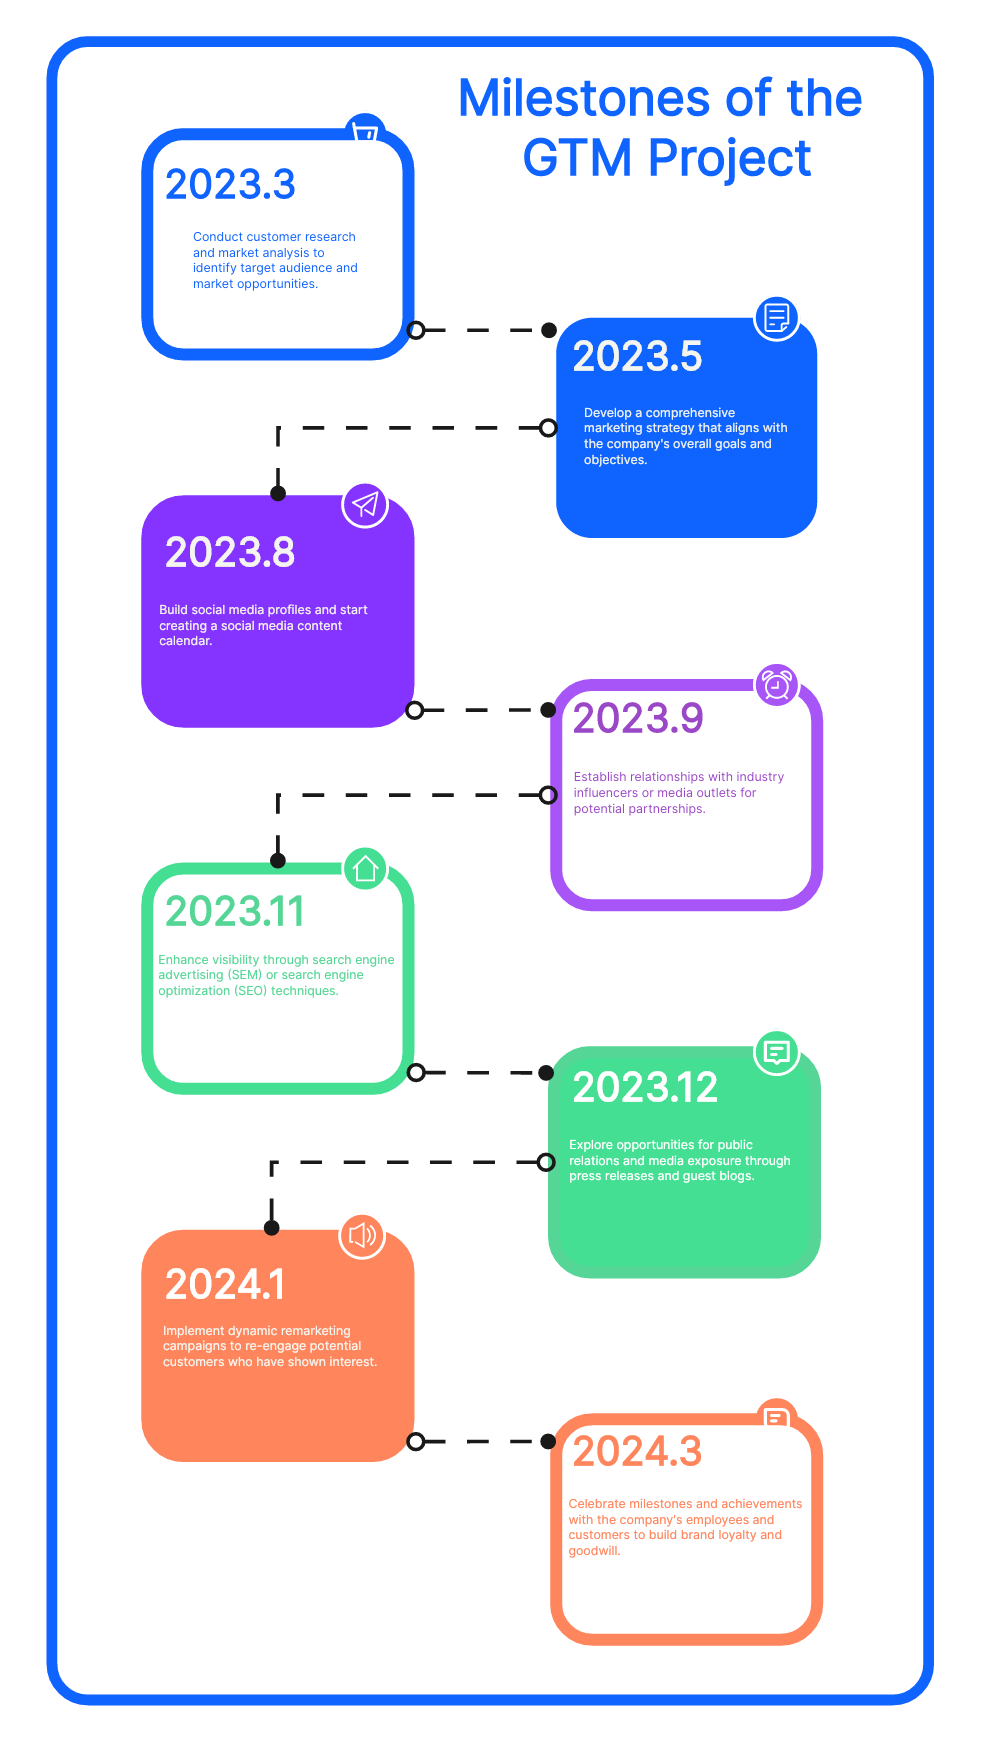
Timeline: A timeline represents a sequence of events in chronological order along a line. This format is particularly useful for visualizing historical events or stages of a project.
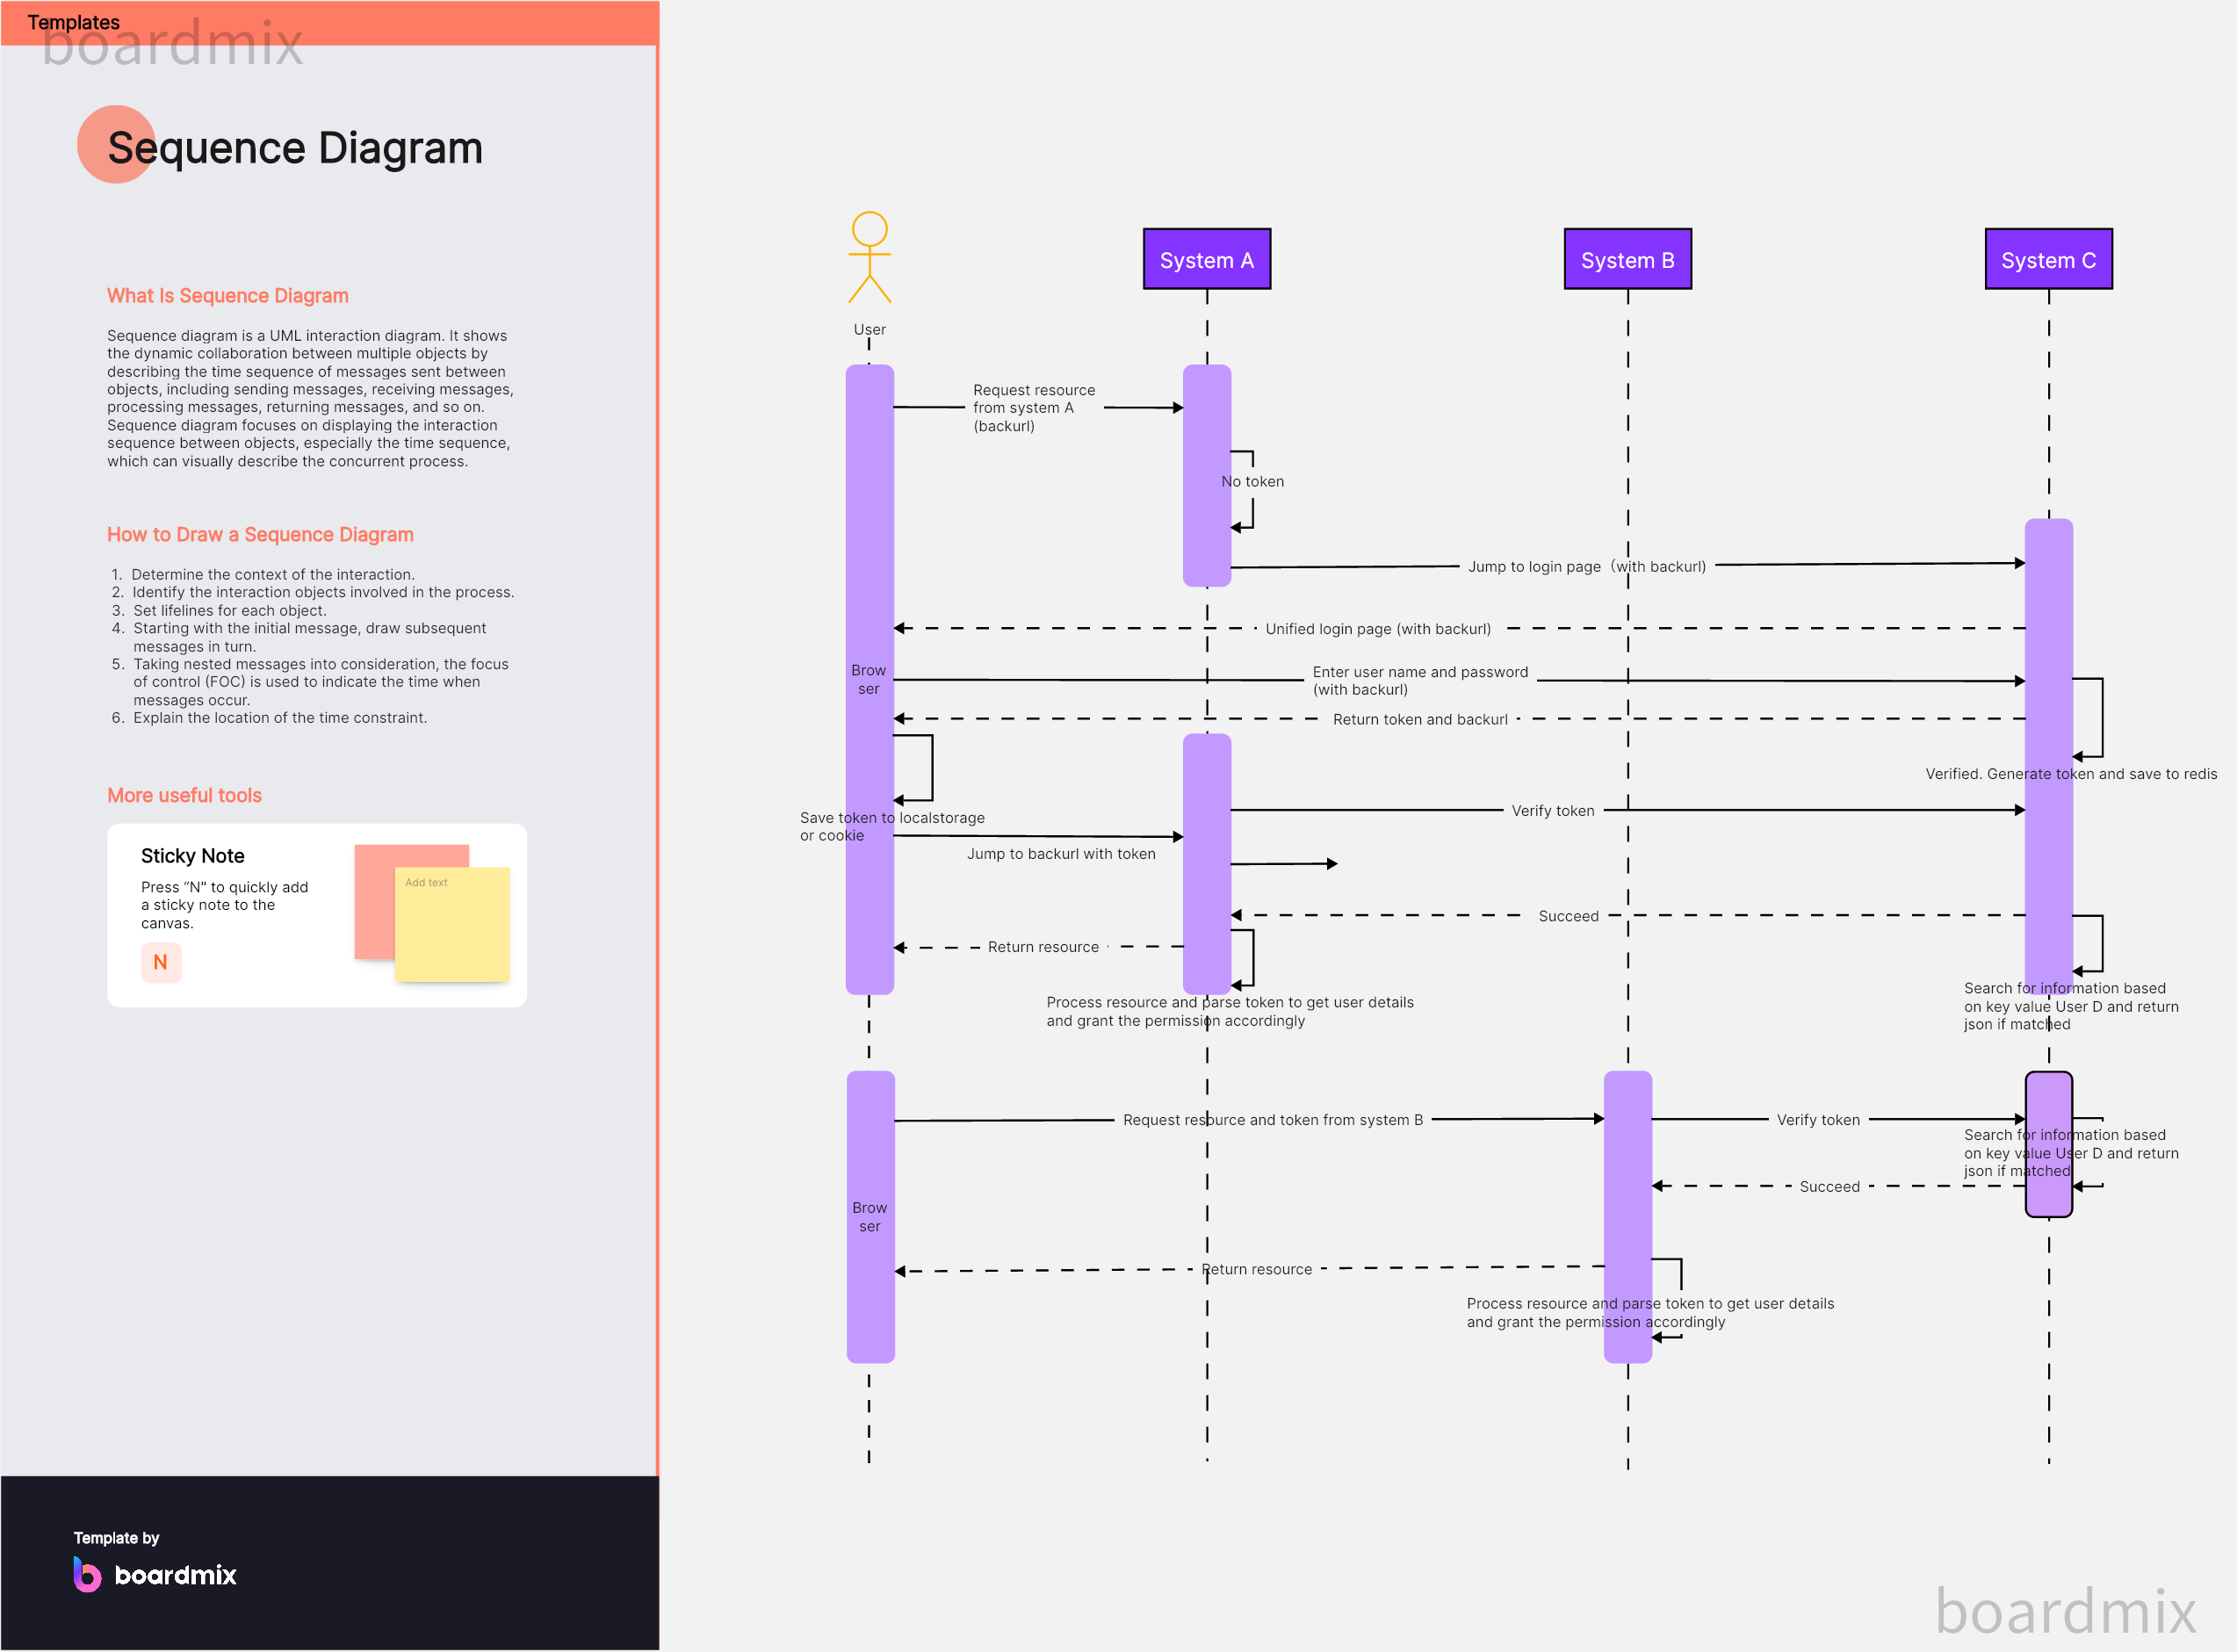
Flow Chart: A flowchart represents the step-by-step progression of a process or procedure. Each step is connected by arrows, illustrating the direction of workflow or actions.
Story Map: A story map outlines the sequence of events in a narrative, including the setting, characters, and plot elements. This type of organizer helps writers or students to plan and structure their stories.
The key to Create a Sequence Graphic Organizer
Creating a sequence graphic organizer involves several steps:
Identify the Sequence: Determine the sequence of events or steps you want to organize.
Create the Organizer: Draw a horizontal or vertical line on your paper or digital workspace. Add boxes or shapes along the line representing each event or step.
Label the Steps: Write down each step or event in its respective box, ensuring that they are placed in the correct sequential order.
Draw Connecting Arrows: Draw arrows from one step to the next, indicating progression.
In conclusion, sequence graphic organizers are practical tools for visualizing and comprehending sequential events or processes. By displaying steps in order, they provide clear guidelines and enhance understanding of temporal or procedural relationships.
Which graphic organizer is most fit for the sequence?
Determining the Most Appropriate Sequence Graphic Organizer
1. Timeline
If the sequence you are trying to illustrate involves historical events, life events, or the development of a concept over time, then a Timeline would be the most appropriate graphic organizer. The horizontal or vertical line in a timeline effectively illustrates chronological progress and can include dates, making it easier to visualize the sequence and timing of events.
2. Flow Chart
When illustrating a sequence of steps in a process or procedure, such as directions, a manufacturing process, or algorithm, a Flow Chart is typically the best choice. With its boxes and arrows, a flow chart can illustrate complex processes in a simplified manner, including decision points (usually represented by diamonds) that result in different paths.
3. Storyboard
In instances where you need to illustrate the sequence of events in a narrative or plot, a Storyboard is often the ideal graphic organizer. A storyboard breaks down the story into sequential scenes, allowing you to visualize how the narrative unfolds.
4. Cycle Diagram
For sequences that represent a cycle where the last step leads back to the first (like the water cycle, life cycle, etc.), a Cycle Diagram is usually most suitable. With its circular layout, it illustrates how each stage of a process leads to the next and ultimately back to the beginning.
In conclusion, the selection of the most suitable sequence graphic organizer heavily depends on the specific type of sequence you're attempting to illustrate. Each type of sequence organizer offers unique benefits suitable for different scenarios.
When to Use a Sequence Graphic Organizer Template?
1. To Depict Historical Events
If you need to present a series of historical events, a sequence graphic organizer can help visualize these in the order they happened. For example, a timeline graphic organizer can display the progression of wars, reigns of rulers, or eras.
2. For Educational Purposes
In educational settings, sequence graphic organizers are often used to help students understand the sequence of events in a story, the order of operations in math, or stages in a scientific process. They're also useful for teaching writing, as they can help students organize their thoughts and structure their narratives.
3. To Describe Workflows or Processes
Sequence graphic organizers like flow charts are ideal for describing business processes or workflows, as they clearly illustrate each step of a process and the order they should be carried out.
4. For Project Management
In project management, sequence graphic organizers can help to plan tasks, visualize the order of tasks, and illustrate dependencies between tasks. They're useful for both planning and tracking the progress of projects.
5. To Organize Information or Ideas
When you're dealing with a large amount of information or many ideas that have a particular order, sequence graphic organizers can be very helpful. They can be used to prioritize tasks, set agendas, or develop arguments.
6. For Personal Use
On a personal level, sequence graphic organizers can be used to plan daily schedules, make to-do lists, set personal goals, or plan events like parties or weddings.
In conclusion, graphic organizers for sequence are versatile tools that can be used whenever there's a need to visualize and understand the order of events or steps in a process.
Creating a Sequence Graphic Design in Boardmix: A Step-by-Step Guide
Boardmix is a popular and versatile tool for creating a free sequence graphic organizer template. Here is how to get an editable timeline graphic organizer example online with the Boardmix graphic design tool.
Step 1: Log in to Your Boardmix Account
First, navigate to the Boardmix website and log into your account. If you don’t have an account, you can sign up for free and then log in.

Step 2: Start a New Project
After logging in, go to your dashboard and click on 'New board'. You might be asked to choose a project type, you can create a new one if you want.

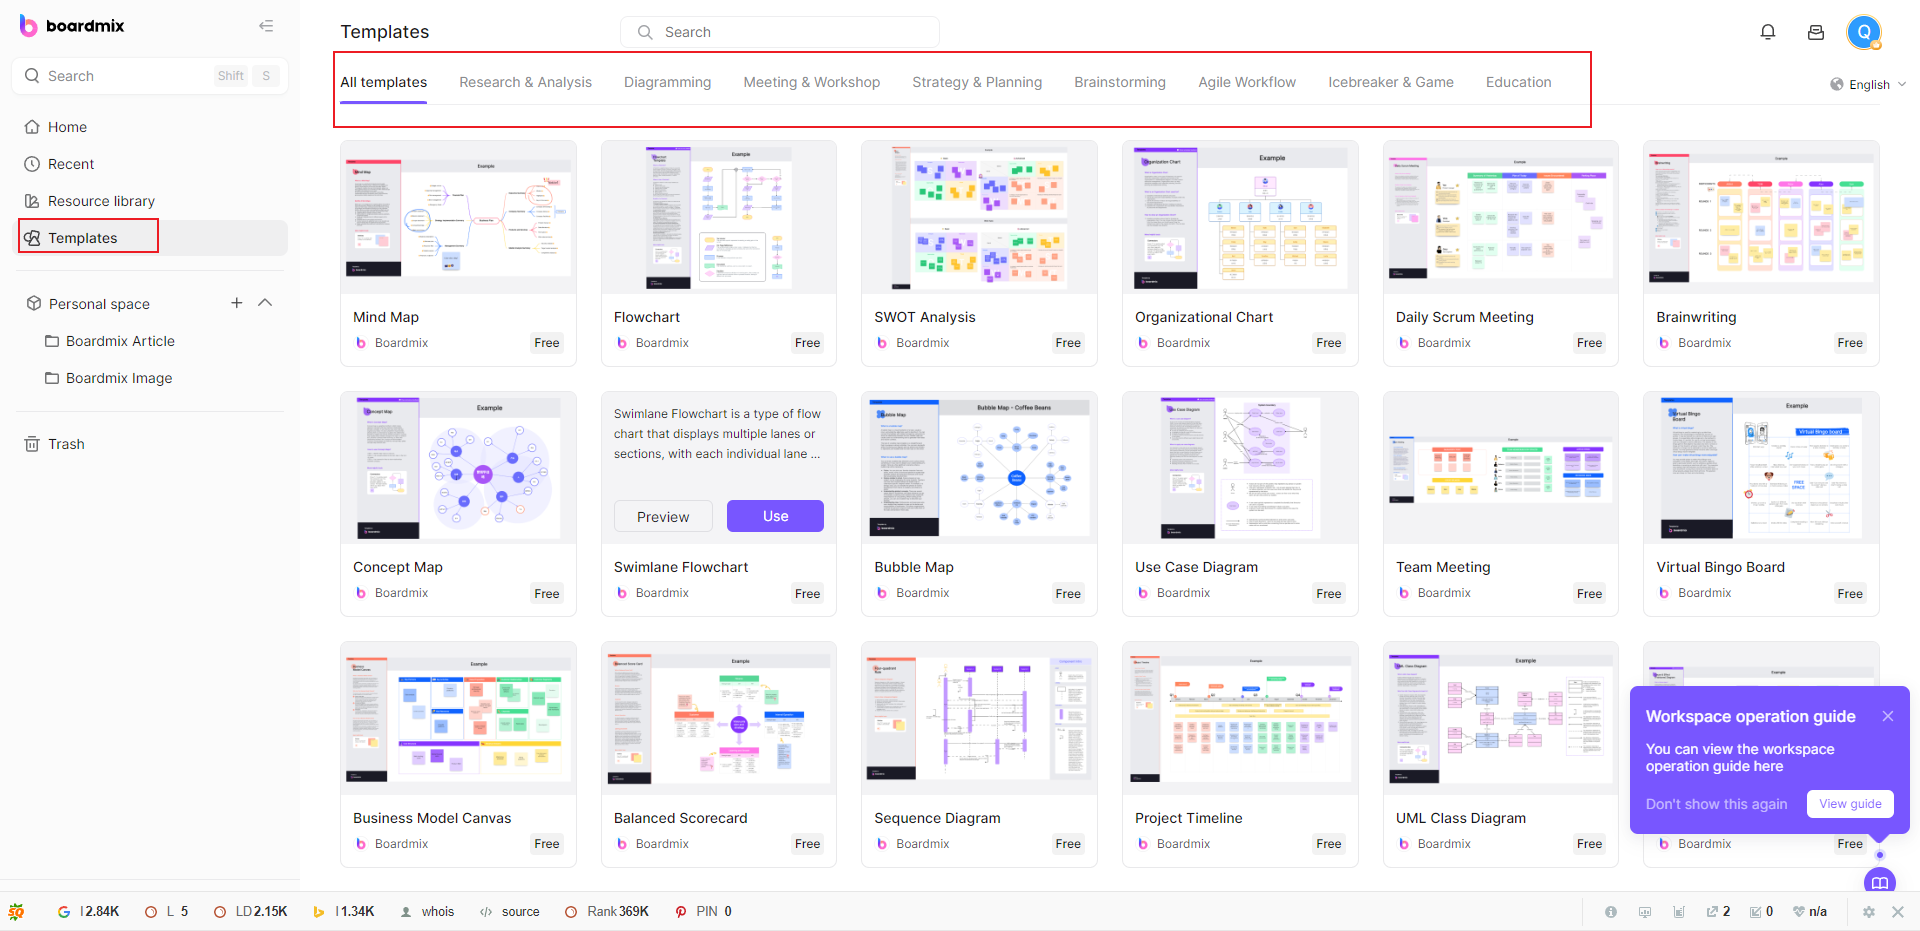
Step 3: Choose Your Template
Once your project opens, look for a 'Templates' tab or option. In the templates, find 'Sequence'. Select a template that best fits your sequence.
Step 4: Customize Your Template
You can now start customizing your template. Add your events or steps in each box or placeholder. Most online design tools allow you to simply click on the placeholder text to replace it with your own.
Step 5: Add or Remove Steps
Depending on the number of steps or events in your sequence, you may need to add or remove some boxes. Most tools have 'Add' and 'Delete' options you can use to modify your chart.
Step 6: Edit Text
Edit the text within each box to represent each step in your sequence. Make sure to write clearly and concisely for easy understanding.
Step 7: Customize Design
Adjust the fonts, colors, and other design elements as needed to create an attractive and easy-to-understand graphic. Some tools also allow you to add additional elements such as images or icons.
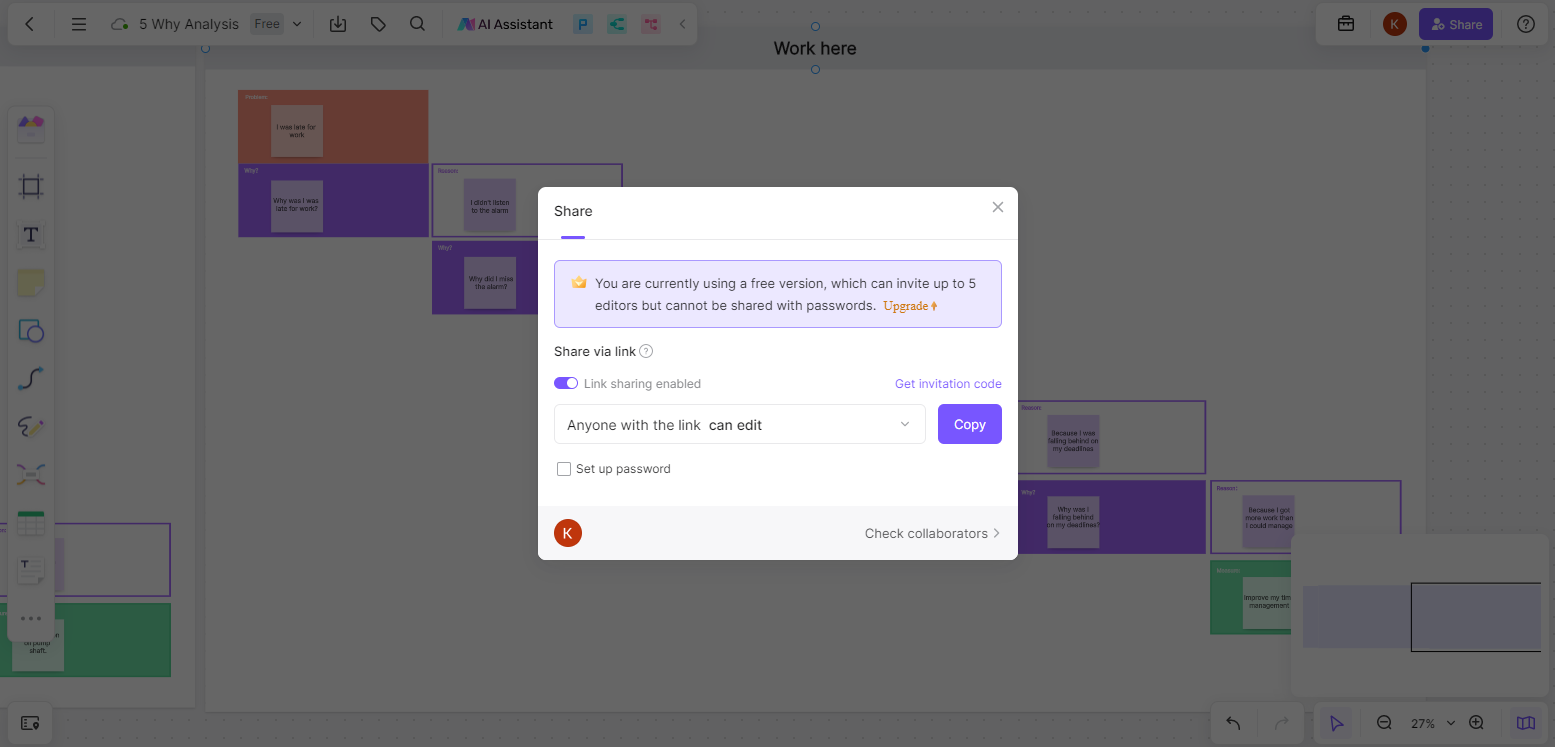
Step 8: Save and Share Your Graphic
Finally, save your graphic. Most tools have a 'Save' button located somewhere around the top or bottom of the screen. After saving, you can download your graphic, or share it directly from the tool to social media, email, or other platforms.
