Collaboration among teams is an ideal way to achieve organizational goals efficiently. But in reality, it is easier said than done. When multiple teams and departments are involved in one project, it can be a handful to manage who's doing what. A swimlane chart makes those responsibilities and handoffs visible. You can use the Boardmix flowchart maker to draw the steps in separate lanes and review where work passes between teams.
What is a swimlane diagram?
A swimlane diagram is a flowchart that illustrates who's responsible for specific parts of the process. It is called a swimlane as it adopts the concept of lanes in a swimming pool to represent duties and tasks within a group or entire organization.
You can arrange the swimlane flowchart horizontally or vertically. Since the responsibilities of specific processes are illustrated on the swimlane flowchart, it helps the team or organization communicate who performs each action and who receives the result.
History of swimlane diagrams
Swimlane diagrams are also called cross-functional flowcharts. The term Rummler-Brache diagram is associated with the work of Geary Rummler and Alan Brache. Their book is Improving Performance: How to Manage the White Space on the Organization Chart, which addresses processes that cross organizational boundaries.
Lane-based views also appear in Business Process Model and Notation (BPMN) and UML activity diagrams, although each notation has its own rules. A simple cross-functional flowchart need not use all of those symbols: its main purpose is to show the steps and the interactions between the people or teams responsible.
Benefits of using swimlane diagrams
Before diving more deeply into the concept of a swimlane diagram, look closely at the advantages the structure brings to your team's projects.
- The multiple lanes in the diagram allow you to indicate the responsibilities of every individual or department. This helps simplify complex processes within a company.
- Visualizing the processes through the swimlane framework can generate more detailed overviews of an employee's organizational roles. It helps the team look for redundancies, bottlenecks, and unnecessary steps. For example, if your swimlane flowchart shows that some departments send work to the finance department, bottlenecks in finance may affect those departments too. Understanding these handoffs helps you investigate where additional resources may be needed.
- They help you check whether all necessary parties and individuals are included. Everyone can review their role on the diagram and the relationships with other members of the department or organization.
- It helps standardize the work processes and store them in shareable formats where other members and stakeholders can easily refer back if necessary.
Attributes and elements of swimlane diagrams
There are two significant elements you will see in a swimlane diagram. They include the following:
- Lanes. Horizontal or vertical divisions separate the people, departments, or workgroups responsible for the steps. Label each lane with its owner.
- Process steps. They are generally spelled out within the specific lanes and are connected by arrows to show the relationship between processes and actors.
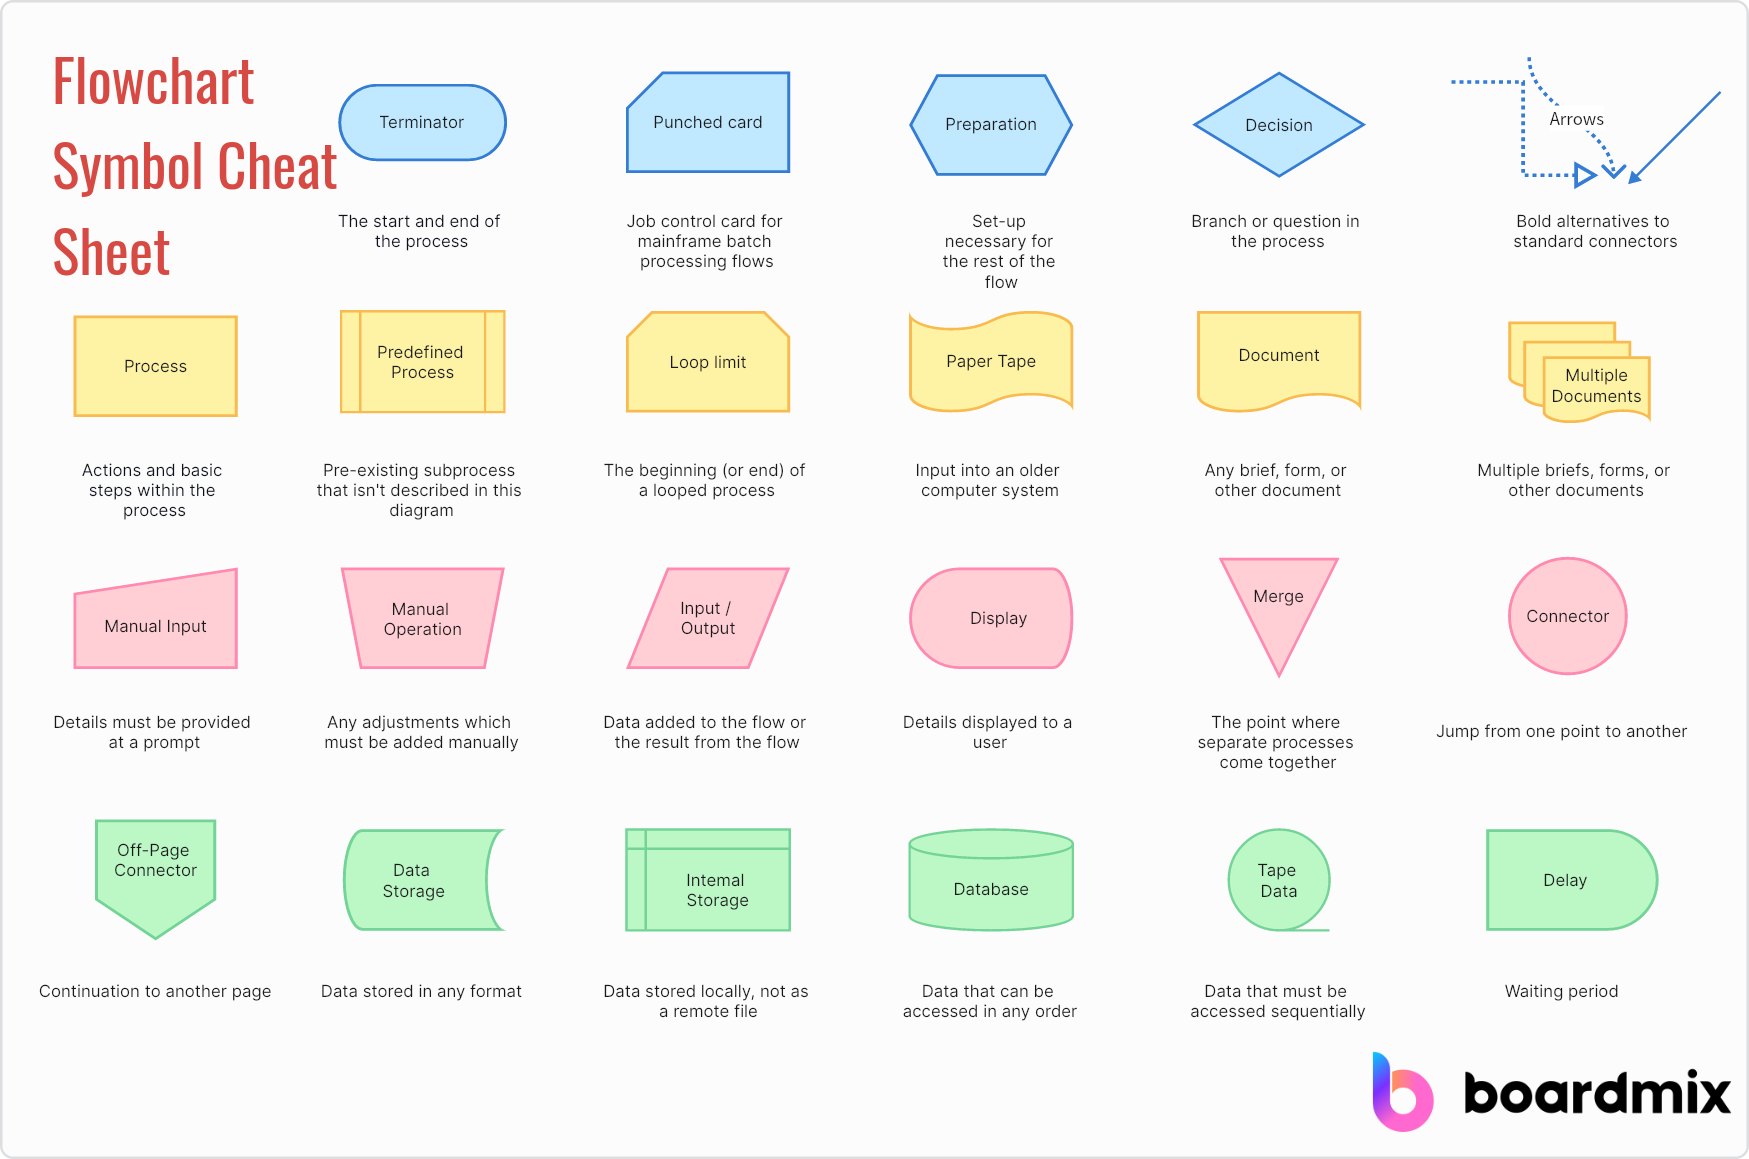
Also, expect to use flowchart symbols to represent the different elements and processes on your diagram. You should be familiar with the common symbols before constructing your swimlane flowchart.
- Start/End. This shows where the flow begins and ends. Use an oval or another clearly identified terminator shape.
- Process. This process can be writing an article, creating a schedule, or preparing the ingredients. Remember that you can create multiple processes depending on what is needed on your diagram. A rectangle represents this process.
- Document. If the process involves documents like order forms, receipts, or credit reports, use the rectangle shape with a wave on its bottom side.
- Decision. The diamond on your chart means a decision must be made to proceed with the process—for example, whether a credit check passed. Label its outgoing branches with the outcomes, such as Yes and No.
More complex processes may require additional symbols. Include a legend if their meaning is not obvious, and agree on the notation with the people who will use the diagram. An arrow crossing a lane boundary shows a handoff, not a change in job seniority.
How to create a swimlane diagram
- Identify the tools you need for the job. If it is for personal use, you can scribble the flowchart on paper if you are short on time. Meanwhile, for complex projects, you can utilize diagramming software. There are templates you can use for easy structuring.
- Specify the goal. Determine the team's ultimate goal in creating the flowchart. Consider the processes and details you must include to provide a comprehensive and concise objective.
- Break down the processes into separate tasks. Remember to keep an eye on the overall process and boundaries. You can list everything and refine it later on.
- Identify the lanes. You must figure out who is responsible for each step. Lane categories can include workgroups, participants, departments, and other stakeholders.
- Plot the processes. Place the sequential processes in the respective swimlanes and include the connections between the lanes. You can also add deadlines and the people responsible for the tasks.
- Analyze the diagram. Walk through a typical case and an exception, noting bottlenecks, redundancies, and gaps. Check that each decision has a labeled route for every relevant outcome.
- Get your team involved. Run through the flowchart with the responsible units and departments. All of them should be involved to help you see any process you have missed.
- Share your flowchart. Share a link with the people who need the diagram, using appropriate access permissions. Ask each owner to confirm the steps in their lane.
Tips and best practices for creating effective swimlane diagrams
You can consider some of the following points when creating your swimlane diagrams.
- Familiarize yourself with the flowchart symbols and elements. This does not mean you have to memorize all the symbols related to flowcharting. You only need to know the common ones needed for your diagram. There are four common symbols to remember: an oval to signify the start and end, rectangles for the processes, a diamond for a decision, and arrows to connect all the shapes.
- Know the processes and sub-processes. Identifying these can be tricky. Collaborating with your team to properly place these steps in the right lanes would be best.
- Assess and refine. You can invite the relevant teams to review the flowchart and identify if processes need revisions.
Swimlane diagram examples
Swimlane flowcharts can describe both simple workflows and processes with several approval steps. The following examples show how lane ownership and decision branches work together.
Manufacturing
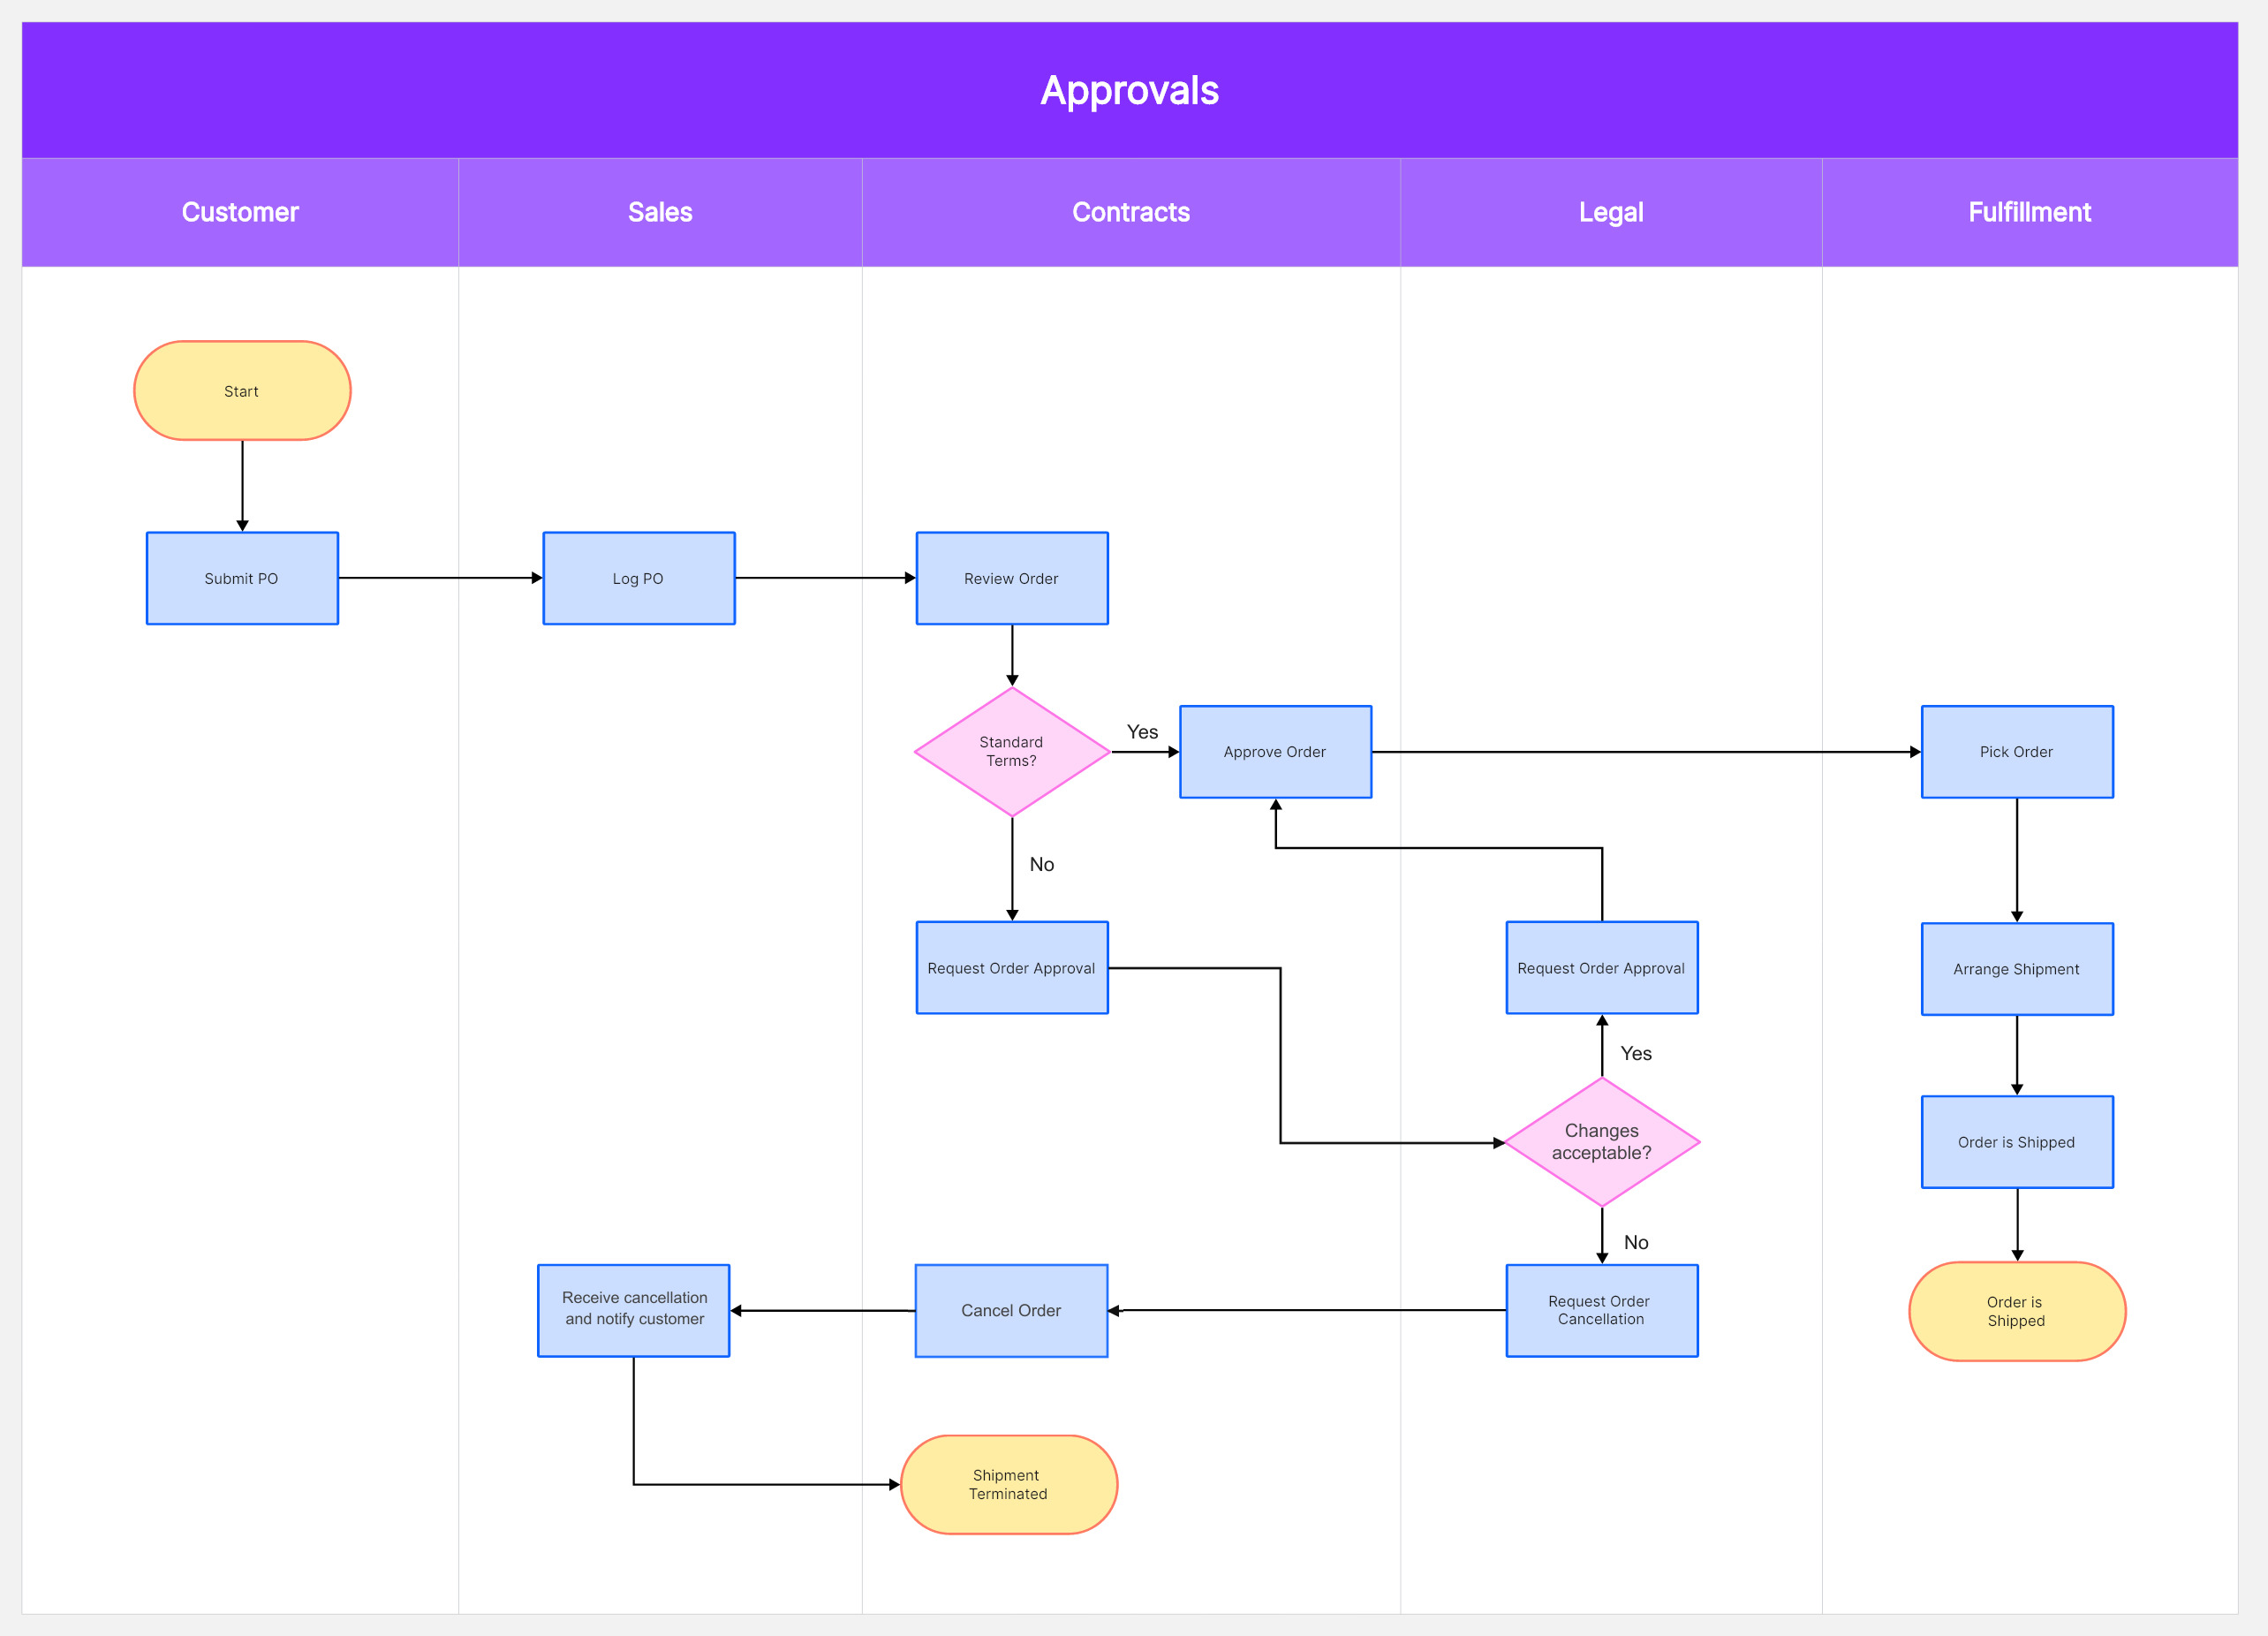
The first illustration uses Customer, Sales, Contracts, Legal, and Fulfillment lanes. The process starts with the customer submitting a purchase order, which Sales logs before Contracts reviews it. The order may proceed to shipment or be canceled after review.
Open the full-size manufacturing swimlane diagram
Follow the approval question rather than jumping straight to shipment. Standard terms can proceed to approval; non-standard terms need a route to Legal's review. Legal's answer must then return to the team responsible for approving or canceling the order. A request for approval without that connecting arrow leaves the next owner unclear.
For a rejected order, identify who sends the cancellation notice and where the process ends. For an accepted order, follow the handoff into Fulfillment for picking and shipping. The cancellation itself is an action, so it belongs in a process rectangle; the question that chooses cancellation or approval belongs in a decision diamond.
E-commerce industry
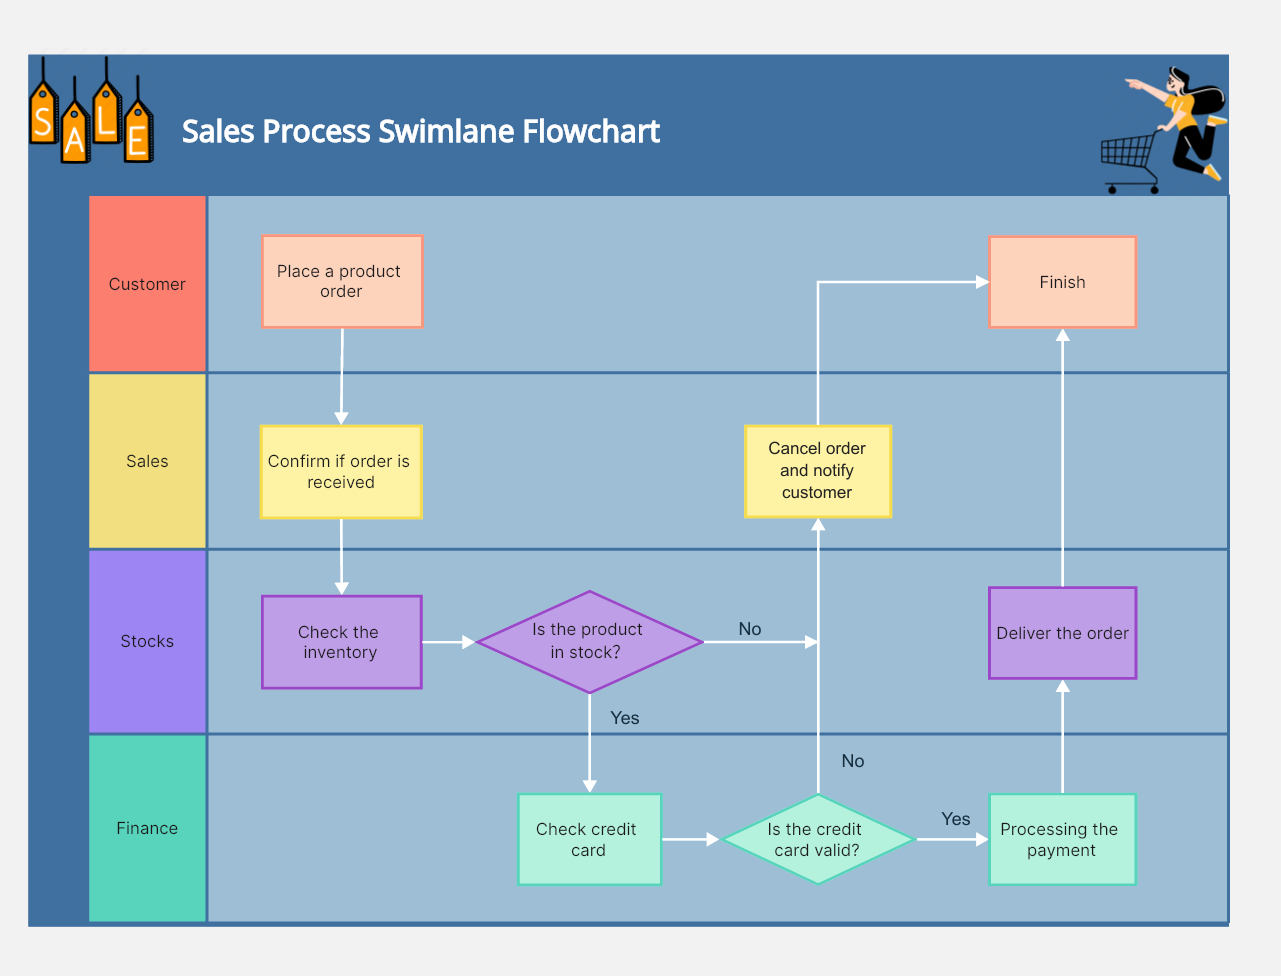
When you have an e-commerce business, this simpler illustration can provide a starting point. It uses Customer, Sales, Stocks, and Finance lanes. Colors help separate the work, but labels and arrows should make the sequence understandable without relying on color. Use connector styles consistently and explain any special meaning in a legend; the number of lanes depends on who actually owns the work.
Open the full-size sales-order swimlane diagram
The normal route starts with an order, continues through Sales confirmation and an inventory check, and then reaches Finance for credit-card validation. The illustrated Yes branch then processes the payment before delivery. At the inventory decision, an out-of-stock answer also needs an explicit route—for example, Sales notifies the customer and closes the order if this process does not support backorders.
The credit-card validation decision needs the same treatment. Label its Yes and No branches, assign ownership for notifying the customer about an invalid card, and connect cancellation to an end state. A useful review question is: “If this answer is No, who acts next?” It reveals missing handoffs that a diagram of only the successful route can hide.
Swimlane diagram FAQs
What is the purpose of the swimlane?
The following are some of the purposes of a swimlane diagram:
- It outlines processes from beginning to end by dividing them into specific sections. The rows or columns separate the responsible actors.
- The diagram lets you communicate and emphasize the processes and subprocesses assigned to a specific actor within the team or organization. This supports collaboration by making responsibilities visible.
- It helps people investigate inefficiencies such as duplicate steps, unclear handoffs, capacity constraints, and delays. The diagram shows where to look; actual timings and workload data are needed to confirm a bottleneck.
- You use the diagram to illustrate processes and account for evolving circumstances like technology changes or staffing.
- Companies use a swimlane flowchart to represent integrated processes among teams and departments visually, rather than showing each department in isolation.
What is the difference between a flowchart and a swimlane diagram?
A flowchart and a swimlane diagram are technically related. Essentially, a flowchart is a visualization tool to organize complex processes. It illustrates the sequences, steps, and decisions of a workflow. Within the flowchart are symbols that represent each step in the diagram. There are various types of flowcharts, and one of them is a swimlane diagram. It aims to outline who needs to do what within a given process.
The evident difference is the lanes used by the swimlane or cross-functional flowchart, inspired by the lanes of a swimming pool. An ordinary flowchart can show steps and decisions without dividing them by owner. These labeled divisions in a swimlane flowchart separate responsibilities and make cross-team handoffs visible.
Drawing and reviewing the handoffs in Boardmix
Start with a blank board or a suitable flowchart layout. Add one labeled lane per owner, place each action in its owner's lane, and connect the steps with arrows. For the sales-order example, put the inventory decision in Stocks and the credit-card validation decision in Finance. Keep the branch labels near the arrows so readers can follow each outcome.
Ask the people in those roles to trace one completed order and one rejected order on the board. If a handoff has no recipient, or cancellation has no notice or endpoint, correct that part before sharing the workflow with the wider team.