


A Venn diagram will remind most people of their time in school. This was a handy tool to compare and contrast specific data, like what pen was the most popular in class. You only need to draw some overlapping circles and have your diagram.
A Venn diagram is more than just a tool for fun. They can also represent complex ideas associated with probabilities and logic. The Venn diagram symbols you are familiar with are not just for creative purposes. The diagram can sometimes be a headache, especially when aligning circles and ensuring the texts fit accordingly.
More than that, mathematicians and other professionals also utilize the Venn diagram to solve mathematical problems and illustrate complex relationships. While you might not learn everything about Venn diagram symbols and the Venn diagram notation in one day, it still pays to have a background on how they look and their functions. Continue reading to learn more.
Click Here to Start a Free Venn Diagrama
Venn diagram symbols
To understand Venn diagram symbols, it pays to familiarize what a set theory is. While this might be a complex term, a set theory refers to understanding how various data are related. Generally, there are about thirty Venn diagram symbols, but the most important ones are discussed below.
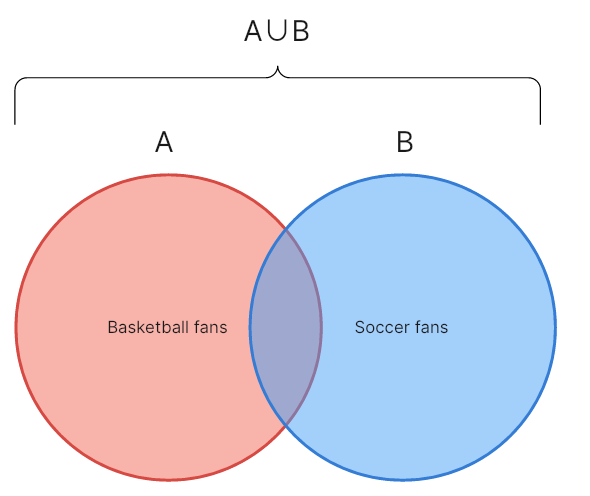
Union of two sets: ∪
This symbol in math refers to the union of two circles or sets. Looking at a two-circle Venn, you will see that the complete diagram shows A ∪ B, which means a set of all members and elements seen of A or B or both. In context, set A may represent people who are fans of basketball, while set B are fans of soccer. With this, A ∪ B can represent fans who love basketball, soccer, or both.
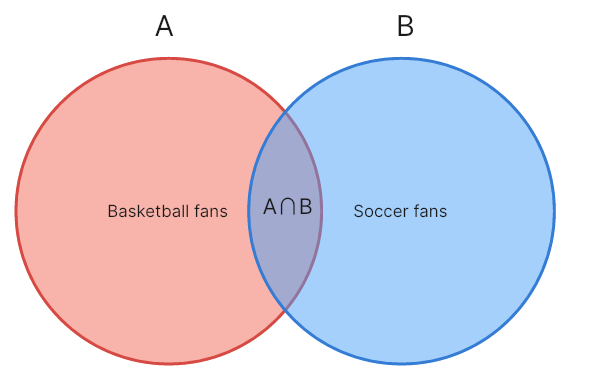
The intersection of two sets: ∩
This ∩ symbol in the Venn diagram refers to all elements, members, or characters common in both categories and sets. When you look at the chart, the intersection is the overlapped section between two circles. This means if category A represents basketball fans and category B is for soccer fans; A ∩ B comprises basketball and soccer fans.
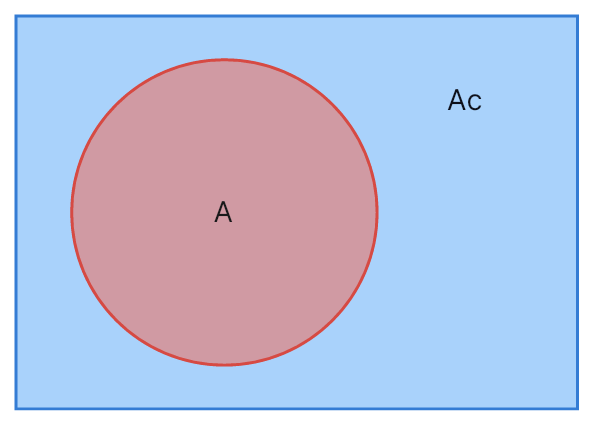
Complement of a set: Ac
If you want to represent elements not initially described in each set, all members not included in set A means the complement of the set and will have a symbol of Ac. These members are not present in set A but can be represented through a Venn diagram in circles.
Set notation
A Venn diagram set notation is primarily used in mathematics to define sets' types and properties. It uses a system of symbols to describe properties of elements in a given set and show relationships and operations among various sets.
Furthermore, the Venn diagram set notation has specific rules to describe a set. It utilizes braces or curly brackets { }, and the elements of the set are placed in these brackets. The set names are usually denoted by capitalized English letters.
A few of the examples of sets in a Venn diagram set notation include the following:
- N = refers to sets of natural numbers that are greater than or equal to 1
- {} = this set symbol is used to limit the set description
- ∈ = elements of a set
- ∉ = means ', not a member or an element of
- ⊂ = refers to a subset
- ⊄ = this symbol is used to denote a set symbol is not a subset
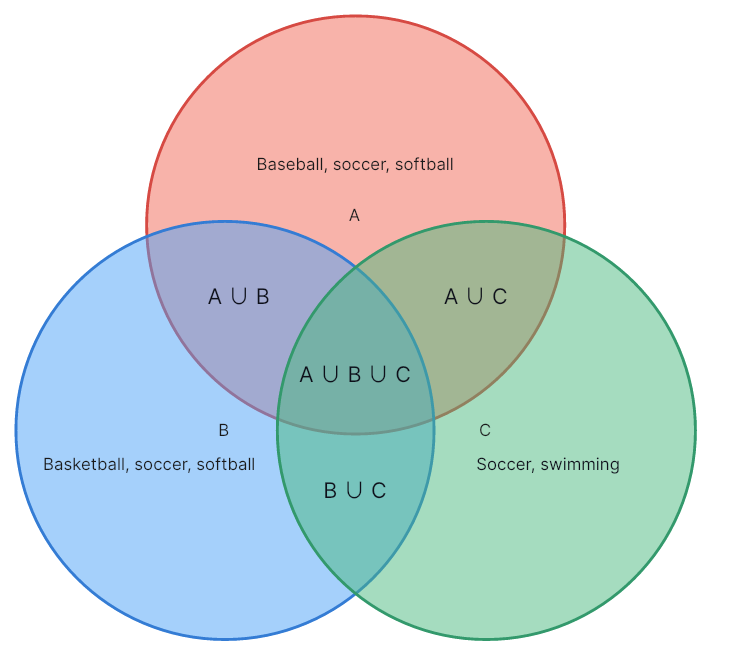
Three or more sets in a Venn diagram
A Venn diagram notation in three or more sets means three overlapping circles show the relationship between the elements of three sets. You can find various connections in a three-set Venn diagram notation.
The Venn diagram for A ∪ B depicts {Baseball, Soccer, Softball, Basketball}
Meanwhile, for A ∪ B ∪ C has {Baseball, Soccer, Softball, Basketball, Swimming}
Finally, the Venn diagram for A ∩ C has {soccer}
Further reading for Venn diagram symbols and set notation
Tips for creating Venn diagram symbols
It can be a handful to familiarize all these symbols and know where and when to use them. But the diagram is helpful in different fields as it helps organize information and represent relationships. With digitalization, you can conveniently develop your Venn diagram symbols online.
Refer to the following tips below on how to maximize customizable Venn diagram templates:
- It is essential to specify the primary goal of your Venn diagram. This serves as the base for the effective and efficient use of the chart. If you're with a team, brainstorm with all your members and understand the goal. It pays to have a statement of your objective before laying the details out on a virtual drawing board.
- For complex systems, it is beneficial to pick up your sample. Ensure you and your members think out of the box for better observation and analysis. You must understand the differences between arguments, choices, observations, or decisions.
- After the groundwork is set, it's time to choose your Venn diagram style. There are various designs from Boardmix's template center. They are generally pre-designed charts, so all you need to do is to fill in the circles to develop your diagram. Choose a blank page and customize the structure if you prefer to create your own.
Venn diagram fields of application
- Set theory. This has been discussed in the early chapters of the article. The set theory refers to the branch of Mathematics where concepts like intersection, complements, and unions are found. The branch deals with complex problems solved through Venn diagrams.
- Statistics and probability. Within this field, a Venn diagram is mainly linked to predictive analysis. Most people in statistics and probability work with predicting the likelihood of a specific event occurring.
- While most would associate Venn diagram symbols with Math, they are also helpful in linguistics. The chart can show the relationships between various languages.
- Venn diagram symbols are also helpful in assessing the validity of specific arguments and conclusions. The diagram is also essential in logical statements like all/some/no, and if/then.
- Teachers use Venn diagrams to assist a student's reading comprehension. With a clear visual illustration provided by the chart, learners can understand ideas better and concisely explain the differences and similarities between elements.
- Financial analysts adopt the process of creating Venn diagrams during presentations to clients, suppliers, and investors. Companies can also use them to present relationships in techniques, products, designs, and ideas.
Should I use a Venn diagram?
The benefits of using Venn diagrams are endless. The following are a few scenarios when you should use a Venn diagram.
- Visually organization different information
- Compare two or more choices
- Solve mathematical problems
- Comparing data sets
- Providing reasons through the logic
Along the way, people will likely have to develop their diagrams to establish and show relationships, similarities, and differences between specific topics or elements. Furthermore, the diagram's level of complexity varies. This means you may deal with not just three circles in one diagram but more than or higher. But with the right tools, you will get the hang of it.


