


Data visualization is an integral part of modern business operations, used to understand complex datasets, extract insights, and communicate these findings effectively. Bubble Charts are one such tool that presents data in an engaging and informative way. This guide explores what bubble charts are, why you might use a bubble chart maker, what features to look for in a bubble chart creator and 10 top-notch bubble chart makers. Let’s dive in.
What Is a Bubble Chart
A bubble chart is a multi-dimensional data visualization tool that displays three or more sets of variables on a single chart. It's an extension of the scatter plot where each data point is represented by a bubble. The X and Y coordinates represent two dimensions, while the size and color of the bubbles represent the third and optional fourth dimension, respectively. By presenting multiple layers of data simultaneously, Bubble Charts offer a comprehensive view of complex datasets.

Why Use a Bubble Chart Maker
Bubble chart makers streamline the process of creating detailed and aesthetically pleasing Bubble Charts. Here are a few reasons why you might want to use one:
- Efficiency: Bubble Chart Makers automate much of the chart creation process, reducing manual work and saving time.
- Ease of Use: With an intuitive interface, these tools enable users to create charts with little to no coding or design skills.
- Customizability: Bubble Chart Makers offer numerous customization options, allowing users to adjust colors, bubble sizes, labels, and more to enhance readability and aesthetic appeal.
- Interactivity: Many tools provide interactive features, enabling viewers to interact with the chart for a better understanding of the data.
What to Look for in a Bubble Chart Creator
When choosing a bubble chart creator, several factors should be considered to ensure you select the tool best suited for your needs:
- Data Input Options: The tool should support different ways of inputting data, such as manual input or importing data from various file formats.
- Customization Capabilities: The ability to customize the chart’s design elements like colors, sizes, labels, etc., can help in creating visually appealing charts.
- Ease of Use: An intuitive interface and step-by-step guide can make the chart creation process smoother, especially for beginners.
- Collaboration Features: Look for a tool that allows for collaboration. This is particularly useful when working in teams where sharing and editing rights may be necessary.
- Export Options: A good bubble chart creator will provide export options in multiple formats (PNG, JPG, SVG), enabling users to share their charts easily across different platforms.
Bubble charts are powerful data visualization tools that allow users to make sense of complex datasets. Using a bubble chart maker simplifies this process significantly, but it's crucial to choose a tool that aligns with your specific requirements to get the most out of your data visualization efforts.
Top 10 Bubble Chart Makers for Better Data Visualization
Data visualization tools are instrumental in translating complex data into understandable, visual narratives. Among these tools, bubble chart makers stand out for their ability to display multiple dimensions of data in an intuitive, interactive format. Here's a list of the top 10 Bubble Chart makers to enhance your data visualization.
Boardmix
Boardmix tops our list of bubble chart makers due to its combination of functionality and user-friendly design. Apart from creating bubble charts, Boardmix is a collaboration tool that offers project management features. It allows for importing data directly from various file formats or manual data entry. Its customizable charts, secure data handling, and collaborative features make it a robust choice for businesses and individuals alike.

Tableau
Tableau is a professional-grade data visualization tool that's capable of creating dynamic and interactive bubble charts. It provides robust customization options and support for large datasets. Its advanced analytical capabilities allow for creating detailed and informative charts.

Microsoft Excel
Excel, a staple in most offices, comes with a built-in bubble chart function. Although it may lack advanced customization features found in dedicated chart makers, its familiarity and integration with other Microsoft Office tools make it a convenient choice for many users.
D3.js
For those comfortable with programming, D3.js is a JavaScript library that provides extensive control over chart design and interactivity. Although it has a steeper learning curve, the resulting bubble charts can be truly unique and engaging.
Google Charts
Google Charts is a free, web-based tool that integrates seamlessly with other Google services. Its bubble chart function is easy to use and can create responsive charts that are easily shared or embedded into web pages.
Plotly
Plotly is another powerful option for creating bubble charts. It supports numerous programming languages like Python, R, and JavaScript, offering great flexibility. Its interactive charts can be embedded into web applications, making it an ideal choice for developers.
QlikView
QlikView's associative model enables users to create bubble charts that reveal relationships among data from various sources. Its dynamic updating feature makes it especially useful for visualizing real-time data.

Highcharts
Highcharts is a JavaScript charting library that allows for the creation of interactive charts like bubble charts. With comprehensive API documentation, it's a developer-friendly tool offering many customization options.
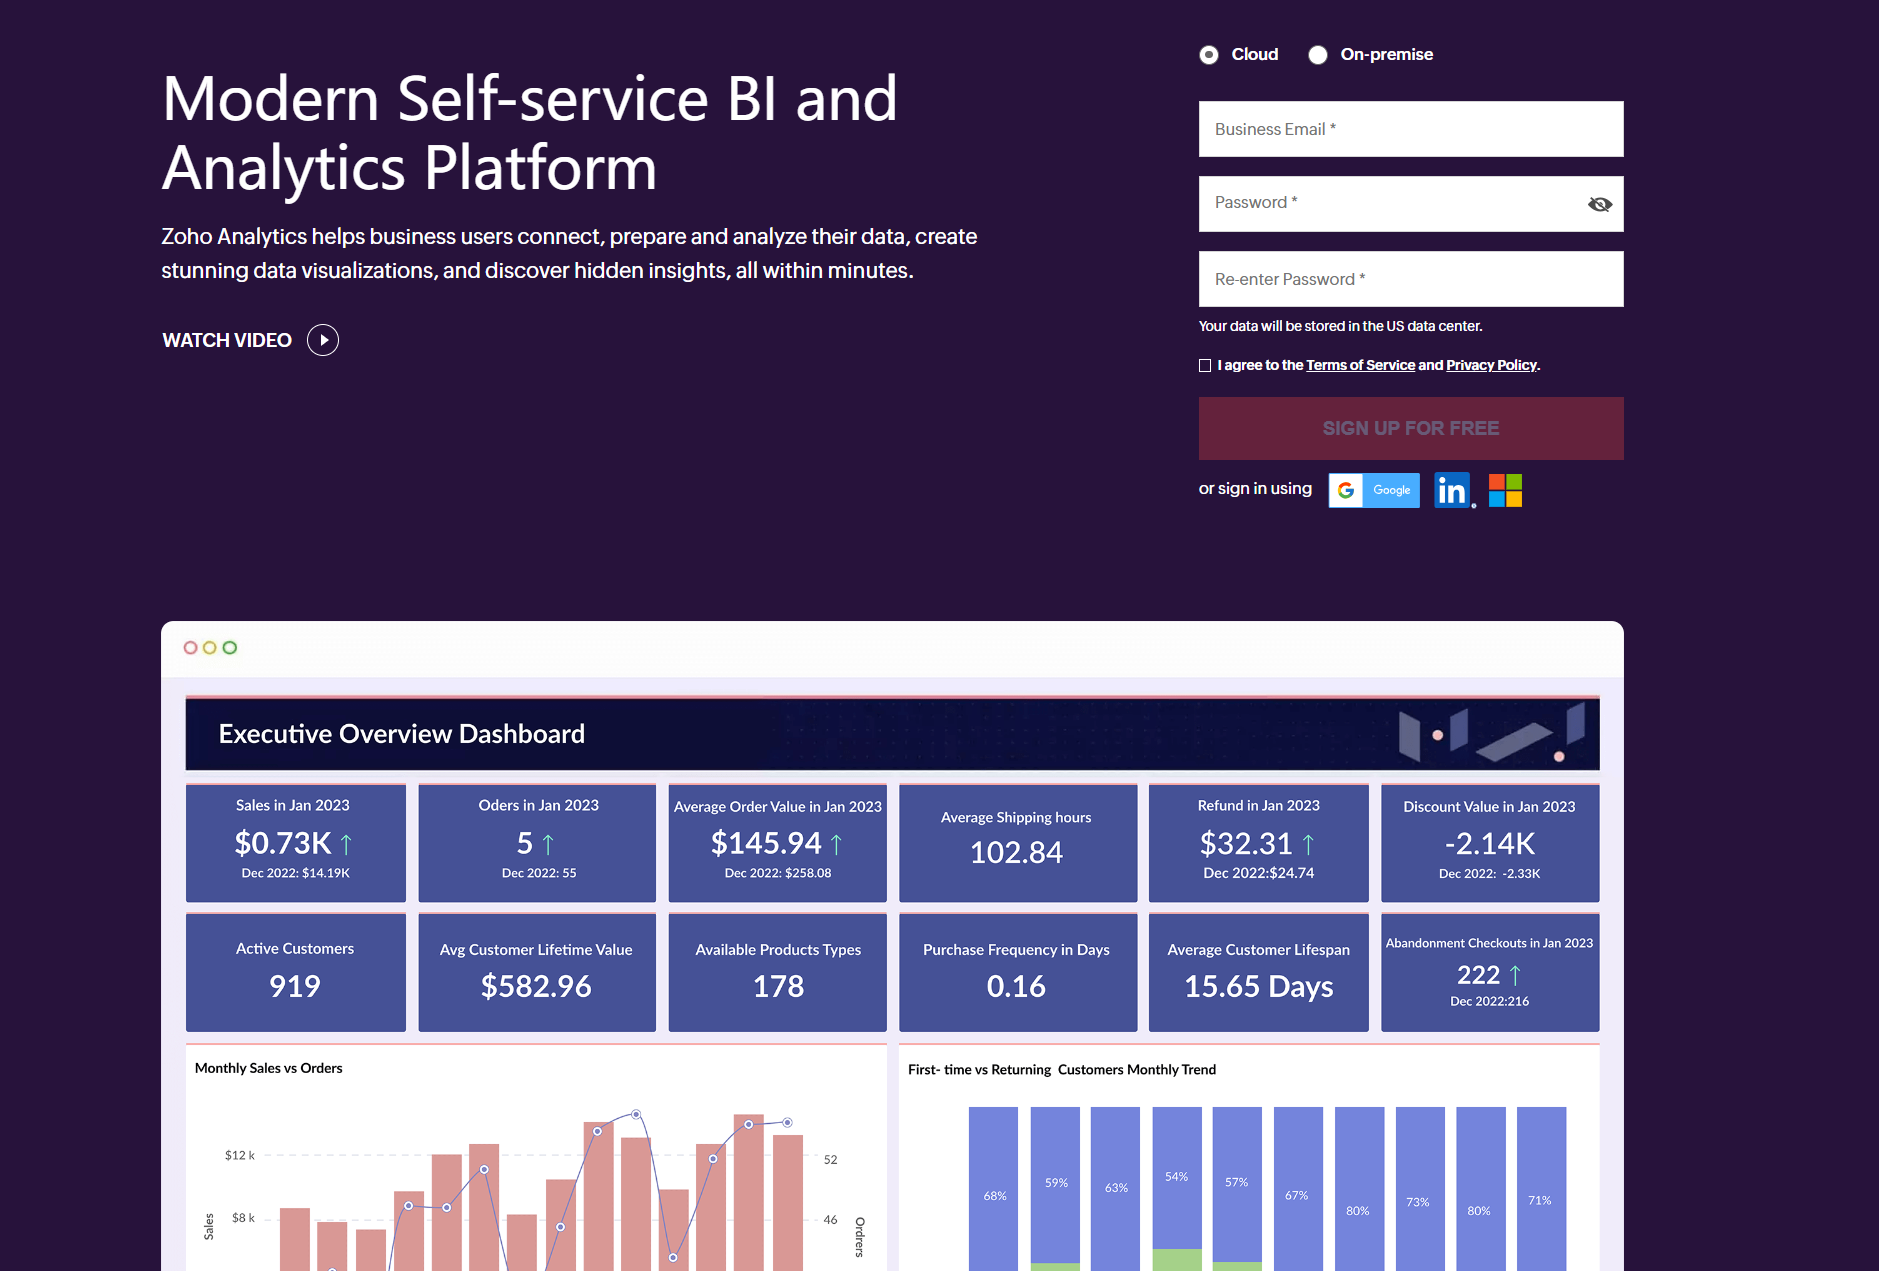
Zoho Analytics
Zoho Analytics provides a range of chart options including bubble charts. Its drag-and-drop interface simplifies chart creation, while features like drill-down and interactive legends enhance the viewer's experience.
AnyChart
AnyChart offers a vast array of chart types including bubble charts. It supports massive datasets and allows for interactivity in its charts. It's compatible with numerous platforms and programming languages, making it a versatile choice.
These bubble chart makers have their strengths and cater to different user needs. Whether you're a beginner or an advanced user seeking detailed customization, there's a tool out there for you. Among them, Boardmix provides a wide range of capabilities for a visualized data presentation. Just try it out now!


