


In today's visually-driven world, effective communication often hinges on engaging and informative visuals. Circle diagrams, commonly referred to as circle charts or round charts, offer a versatile and powerful way to present data and concepts in a clear and compelling manner. Whether you are a student, professional, or presenter, learning how to create impactful circle diagrams in PowerPoint can elevate your presentations to the next level.
What Is a Circle Diagram
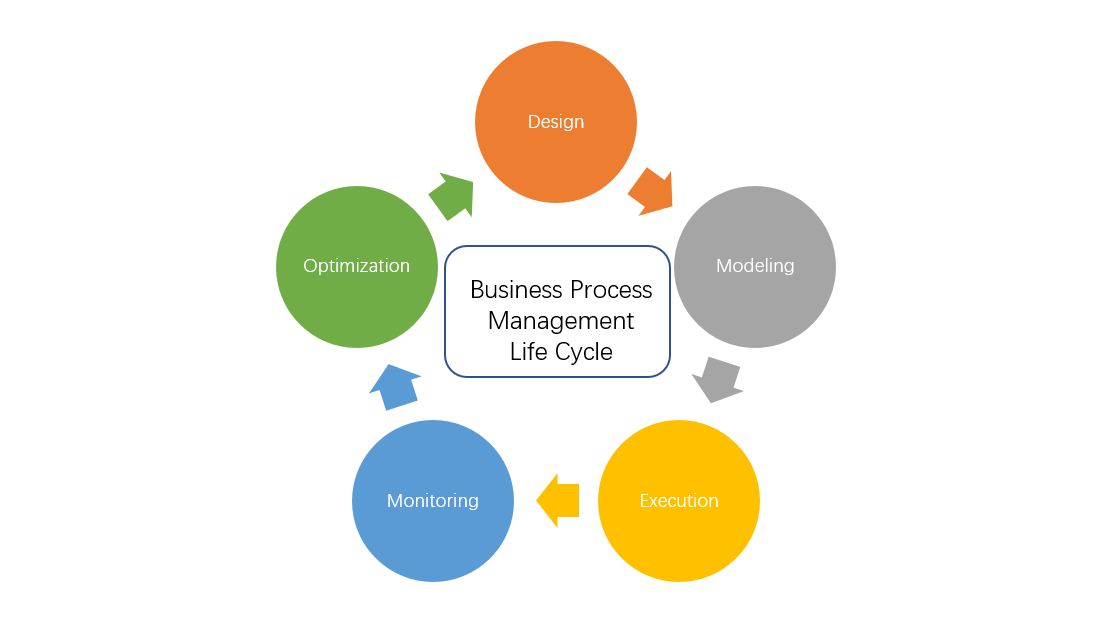
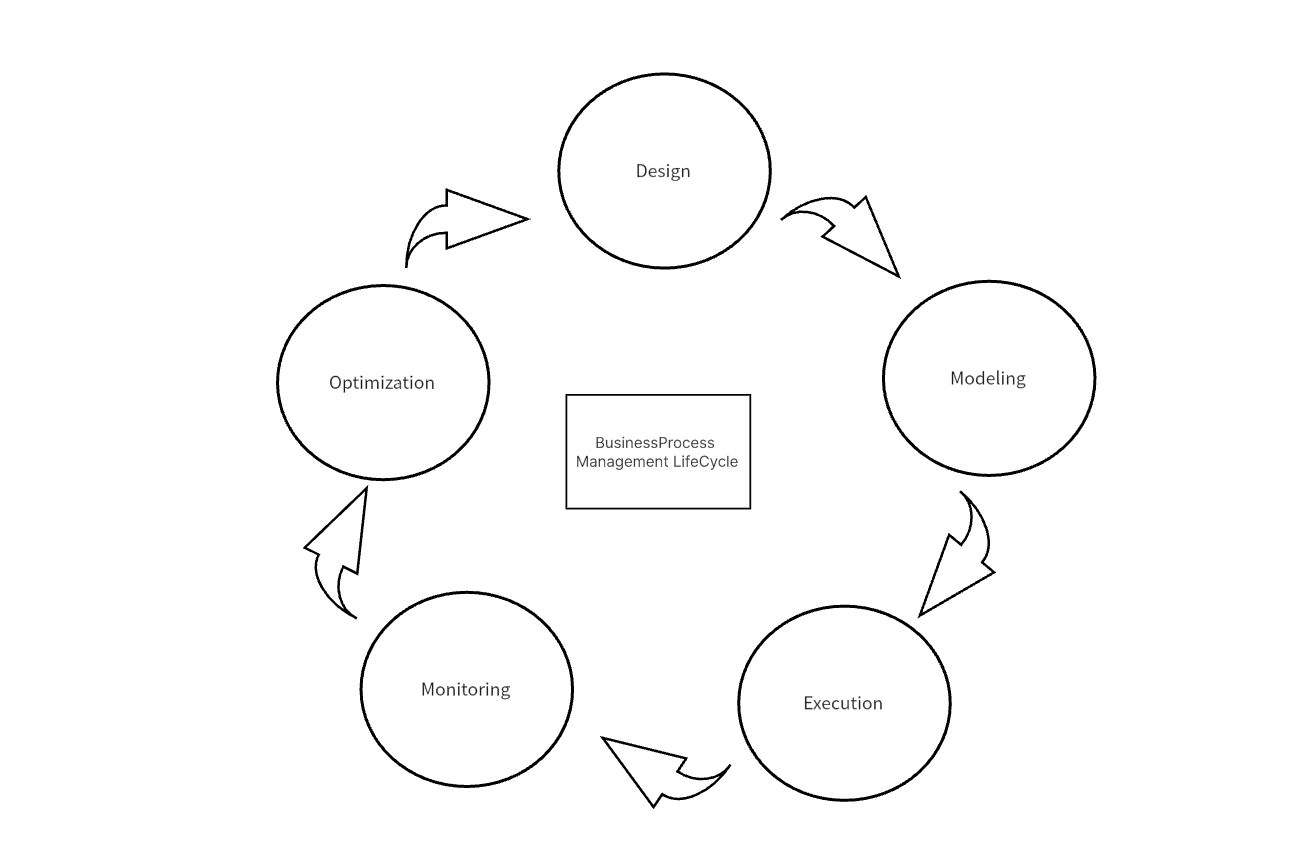
A circle diagram is a visual representation that divides a circle into sectors, each representing a specific category, data point, or concept. This graphical tool provides a simplified yet effective way to communicate proportions, relationships, and distributions. The size of each sector corresponds to the significance or weightage of the represented category, allowing viewers to comprehend complex information at a glance. Circle diagrams are widely used in various fields, including business, marketing, education, and data analytics, to convey information in a visually appealing and memorable way.
How to Create a Circle Diagram for PowerPoint
Creating a circle diagram in PowerPoint is a straightforward process that can be accomplished in a few simple steps.
1. Launch PowerPoint and open a new slide.
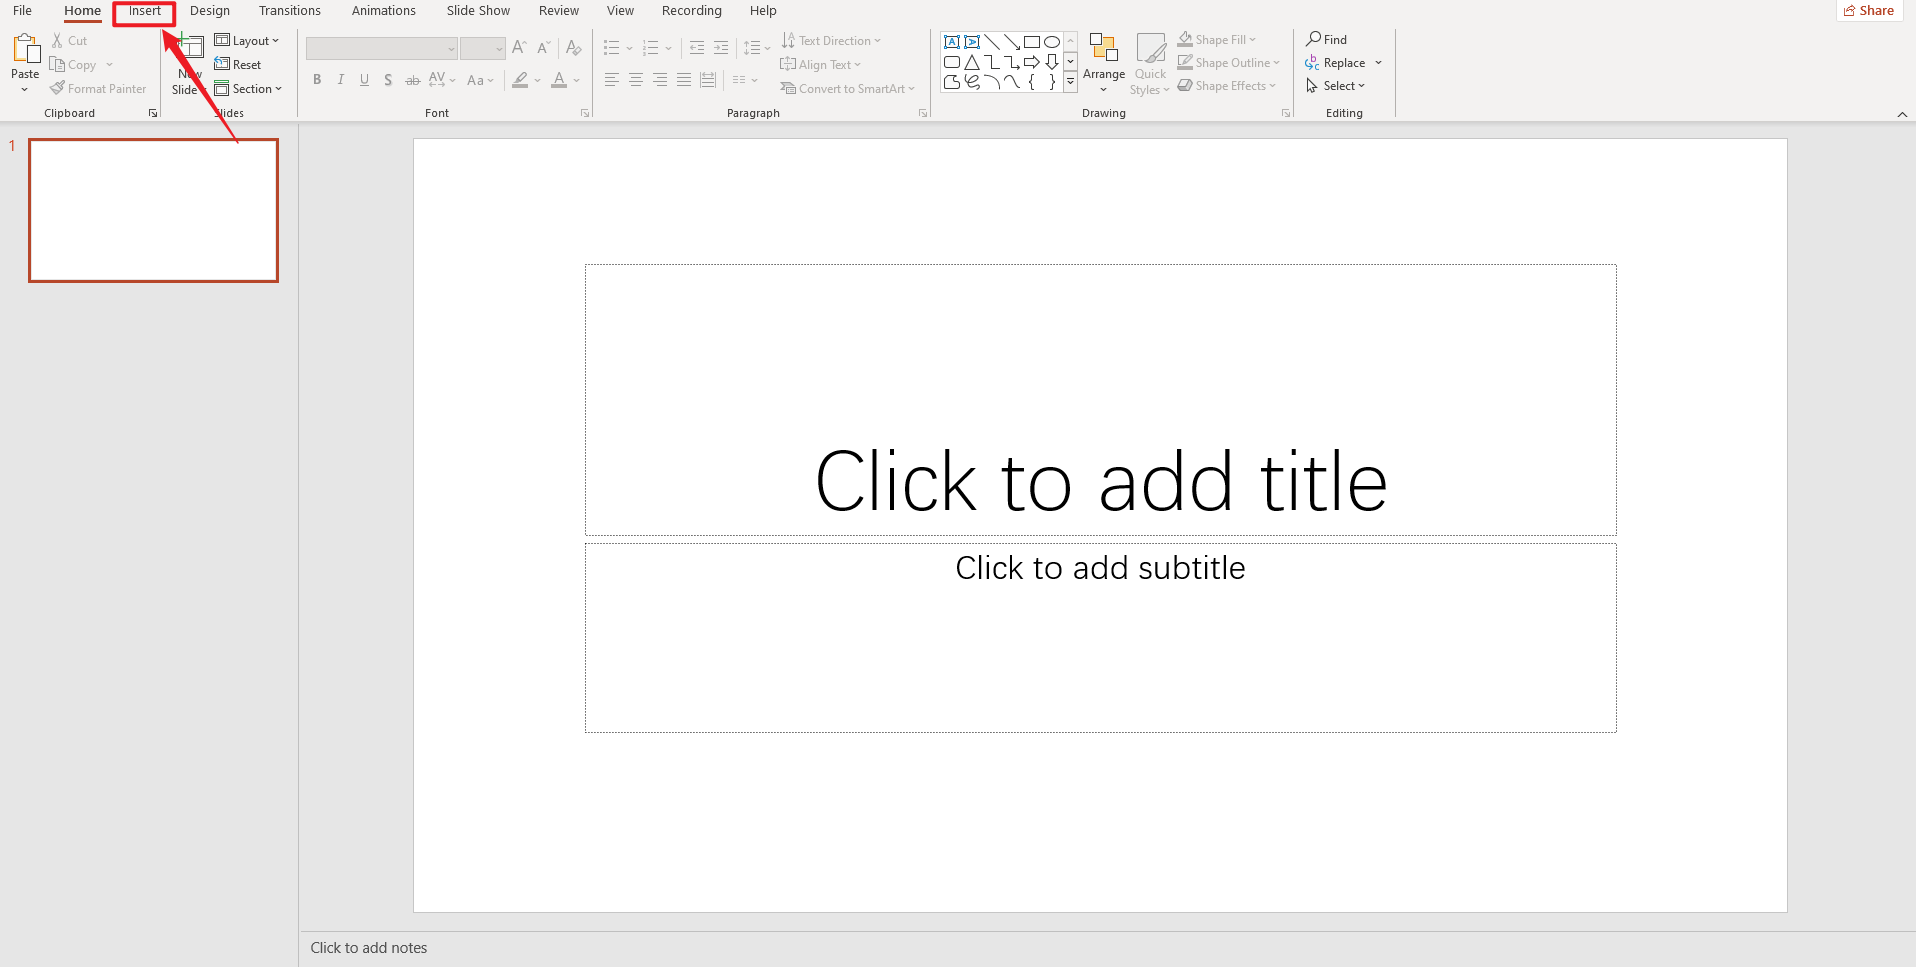
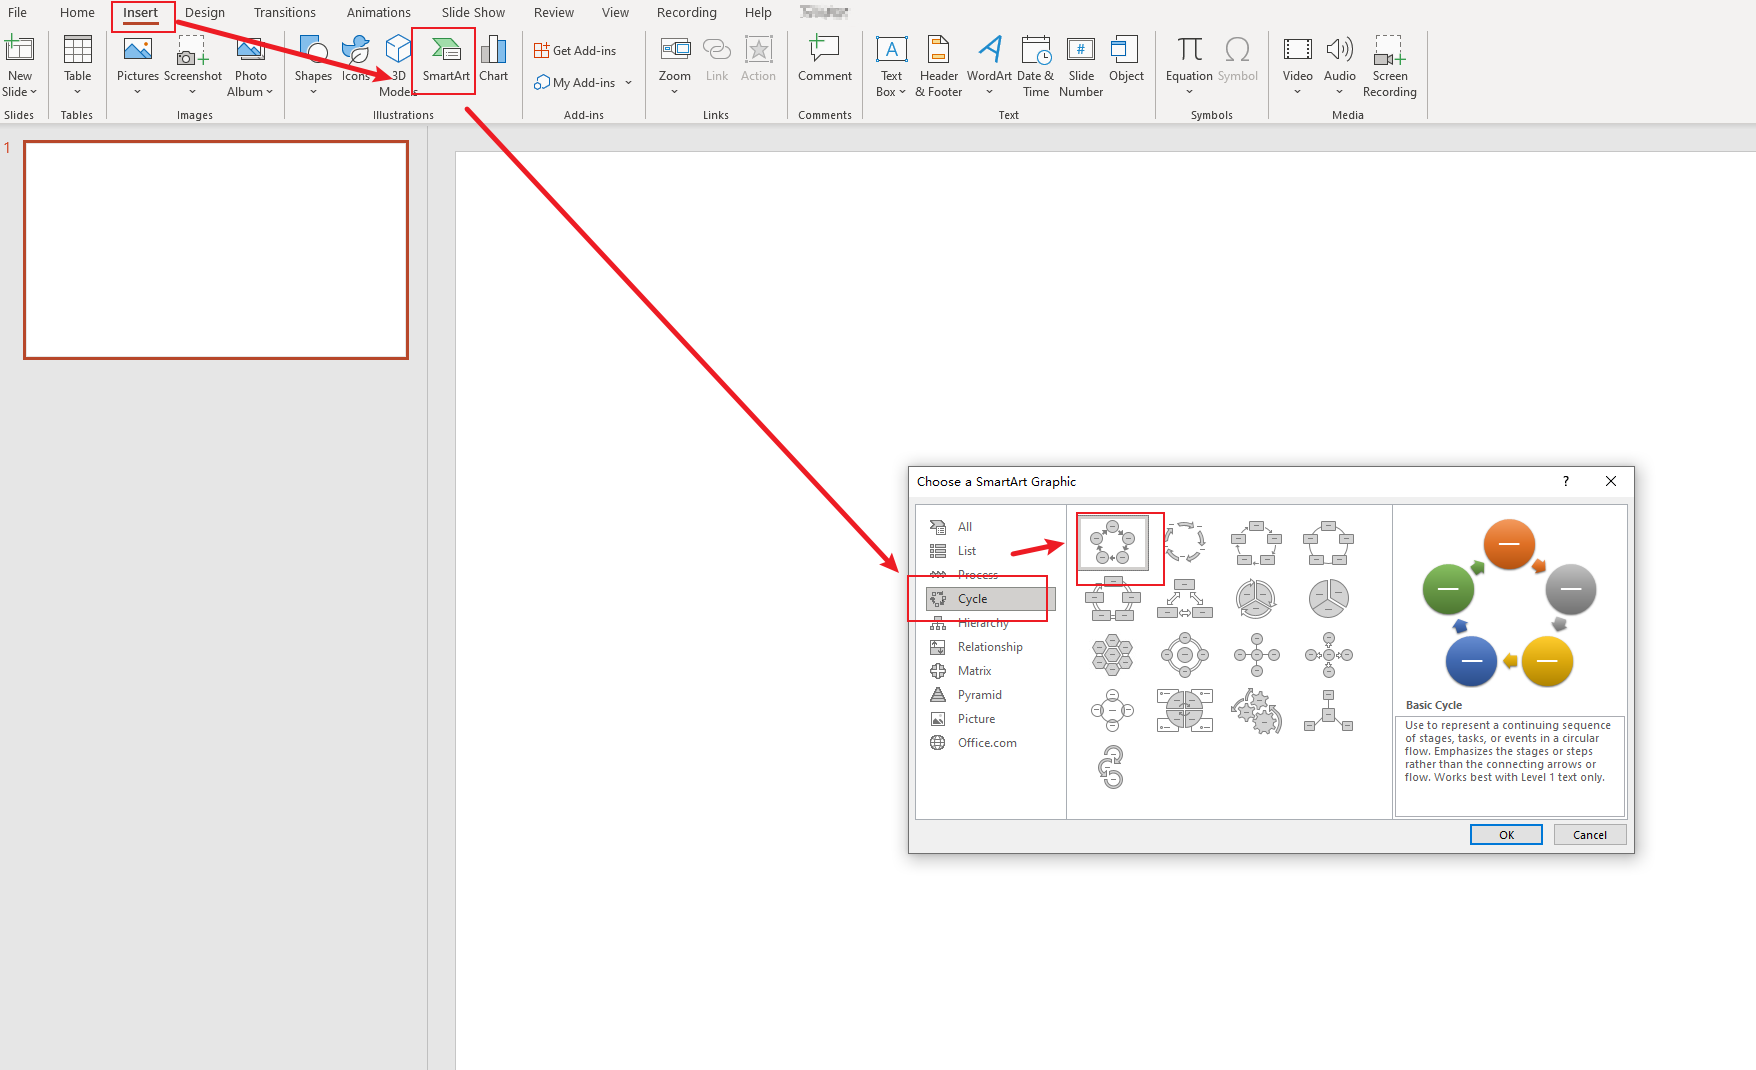
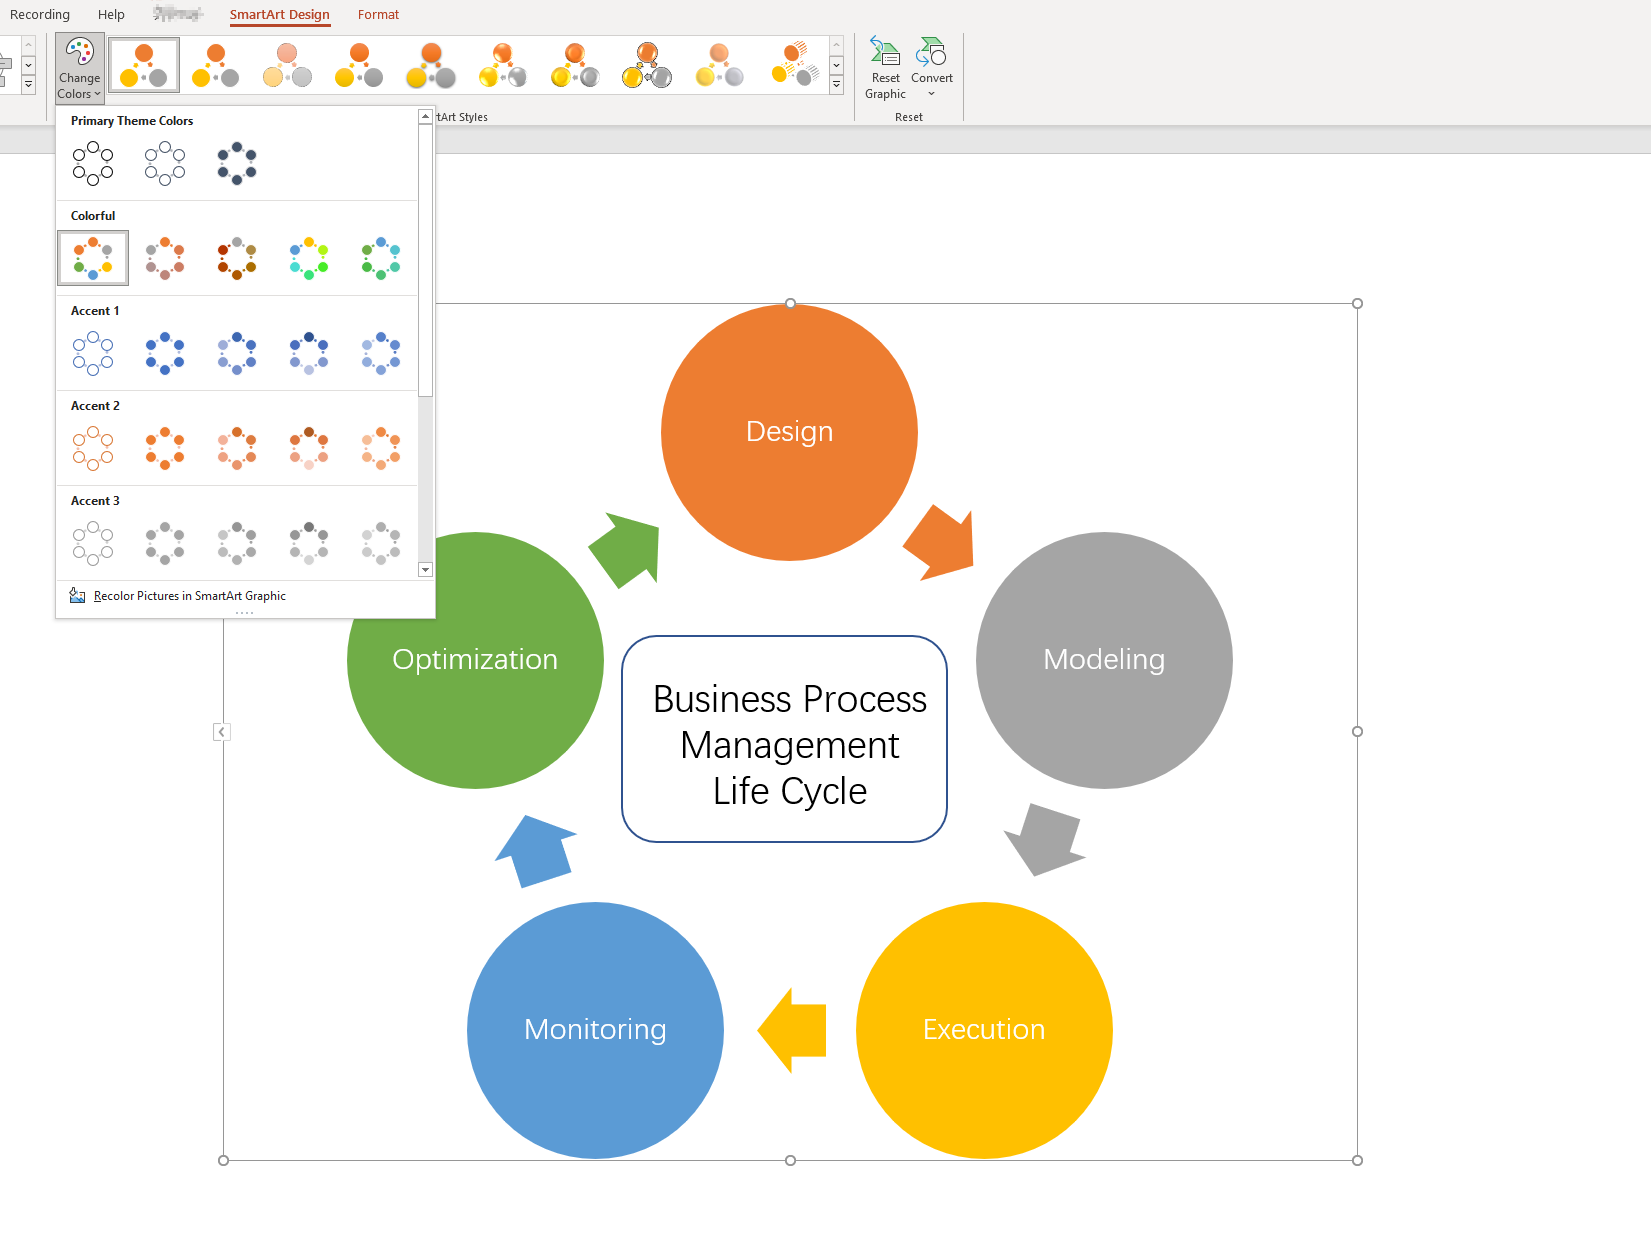
2. Click on the "Insert" tab, choose "SmartArt", and then select "Circle". Pick the Circle Diagram type that suits your needs.
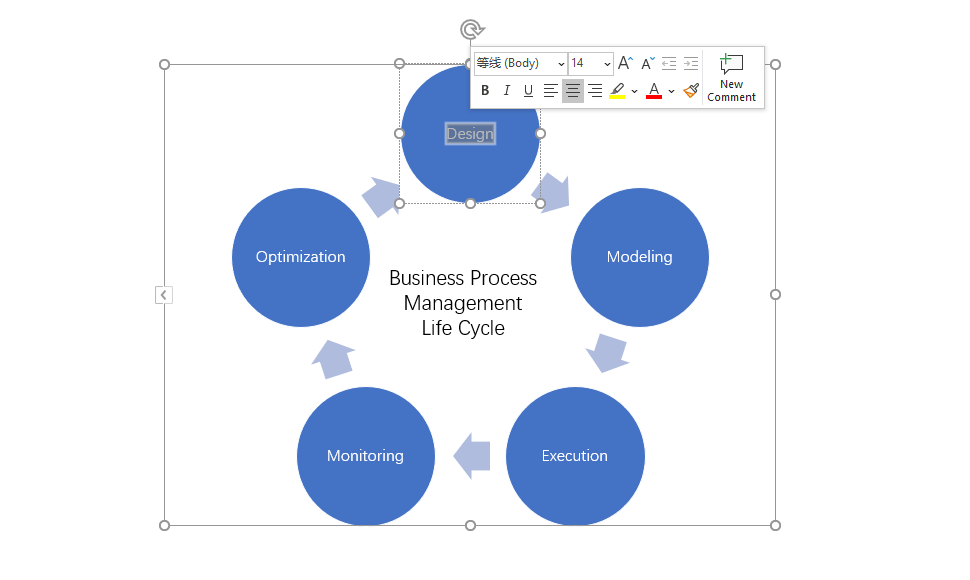
3. Double-click on each sector to modify the labels and values as per your data.
4. Select "SmartArt design" or "Format" to customize fonts, colors, borders, and other visual properties to enhance the visual appeal of your diagram.
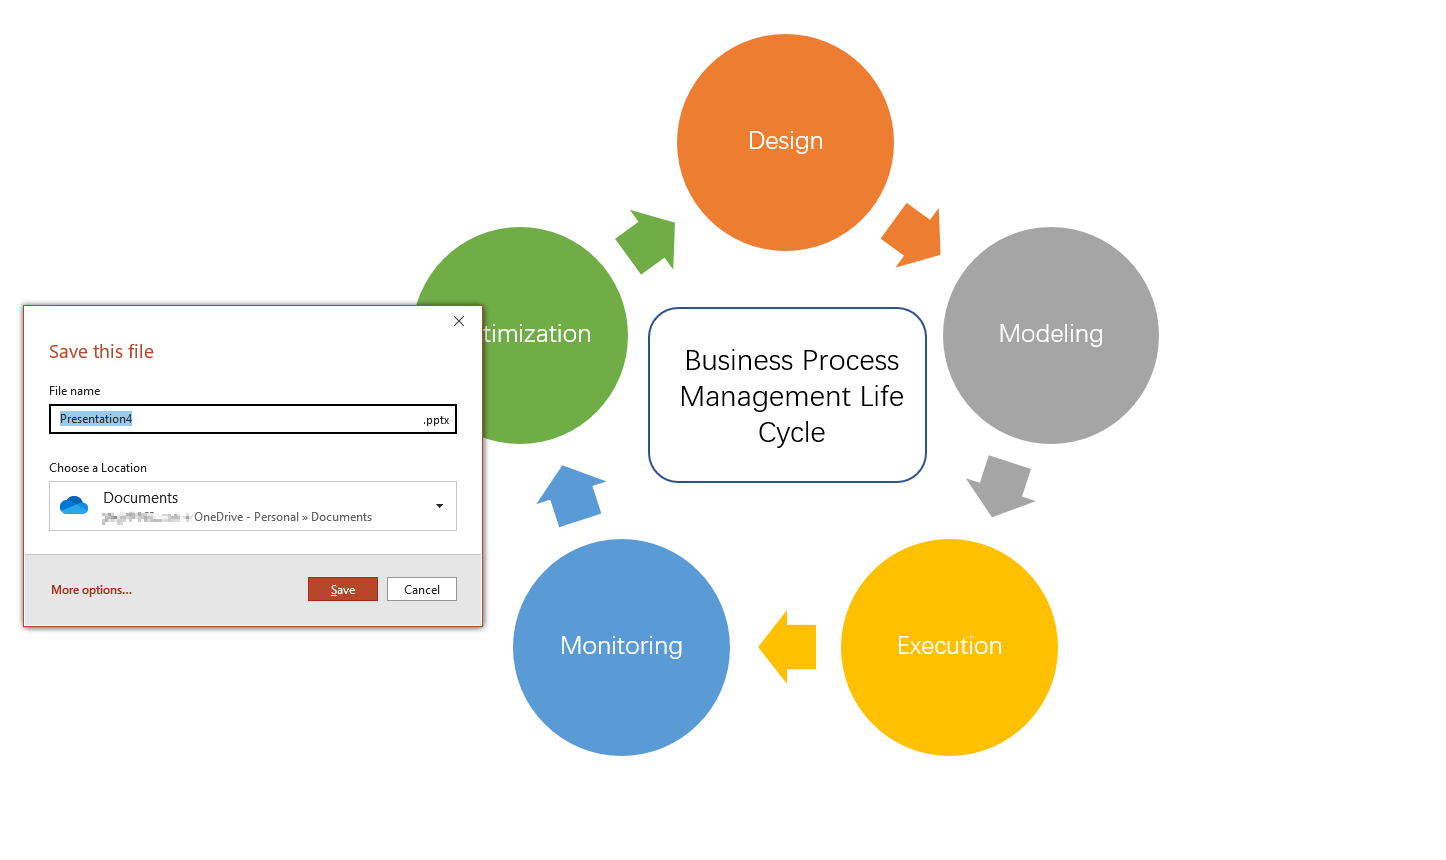
5. Save your presentation and use your professionally designed circle diagram to captivate your audience.
How to Create a Circle Diagram in Boardmix
Boardmix is a state-of-the-art online platform designed to empower individuals and organizations in creating dynamic visual content, including the creation of circle diagrams. With a user-friendly interface and a vast array of powerful features, it provides an all-in-one solution for visually captivating presentations and data visualization.

What's more, Boardmix offers a diverse template library that caters to various presentation needs, including circle diagrams. The platform also offers a wide range of customization options to bring you an amazing design experience, and its ability to collaborate in real time makes it an excellent choice for group projects or remote teams. It can be said that Boardmix is the go-to solution for bringing your circle diagrams to life.
Follow these steps to design your circle diagram in Boardmix:
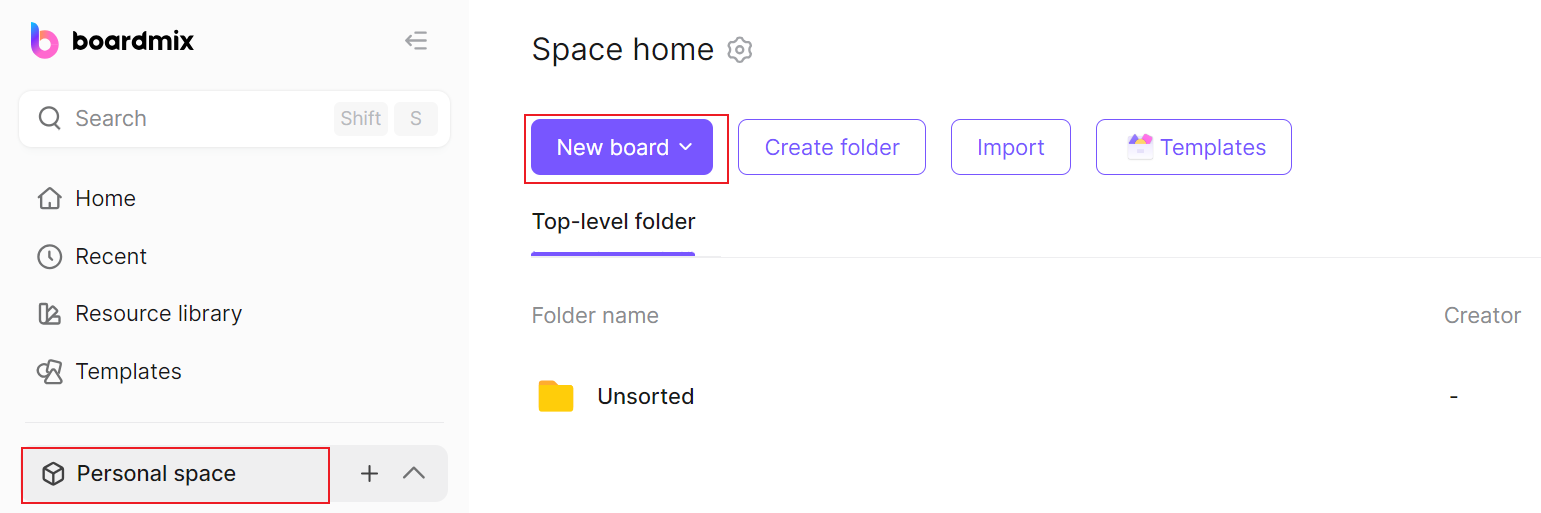
1. Visit the Boardmix official website and sign in to your account or create a new one.

2. Once logged in, create a new board to create a customized diagram.
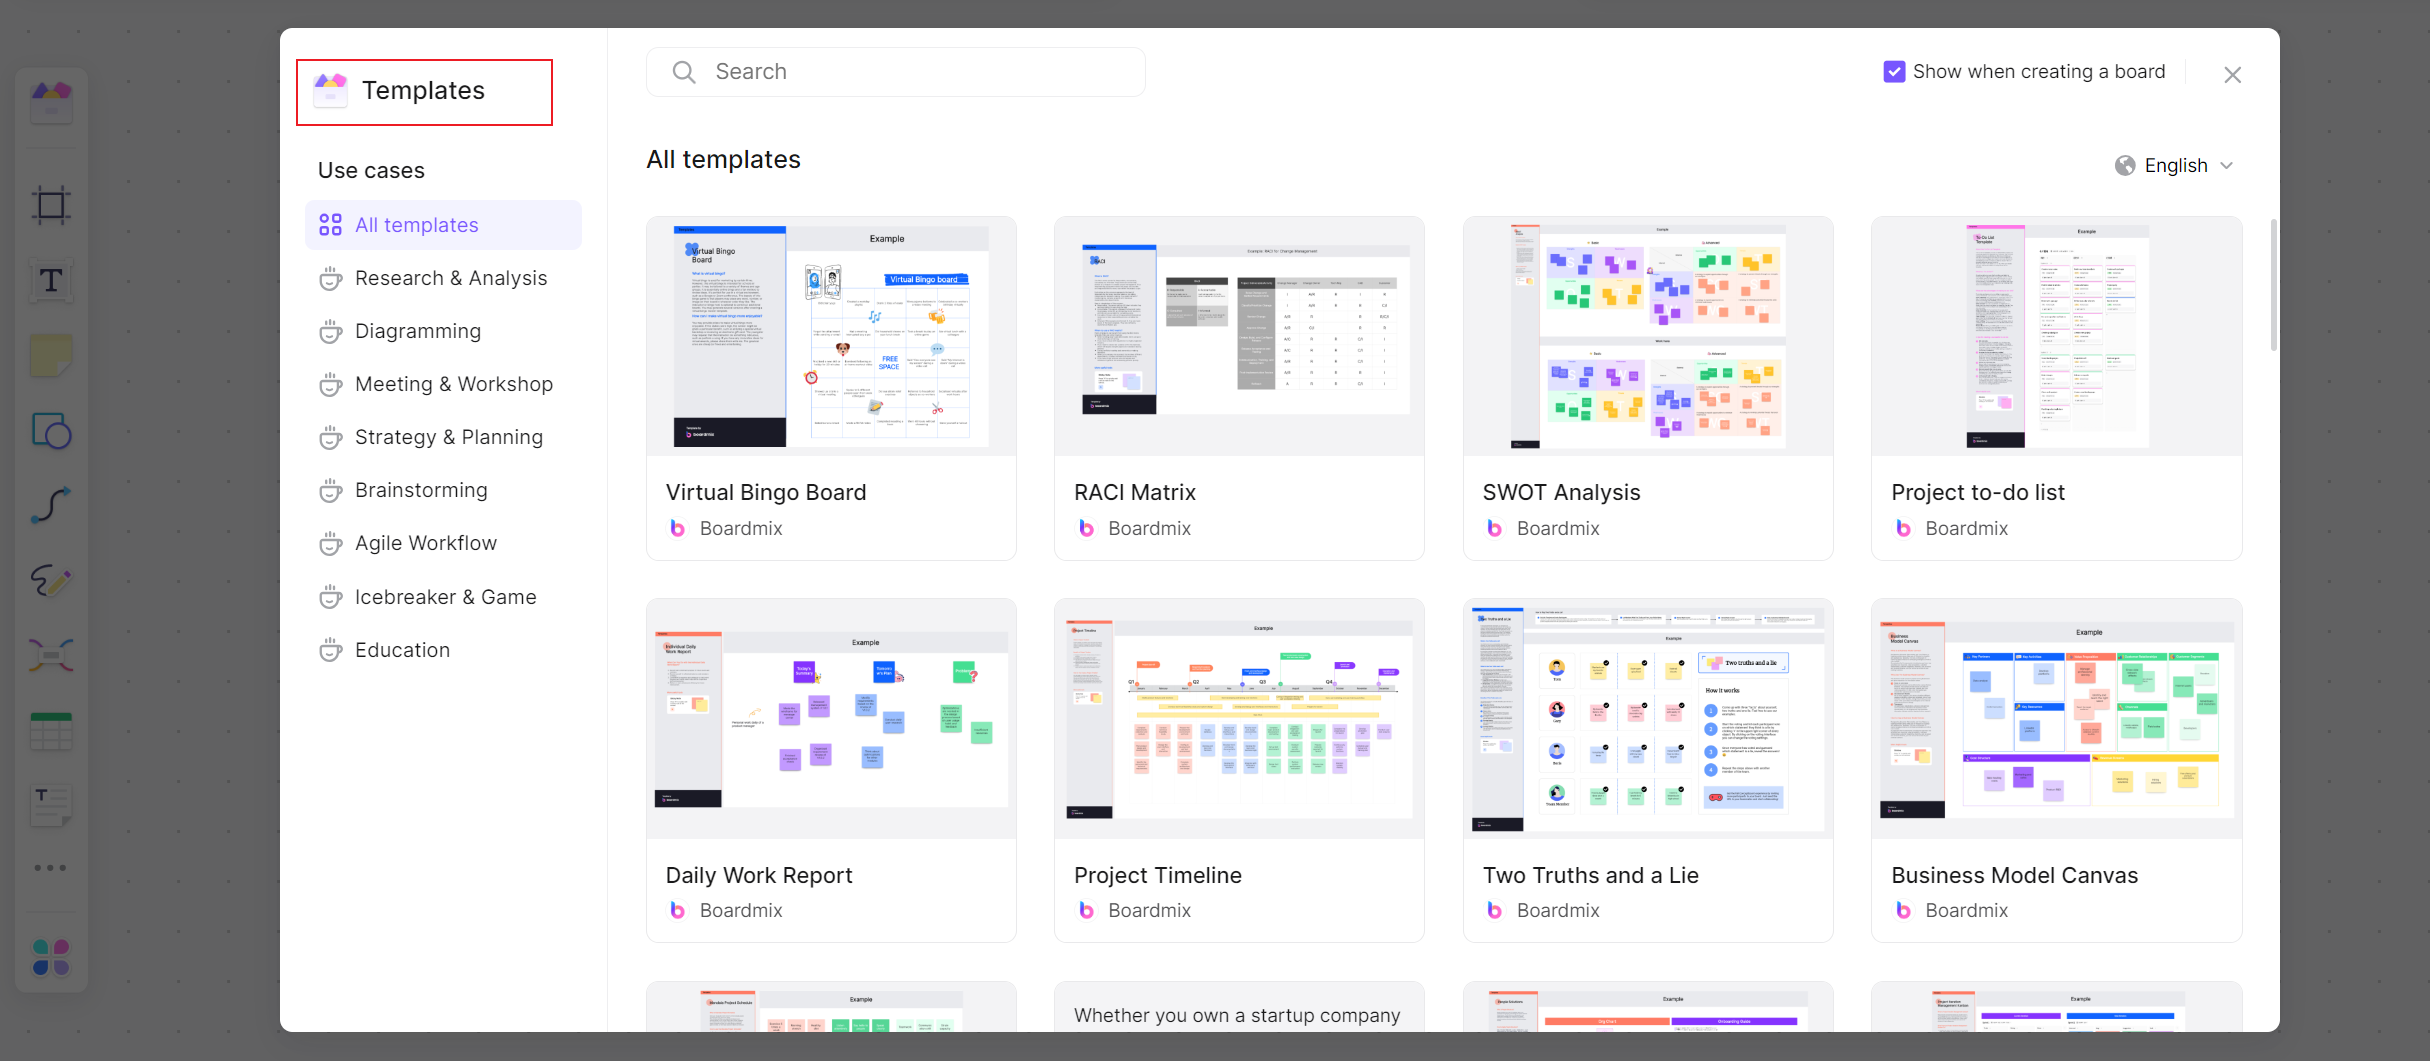
3. Once logged in, navigate to the dashboard, select 'Templates', and choose one of Circle Diagrams that suits your needs from the template list.
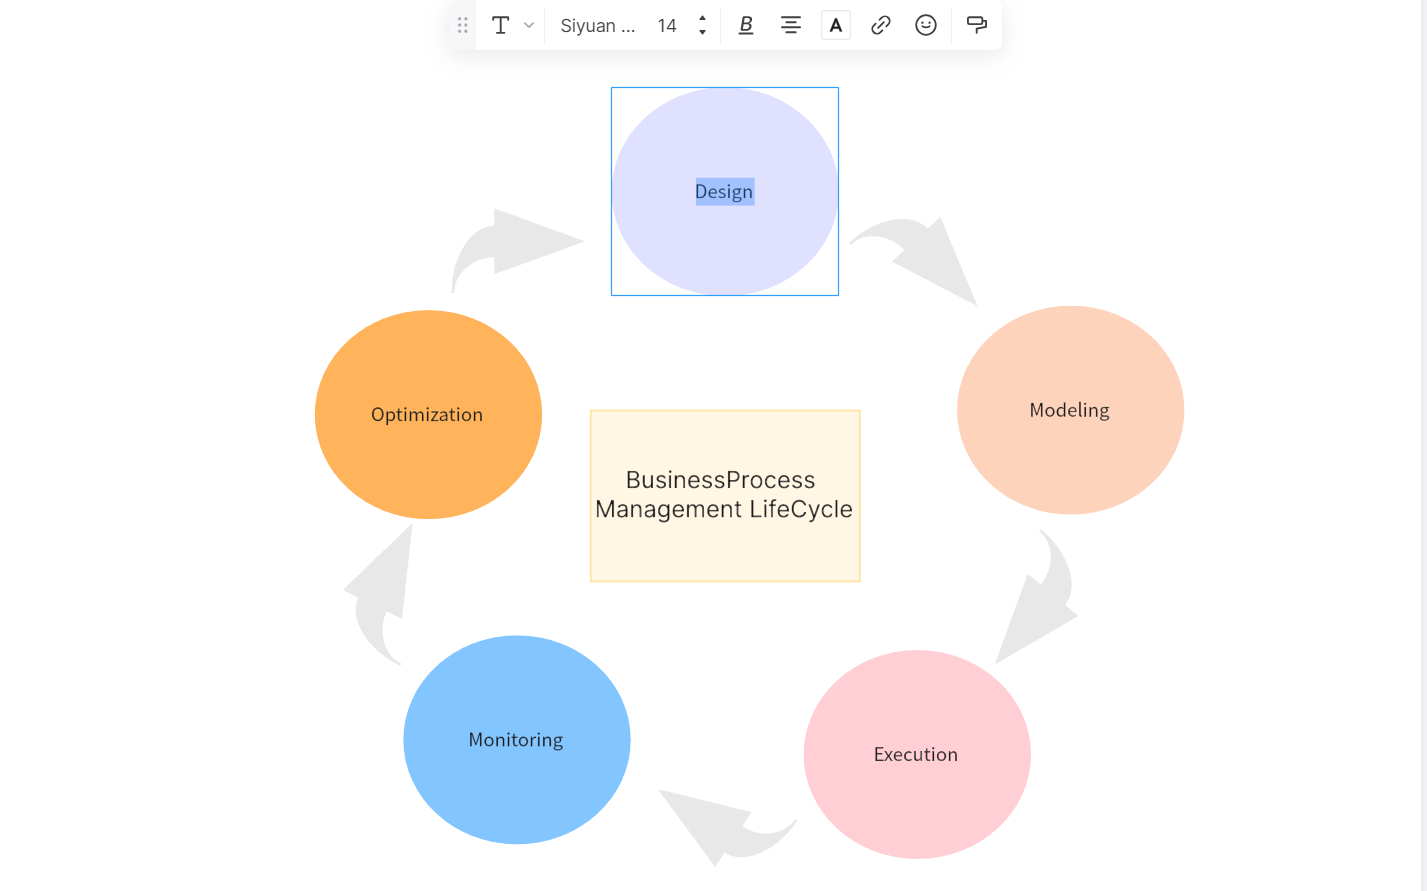
4. You can also start from scratch, click on the circles shapes from the left panel to input your data and values. Repeat this step until you present a complete circle process.
5. Customize the circle diagram by choosing different colors, fonts, and styles to match your presentation's aesthetic.
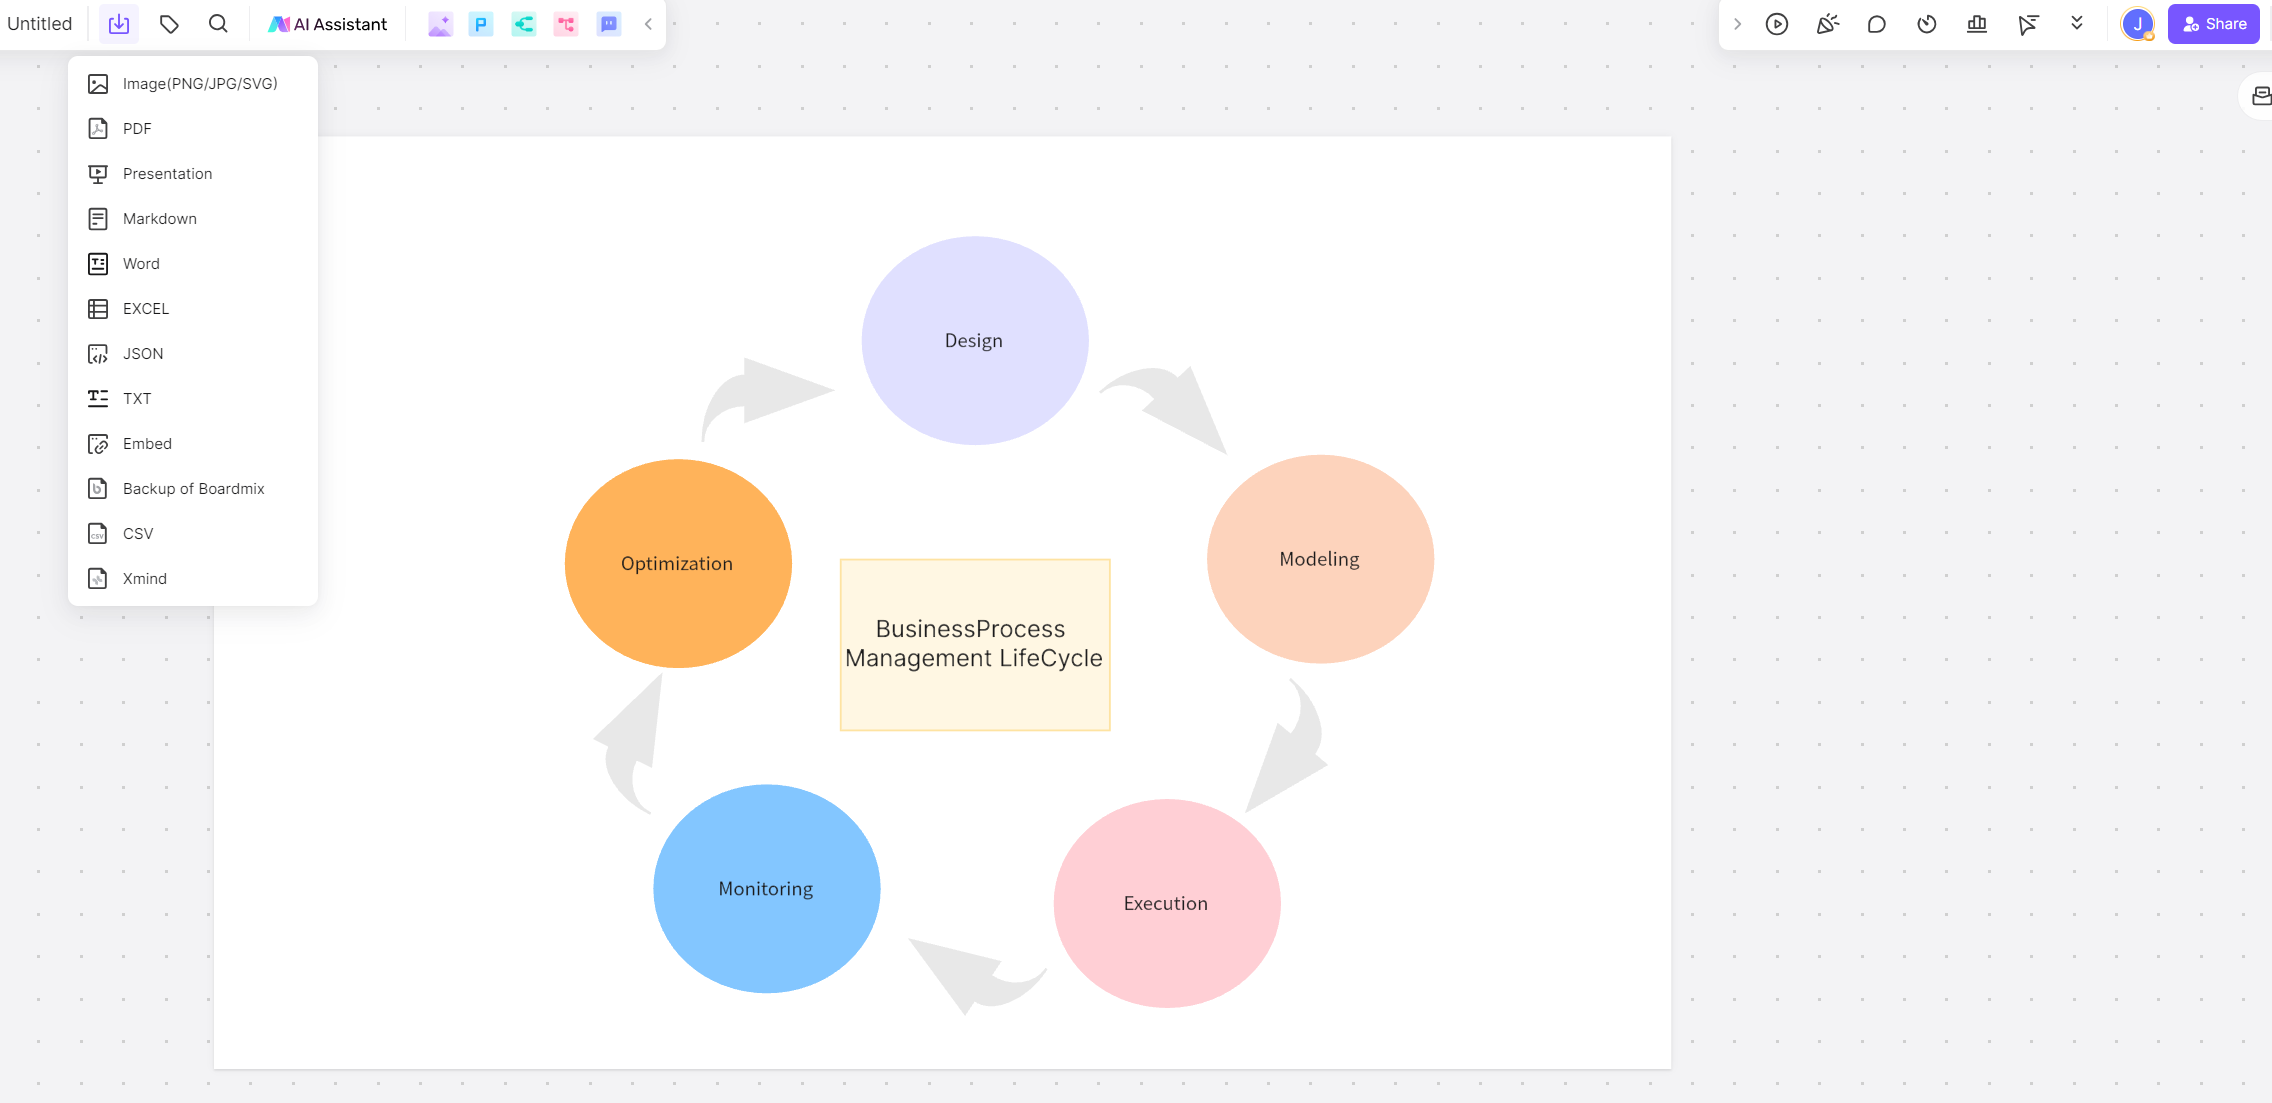
6. Once you are satisfied with the final result, save and download your circle diagram as a high-quality image or share with your teamwork members.
How to Choose: Create Circle Charts in Boardmix or PowerPoint
When deciding between Boardmix and PowerPoint for creating circle diagrams, it's essential to consider their respective advantages and disadvantages across various aspects to choose the software that best suits you to create charts efficiently.
Customization and Design: Both Boardmix and PowerPoint offer customization options, but Boardmix provides a wider range of design elements, templates, and options for personalization. It allows for more creativity with different colors, fonts, images, and shapes, enabling you to design visually stunning circle diagrams that align with your branding or presentation needs.
Collaboration and Interactivity: Boardmix excels in collaboration and interactivity. It allows real-time collaboration among team members, making it an excellent choice for group projects or when working remotely. Additionally, Boardmix allows the integration of external data sources, enabling dynamic and interactive circle diagrams that can be updated in real-time. PowerPoint, while lacking these advanced collaboration features, still offers basic sharing capabilities.
Ease of Use and Familiarity: PowerPoint is highly familiar and widely used, making it a straightforward choice for those comfortable with the Microsoft Office suite. The software offers a user-friendly interface and simpler learning curve, making it easy to create circle charts quickly. Boardmix, with its comprehensive set of features, may take some time to become familiar with, especially for new users.
Additional Features and Functionality: Boardmix offers additional features like chart animation, video integration, and the ability to create interactive presentations. While PowerPoint provides basic animation options, it lacks the advanced interactive features available in Boardmix.
Overall, if simplicity and familiarity are your top priorities, PowerPoint can still be a solid option for creating a basic circle diagram. But if you have highly personalized design and interaction needs, then Boardmix becomes the recommended choice for creating circle diagrams. Its wide range of functionality, collaboration features and greater design flexibility ensure visually appealing and interactive circle diagrams. It greatly caters to users who value customization, interactivity, and advanced presentation features. So give Boardmix a try and get some new experience!


