


As we find ourselves interacting with data more frequently, data visualization becomes increasingly important. It enables us to understand complex data sets and convey this information to others effectively. One such tool is a bubble chart. In this article, we'll explore what bubble charts are, how to create one in Google Sheets and Boardmix, and the pros and cons of using Google Sheets for this task. Let’s get started.
What Is a Bubble Chart
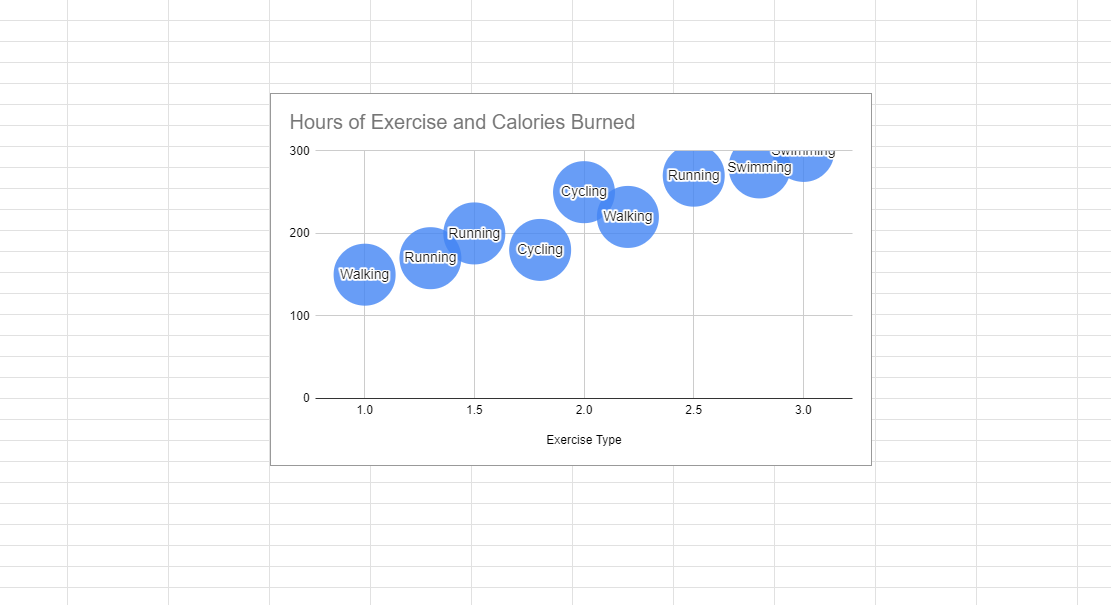
A bubble chart is a variation of the scatter plot. It displays three dimensions of data: each entity's two characteristics are portrayed on the axes, and a third numeric value is represented by the bubble size. This kind of chart can be especially useful when you have three data series and each contains a set of values. The positioning and size of the bubbles create a powerful visual impact that makes complex data more understandable.
How to Create a Bubble Chart in Google Sheets
To create a bubble chart in Google Sheets, follow the steps outlined below:
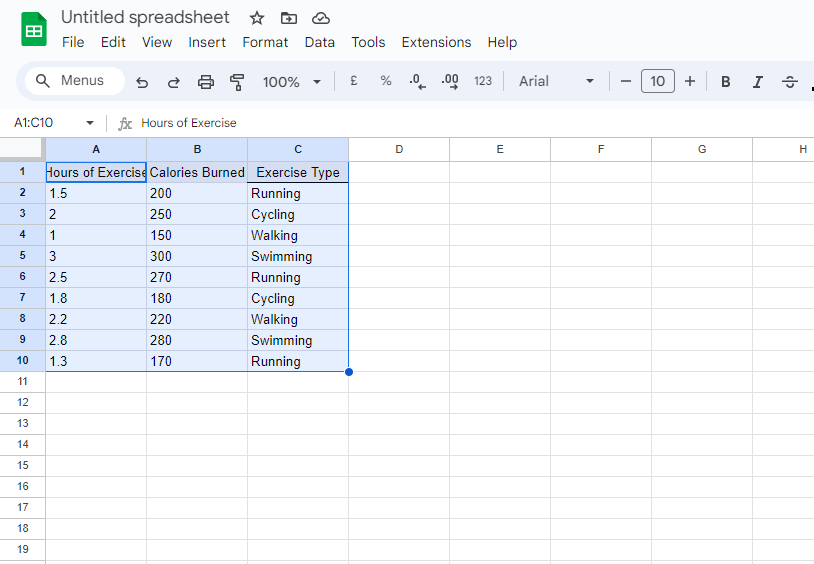
Step 1: Open a new Google Sheets document and input your data in columns. Make sure to arrange your data in three columns corresponding to x-values, y-values, and bubble size values.
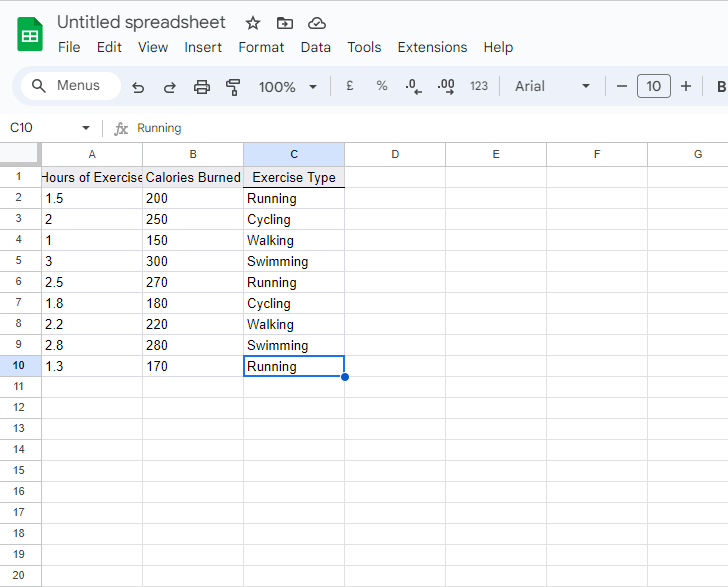
Step 2: Highlight the cells containing your data.
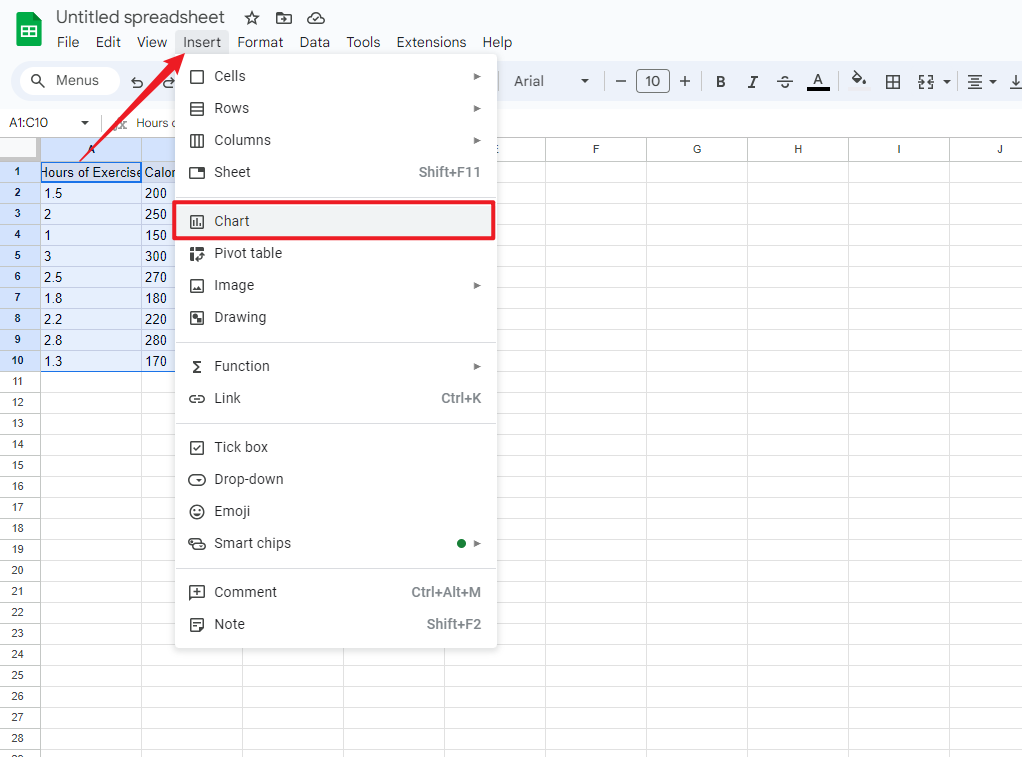
Step 3: Click on the "Insert" tab at the top of the page and then select "Chart".
Step 4: A chart will appear on your sheet and the Chart Editor will appear on the right side of your screen. Click on "Chart type" and scroll down to find the Bubble Chart option under the "Scatter" category.
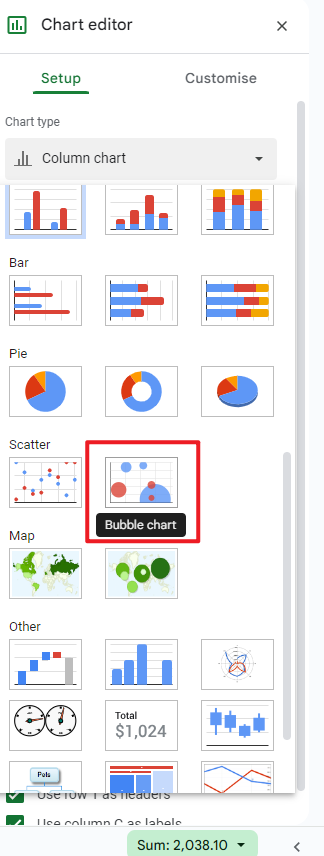
Step 5: Click on the “Bubble chart” option. Google Sheets will automatically generate a bubble chart using your selected data.
Pros and Cons of Creating a Bubble Chart in Google Sheets
Creating bubble charts in Google Sheets offers certain advantages, but it also has its limitations.
Pros
- Easy Accessibility: Google Sheets is web-based, which means you can access your charts from anywhere with an internet connection.
- Real-time Collaboration: Google Sheets allows multiple users to view and edit a chart simultaneously. This feature is ideal for team projects or situations where multiple stakeholders need access to the chart.
- Integration with Google Workspace: If you're already using Google Workspace, creating Bubble Charts in Google Sheets can be easily integrated into your workflow.
Disadvantages
- Limited Customization Options: While Google Sheets provides basic customization options, it falls short compared to specialized visualization tools that offer more advanced features.
- Dependent on Internet Connection: Since Google Sheets is web-based, you'll need a steady internet connection to work on your charts.
Despite some drawbacks, Google Sheets remains a popular choice for creating Bubble Charts due to its user-friendly interface and collaborative features. Whether it's the right tool for you will depend on your specific needs and circumstances.
A Highly Rated Bubble Chart Maker - Boardmix
When it comes to creating informative and eye-catching bubble charts, one tool soars above the rest in terms of features and user satisfaction: Boardmix. Highly rated for its intuitive interface and flexible capabilities, Boardmix stands out as an all-in-one platform for project management, collaboration, and data visualization. Let's explore why this top-notch bubble chart maker has earned such accolades.

Understanding Boardmix
Boardmix is a web-based application designed to cater to the demands of modern businesses and individuals who need to manage projects, work in teams, and visualize data in meaningful ways. The platform boasts a user-friendly design and a multitude of features that streamline workflows. However, one of its standout offerings is its exceptional bubble chart capability.
Key Features of Boardmix
Automation for Efficiency
One of the most striking features of Boardmix is the way it simplifies and automates much of the bubble chart creation process. By taking over repetitive tasks, it allows users to concentrate on other, more critical areas of their work.
Simplified Data Import
Boardmix supports importing data from a variety of file formats, including CSV, Excel, and Google Sheets. The convenience of direct data import helps users bypass the tediousness of manual data entry.
Customization at Your Fingertips
When it comes to customizing bubble charts, Boardmix allows for full creative control. Users can adjust colors, sizes, labels, and more to improve readability and give their charts a personalized touch.
Collaboration Made Easy
Boardmix's platform incorporates extensive collaboration features. Multiple team members can simultaneously work on the same chart, making Boardmix an excellent choice for collaborative projects.
High Standard Data Security
In this era of cybersecurity threats, Boardmix prioritizes the secure handling of user data. Users can confidently create charts without worrying about the privacy and safety of their data.
Why Choose Boardmix for Your Bubble Chart Needs
By capitalizing on the robust features provided by Boardmix, you can create impressive Bubble Charts that provide clear insight into complex datasets. With a blend of efficiency, customizability, and collaboration features all packaged within a user-friendly design, Boardmix establishes itself as a highly reliable solution for your data visualization needs. Just try it out now!


