


The BCG matrix, created by the business experts of Boston Consulting Group in the 1970s, is a popular analysis tool that gauges the performance of a company’s products and services. It helps identify which products need more investment for growth, which ones are generating sufficient income on their own, which ones might need to be phased out, and so on. In this article, we will analyze the BCG matrix of Amazon and see how their main products and services are doing.
Background of Amazon
Amazon.com is one of the biggest online retailers today and was founded in 1994 by Jeff Bezos. The company initially sold books, music, and movies but quickly branched out to a whole range of other items. Amazon is still known for having the biggest book selection in online retail, but it also carries a plethora of products including electronics, software, toys, home improvement items, and even clothing. Today, Amazon has a market cap of $1.36 trillion, placing it at rank 5 of the world’s most valuable companies.
Amazon BCG Matrix Analysis
With Amazon’s product portfolio having seen tremendous growth in the last couple of decades, it is pretty interesting to see how these products are performing in the market today. We can get a picture of this in the BCG matrix for Amazon below.
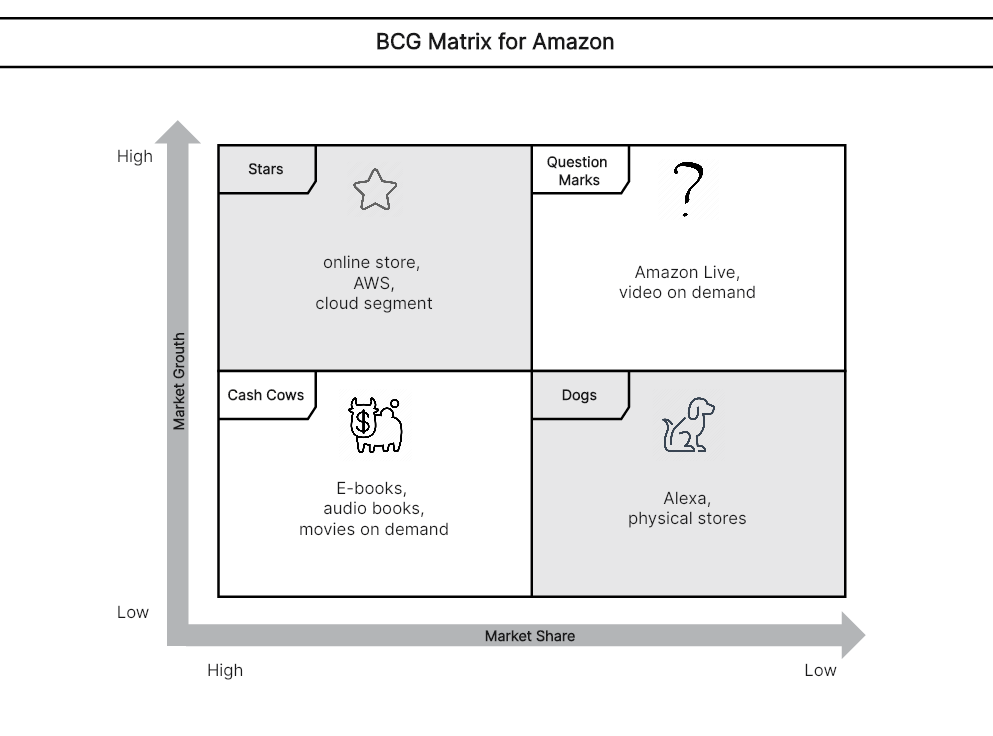
Amazon BCG Matrix Analysis Created in Boardmix
Based on the most recent data on market growth and market share, we can see the placement of some of the most notable Amazon offerings in the Amazon BCG matrix. Based on the current position of each product, the company can form the right strategies that would be best for the business.
Stars
Stars hold a significant share of the market and are in a promising position to be huge earners. By placing bigger investments in these products, they can bring in reliable revenue for a long time. Without a doubt, the star in the BCG matrix of Amazon is Amazon.com, the company’s online store. But not too far behind are its cloud segment and AWS, which are both showing significant growth.
Question Mark
The market performance of question marks has not yet been established since they are usually new. In the Amazon BCG matrix, video on demand and Amazon Live fall into this category, and we have yet to find out how they will become a star or a dog in the months to come.
Cash Cows
Cash cows are products that have proven to be a stable source of income and are in a market that is not showing much growth. Hence, they can continue to generate high revenue without additional investment. It’s not a surprise that Amazon’s cash cows are their books and movies, which have been their primary products since the beginning.
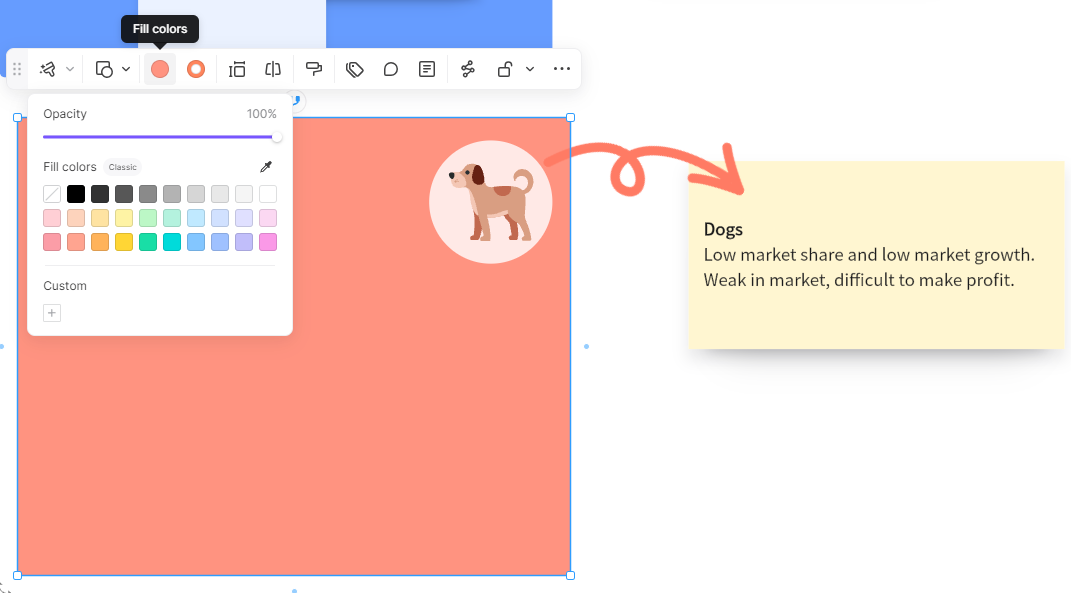
Dogs
Dogs are products that do not generate much revenue nor show much promise of growth. Investing in them further can just lead to losses for the company. Amazon has physical stores that not many know about, and these are definitely the dogs in the BCG matrix for Amazon. Likewise, Alexa has turned into a dog as its market share has gradually dropped from the impressive 80% it held during the early stages.
Mastering BCG Matrix Creation on Boardmix
The Boston Consulting Group (BCG) Matrix is a vital tool for strategic management, allowing you to visualize a company's product portfolio and identify growth opportunities. Here's how you can create a BCG Matrix on Boardmix.
1. Login and Create a New Board
First, log into your Boardmix account. Once logged in, click on ‘New Board'. This gives you a fresh canvas to work on.

2. Draw the BCG Matrix Grid or Use a Template
The BCG Matrix consists of a 2x2 grid. Use the ‘shape' tool in the toolbar to create this grid. You will need two perpendicular lines intersecting in the middle to form four quadrants. You can also search for the BCG Matrix template in the template library and use it for free.
3. Label the Axes
Next, label your axes. The y-axis usually represents the market growth rate, while the x-axis represents the relative market share. You can add these labels using the 'text' tool from the toolbar.

4. Add Quadrant Labels
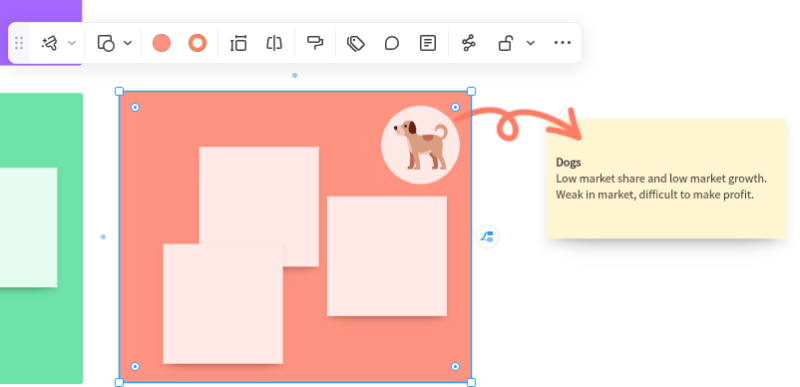
Each quadrant in the BCG Matrix represents a different product category: Cash Cows (high market share, low market growth), Dogs (low for both), Stars (high for both), and Question Marks (low market share, high market growth). Use the text tool again to add these labels.
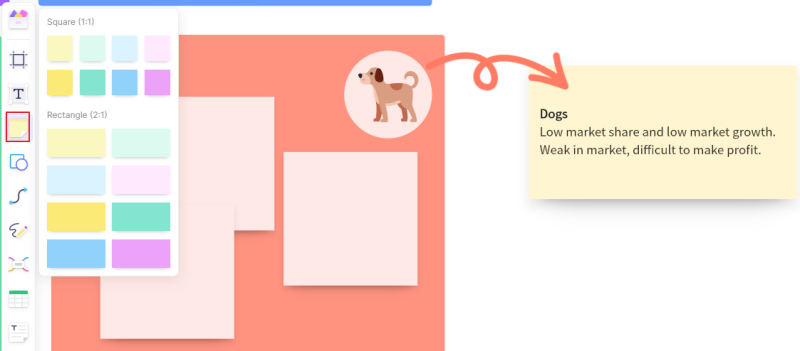
5. Plot Products
Start plotting your products or business units in the appropriate quadrants based on their market share and growth rate. You can use different shapes or colors for each product to make them distinguishable.
6. Customize Your Diagram
Boardmix offers various customization options. Feel free to change colors, add patterns, or adjust sizes as needed to create a visually engaging BCG Matrix
 .
.
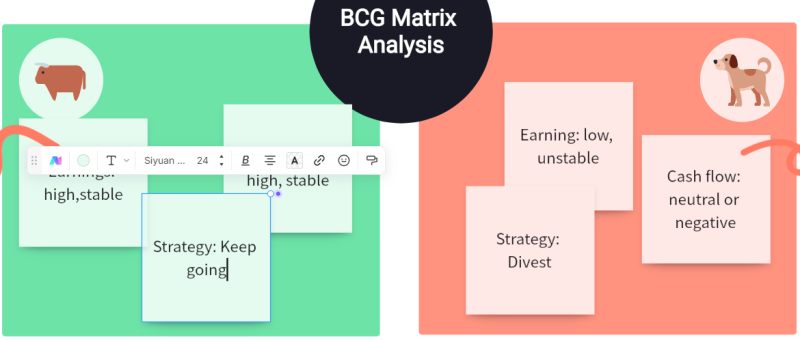
7. Add Notes or Annotations
If needed, add any notes or annotations for clarification using the text tool. This can be especially helpful when sharing your BCG Matrix with others who might not be familiar with all the products or units plotted.
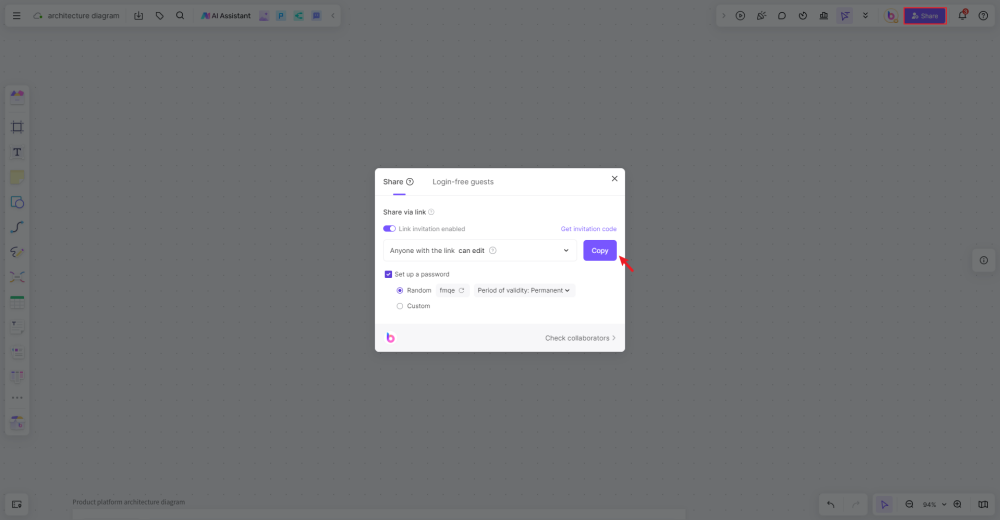
8. Save and Share Your BCG Matrix
Once you're happy with your BCG Matrix, save it on Boardmix's secure cloud storage for future reference. You can also share your diagram with colleagues or stakeholders via email or direct link.
Creating a BCG Matrix on Boardmix can significantly enhance your strategic planning process by providing a clear visualization of your product portfolio's current state and highlighting potential areas of growth or investment.
Key Takeaways
Based on the BCG matrix of Amazon, we see that products can shift between categories depending on how they perform in the market. Alexa used to be a cash cow and is now a dog. Amazon Live is still uncertain as it can either become a star or a dog.
By using a great mind-mapping tool such as the ones from Boardmix, we can create a BCG matrix for Amazon with ease, using a variety of symbols, images, and layout choices. Choose from a range of BCG matrix templates and be able to do a comprehensive analysis of Amazon’s products.


