


Businesses frequently engage in product and service evaluations to assess their performance. Among the various methods available, the BCG matrix stands out as a widely embraced approach. This matrix offers a structured way to analyze products based on their market growth and share, assisting businesses in making informed decisions about resource allocation and strategic direction.
Developed in the 1970s by the Boston Consulting Group, the BGC matrix analyzes a brand’s products based on market growth and market share. In this article, we will present a sample analysis of the BCG matrix of Apple, which will show which products of the company are enjoying a high market growth, which ones are currently having a low market share, and so on.
Background of Apple
Apple stands as a foremost global player in the computer manufacturing sector. Co-founded in 1976 by Steve Wozniak, Ronald Wayne, and the late Steve Jobs, the company was formally established as Apple Computer, Inc. in the subsequent year. By going public in 1980, they swiftly evolved into the world’s most valuable enterprise, presently commanding a market cap of $2.769 trillion and boasting a revenue (TTM) of $383.93 billion. While Apple computers continue to yield substantial revenue, the brand’s prominence is now chiefly associated with their iconic iPhones in the present market landscape.
Apple BCG Matrix Analysis
The BCG matrix of Apple examines the products in the Apple brand portfolio and groups them based on their performance in terms of market growth rate and current market share.
Apple BCG Matrix Analysis Created in Boardmix
The market growth rate is represented by the Y-axis in the matrix. It pertains to how much and how fast the market is growing for a particular product in the portfolio. The market growth rate can be computed by dividing the total sales of the product for the present year by the total sales of the product in the preceding year. These sales data can be obtained from industry reports.
In contrast, the market share finds its representation on the X-axis within the Apple BCG matrix. Calculated by dividing the company’s total sales by the overall industry sales, the result is then multiplied by 100 to present it as a percentage. This metric provides a valuable perspective on Apple’s relative position within the industry, aiding in strategic decision-making and allocation of resources.
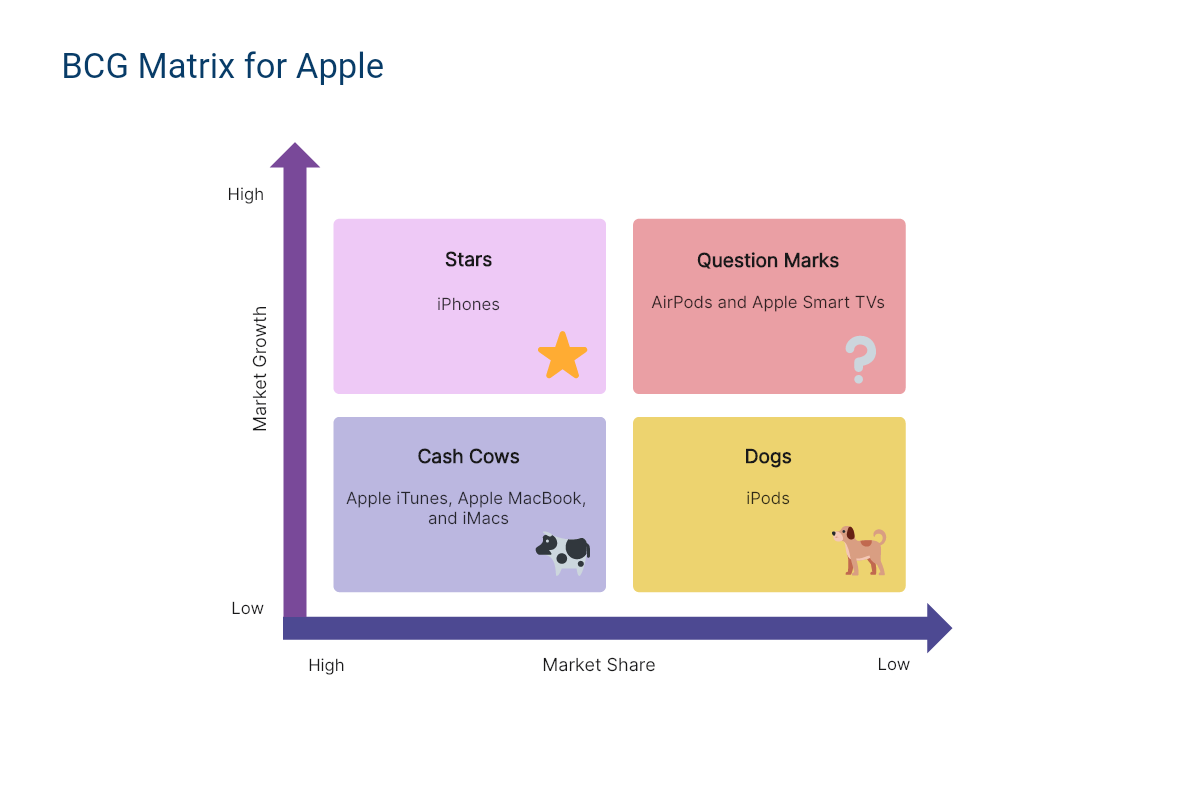
Stars
Stars are products that have a high market share and also a high potential for further market growth. In the BCG matrix of Apple, we can see that the stars of the company are the iPhones. It has been the preferred mobile gadget for worldwide consumers for many years but still, every time a new version is released, it still manages to top the previous version’s record in terms of sales.
Question Mark
Question marks in the BCG matrix denote products with low current market share but substantial growth potential. In Apple’s context, Smart TVs fit this category; having been recently launched, they’re yet to secure a significant market share. However, a robust marketing strategy and issue resolution could elevate them to stars akin to the iPhone. Smart TVs occupy a pivotal position in Apple’s product line, offering untapped potential in a burgeoning market. With strategic adjustments and consumer-driven enhancements, they possess the prospect to shift from question marks to future market leaders, mirroring the trajectory of Apple’s iconic iPhone.
Cash Cows
Cash cows are products that have a high market share in a market that is not really seeing a lot of growth. In other words, these are the very stable high-earners of the company. In the case of Apple, the cash cows are the MacBook, iTunes and iMacs. Despite the introduction of new competing products, these cash cows were able to retain a firm hold on the market, due largely to the fiercely loyal clientele that the brand has developed over the years.
Dogs
Dogs within the BCG matrix represent products that possess inherent quality but struggle to yield substantial revenue due to stagnant market growth. Examining Apple’s BCG matrix, iPods exemplify these dogs. While once dominant, their demand waned with the surge of competing alternatives. Consequently, their profitability plummeted, potentially resulting in losses for Apple. Despite their historical significance, their declining relevance highlights the competitive nature of the tech market and underscores the company’s ongoing evolution in adapting to dynamic consumer preferences.
BCG Matrix Template
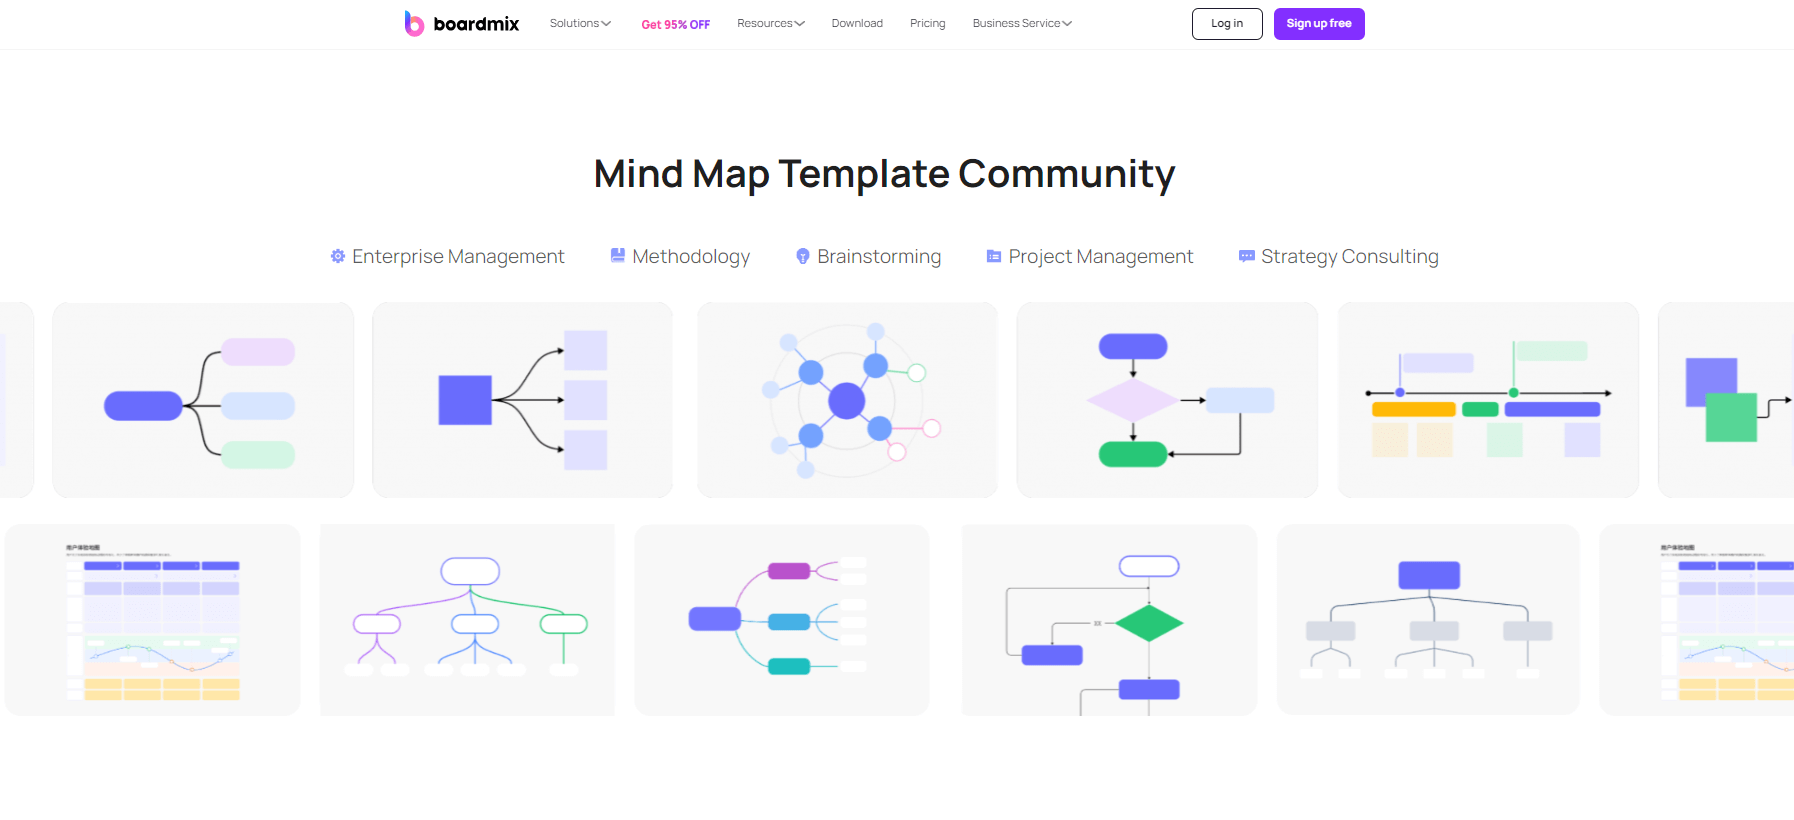
There are some free online whiteboard like Boardmix offers online BCG Matrix Template for free. Here's a step-by-step guide for you to try this template.
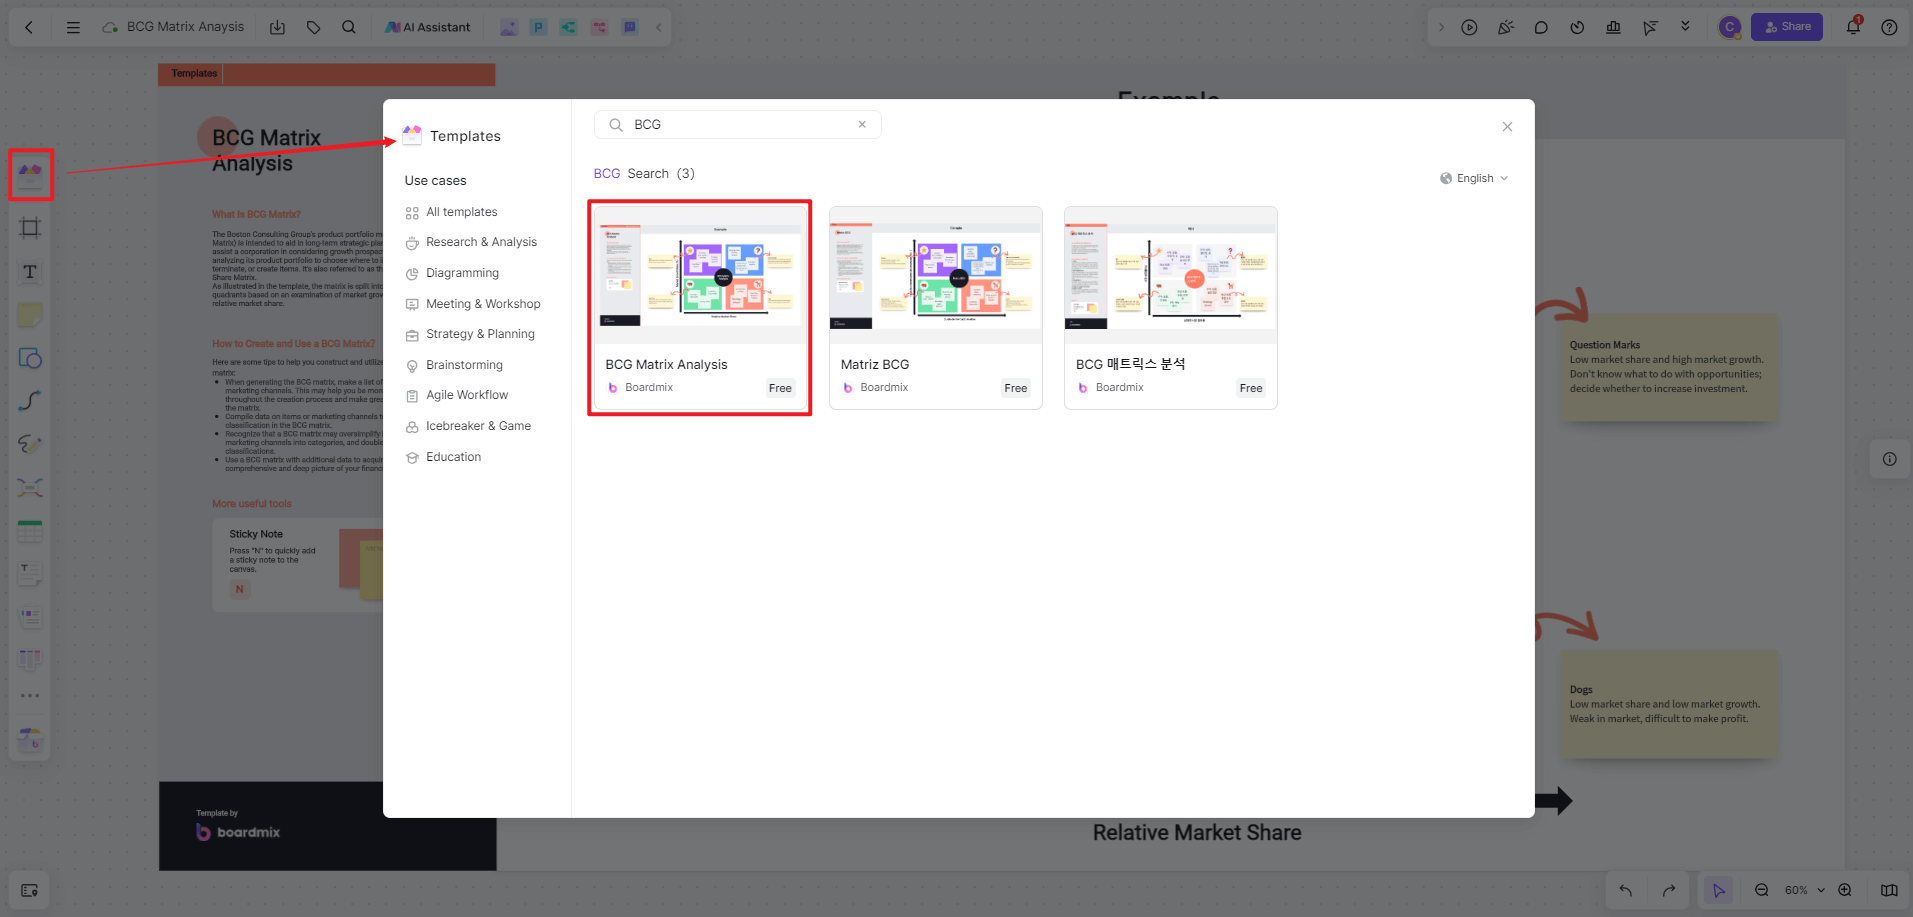
Step 1: Open a New Canvas& Locate the BCG Matrix Template
After logging in, click on 'Create New Board'. Name your board according to your preference and click 'Create'. Go to the template library on the right side of the screen. Scroll down and select 'BCG Matrix' from the list of available templates. Click 'Add' to insert the BCG Matrix template onto your canvas.
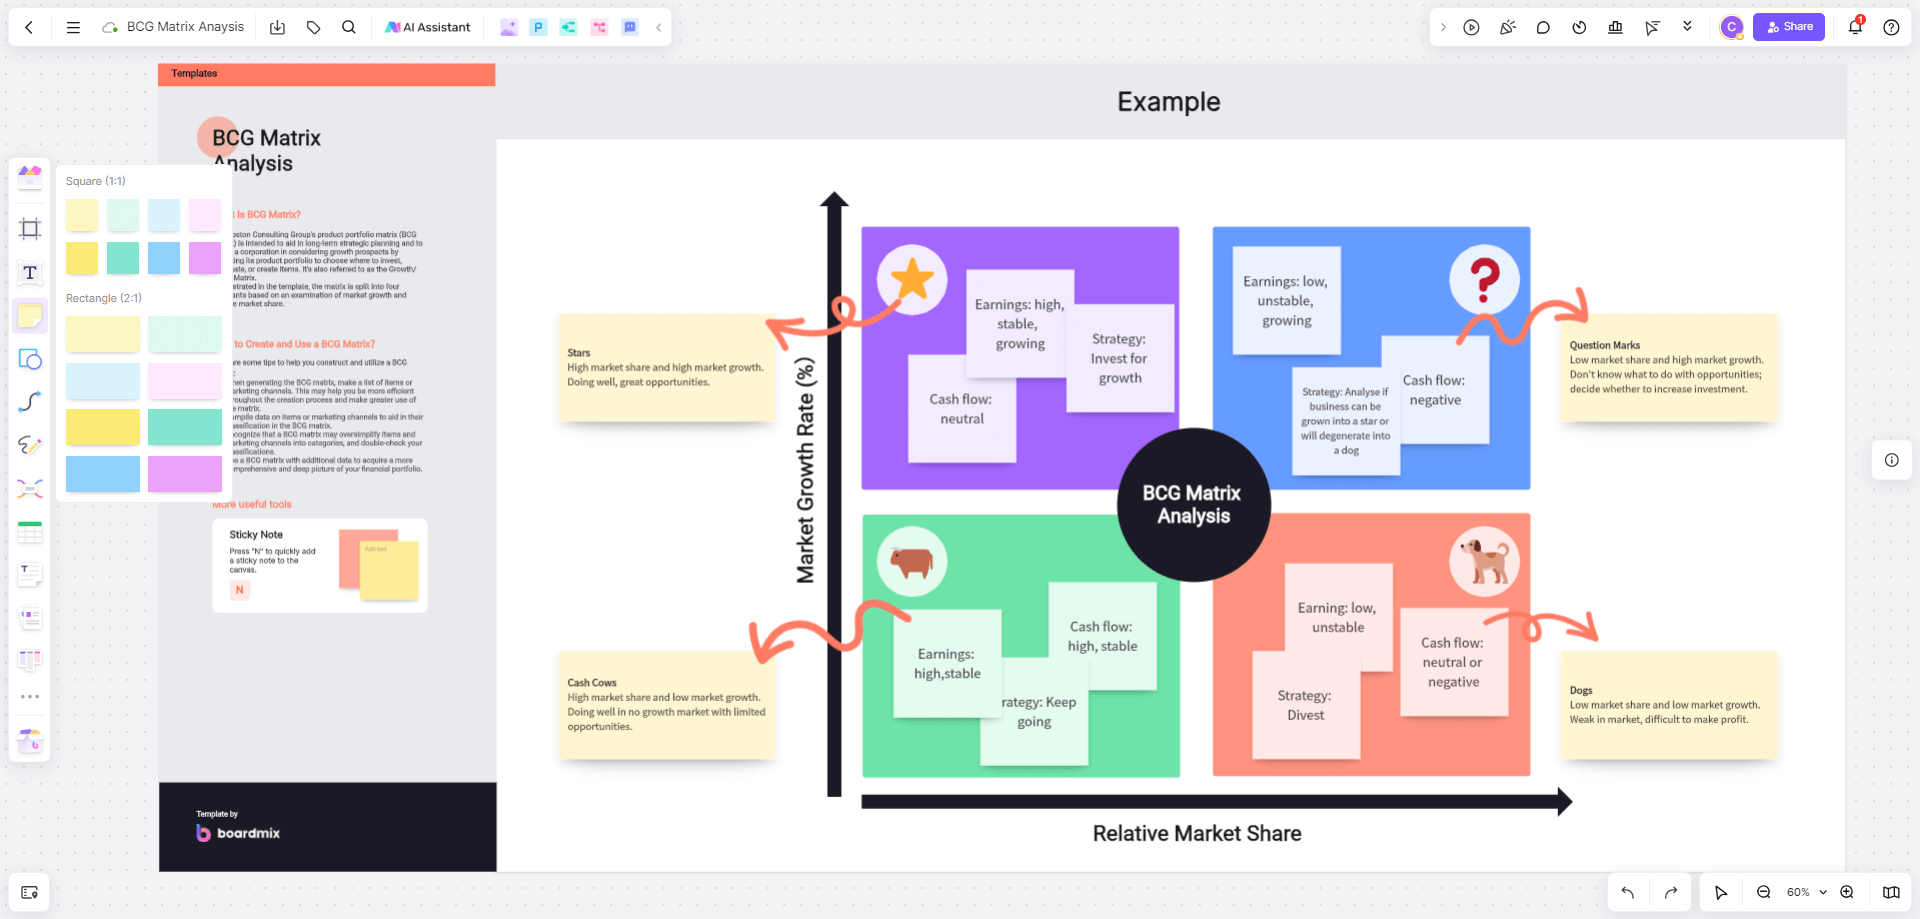
Step 2: Customize Your BCG Matrix
Each box of the BCG Matrix represents a different category – Star, Cash Cow, Question Mark, and Dog. Begin by labeling each of your product portfolios into these categories. You can use text boxes or sticky notes for labeling. You can also customize the color and size of your text and sticky notes for easy identification.
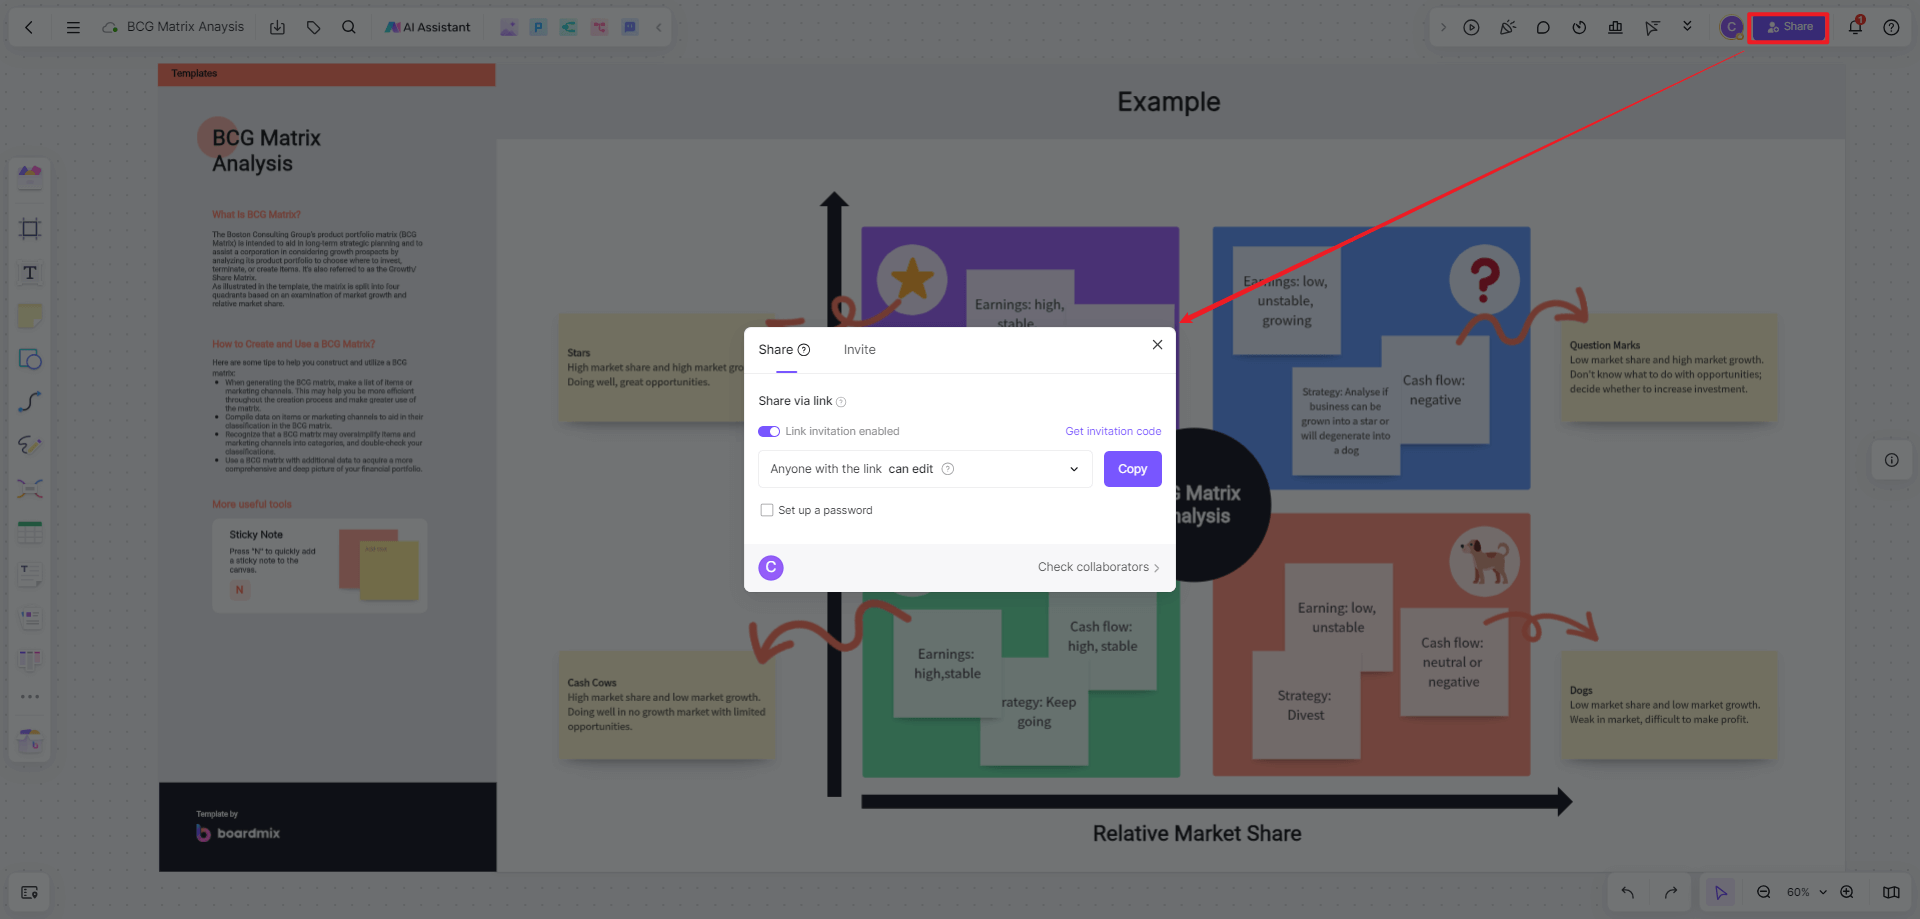
Step 3: Collaborate and Discuss
Boardmix allows real-time collaboration. Invite team members to view, comment, or edit the BCG matrix. You can discuss each product’s placement and strategize on how to leverage ‘Stars’, maintain ‘Cash Cows’, potentially convert ‘Question Marks’, and decide about ‘Dogs’.
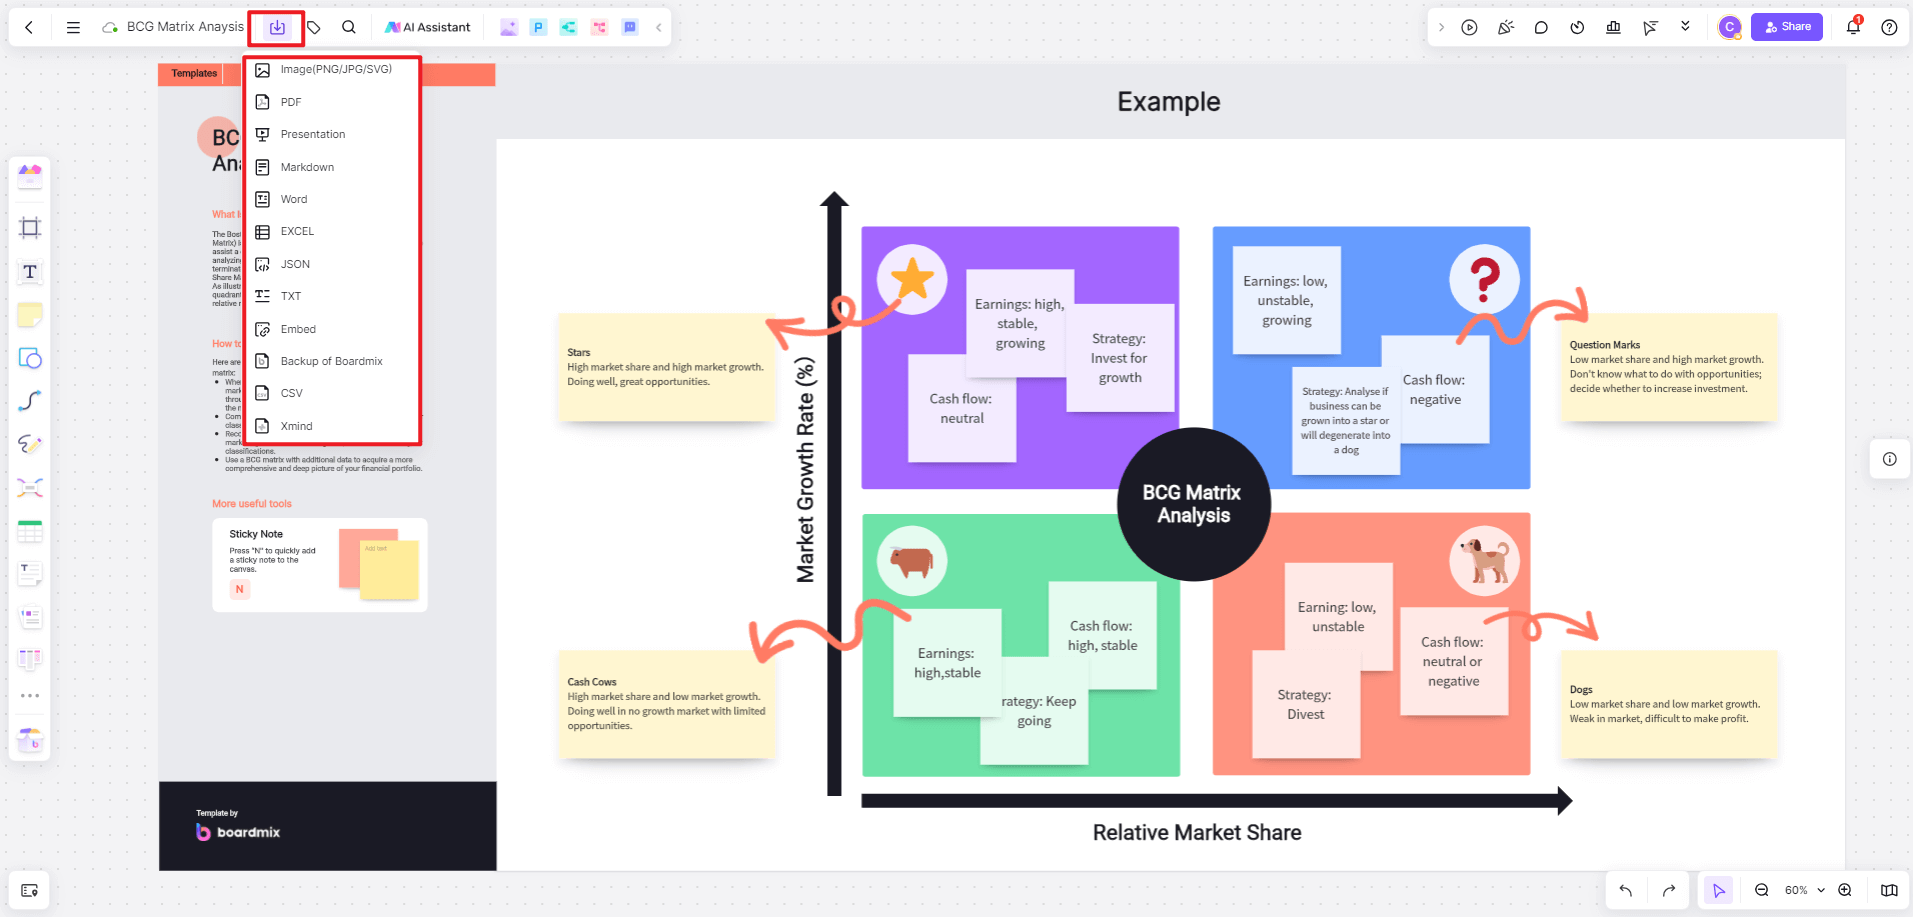
Step 4: Save and Export Your BCG Matrix
Once you are satisfied with your BCG Matrix, you can save your work. Boardmix also allows you to export your work in various formats such as PDF or JPEG for further use or presentation.
Key Takeaways
Apple is one of the biggest and most successful companies in the world today. They boast of an extensive product portfolio that began with computers and gradually expanded to digital tables, an operating system, and even music streaming. In the BCG matrix analysis of Apple that we did above, we were able to classify the main products of the brand based on market share and market growth.
It must also be noted that while it can provide many valuable insights, the BCG matrix analysis of Apple is still quite limited because it only takes into consideration the two dimensions of market share and market growth, when there are also other elements that have an impact on a product’s performance.
This kind of study requires a good deal of investigating and data analyzing, but it can be made simpler by using a pre-built BCG matrix template, such as the one that you will find on Boardmix. Just like the other mind-mapping tools at Boardmix, this BCG matrix template is very easy to use and will ensure that you are able to conduct the most efficient analysis of the brand portfolio.
Creating the BCG matrix is also easy, given that you understand what each quadrant means. You can also make it more fun by using pre-built templates online. This means you need not create a new diagram. All you need is access to these templates and tweak some sections to make it your own. Check on Boardmix's BCG matrix templates to start. After creating the matrix, share it with your peers and colleagues through a unique link available on the workspace page.
Boardmix is an instrumental tool designed to tap into your creativity and bring structure to your ideas. With its digital canvas, it empowers users for online collaboration involving seneries like design research, marketing analysis, business plan, daily meeting, weekly plan and online education. It offers one-stop solution of online whiteboard, flowcharts, mind maps, brainstorming, hybrid work, scrum tool and so on. Boardmix also integrated comprehensive AI-generation features like AI Presentation, AI Image, AI Mind Map and so on. BoardMix's online whiteboard combines advanced technology with ease of use, simplifying team brainstorming, data analysis, document drafting, and information visualization. Try to build your online template with Boardmix right now!
References
https://en.wikipedia.org/wiki/History_of_Apple_Inc.
https://www.edrawmax.com/article/apple-bcg-matrix-analysis.html
https://ycharts.com/companies/AAPL/revenues_ttm
https://companiesmarketcap.com/apple/marketcap/


