


To devise and implement successful strategies for marketing, sales, and product placement, businesses need to thoroughly assess the performance of each individual product within their respective markets. This comprehensive evaluation equips businesses with valuable insights crucial for making informed decisions that drive growth and market success. The BCG matrix makes this quite easy, as it categorizes the company’s brands depending on their showing in terms of how strong their hold is in the current market.
With the help of a BCG matrix, product managers can gain an accurate grasp of the position of their brand compared to competitors. Today, we are going to delve into the BCG matrix of Google and gain some understanding of how this company has continued to enjoy success over the years.
Background of Google
Almost universally recognized today, Google's vast influence conceals its humble origins. Few are aware that the world's leading search engine began as a research endeavor by two Stanford University PhD students, Larry Page and Sergey Brin, back in 1996. Initially dubbed BackRub, this project rapidly transformed into a monumental undertaking, fueled by extensive research and unwavering dedication. In 1998, Google formally incorporated as a company, all while still operating out of a garage, exemplifying the grassroots spirit that propelled its evolution.
Fast forward to more than two decades later, Google is now owned by the parent company Alphabet, and has a brand value of about $577.68 billion. In 2022, the company generated almost $280 billion in revenue, 80% of which came from the advertising business of the company.
Google BCG Matrix Analysis
Google’s search engine is by far the most popular on the Internet but the company does have a few other services to offer. In this BCG matrix analysis of Google, we will see how those other services fare in their respective markets.
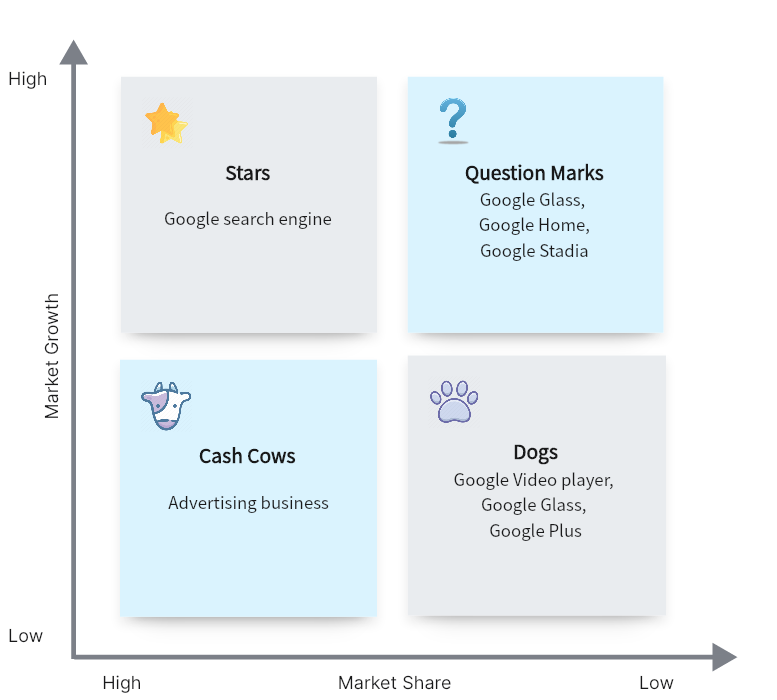
Google BCG Matrix Analysis Created in Boardmix
In this BCG matrix of Google that was constructed using the Boardmix template, we see where the products stand based on relative market share and the market growth rate.
Stars
Stars are the products that have a significant share in a market that shows a high growth rate. the Google search engine is definitely the star of the company because it is able to hold on to the biggest share despite continued growth of the market.
Question Mark
Question marks are newly developed products and services that could generate a lot more revenue, depending on how the market responds. Our BCG matrix of Google shows that the question marks for the company right now are Google Glass, Google Home, and Google Stadia.
Cash Cows
The cash cows are products that can be relied on to generate high revenue even without much investment, as the market is not moving much. Google’s total revenue comes mostly from its advertising businesses, making it the apparent cash cow of the company.
Dogs
Dogs are products that are not making that much money, though they might have at one point. The BCG matrix of Google shows that Google Plus, Google Glass and Google Video Player all fall into this category, due mainly to tight competition or low demand from consumers.
Key Takeaways
This article shows how the BCG matrix works and how we have easily created and analyzed the BCG matrix of Google, using the Boardmix template. By using current and accurate market data, it is actually easy to gain an understanding of a company’s product portfolio using this business tool.
To craft your custom BCG matrix for Google or any other company, simply navigate to the Boardmix website and access their user-friendly BCG matrix template. The tools provided are not only easy to use but also highly adaptable, granting you the flexibility to tailor the layout and content. This facilitates a comprehensive and succinct evaluation of your chosen company's product portfolio and strategic positioning.
References
https://www.edrawmax.com/article/google-bgc-matrix.html
https://en.wikipedia.org/wiki/History_of_Google
https://www.statista.com/statistics/326046/google-brand-value/


