


A BCG matrix is sometimes called the Growth-Share matrix as it explores the industry's growth rate and the business's market share relative to the largest competition present. The framework involves four quadrants: Stars, Question Marks, Cash Cows, and Dogs.
The significant drop in PepsiCo's carbonated drinks business prompted it to return to the drawing board and review its future strategies and product offerings. Here lies the essence of various strategic planning frameworks like a Pepsi BCG matrix.
This article takes you through the various brands PepsiCo offers over the years that have seen the rise and fall of market share during the changing market trends. If you want to learn how the BCG matrix of PepsiCo is made, you must continue reading.
Background of PepsiCo
PepsiCo is considered one of the world's biggest food and beverage companies, with about 200 available products. Before it became PepsiCo, there was Pepsi-Cola, established by Caleb Bradham, a pharmacist from North Carolina. He named his sweet beverage Pepsi-Cola in 1898. While it had its popularity after it was introduced to the market, the company faced its toughest hurdle after World War 1.
A modern Pepsi-Cola emerged in 1931 when Charles G. Guth picked the company's assets and trademarks. The 21st century saw the company's expansion to other geographical locations, including Russia.
As you delve into this article detailing the BCG Matrix of PepsiCo, you'll uncover a range of products within PepsiCo's portfolio that might be new to you. This insight provides a deeper understanding of the company's diverse offerings and their positioning in the market.
PepsiCo BCG Matrix Analysis
The template below is the Pepsi BCG matrix showing the products the company considers market leaders and others that have yet to solidify their positions in the market. Check the explanations below.
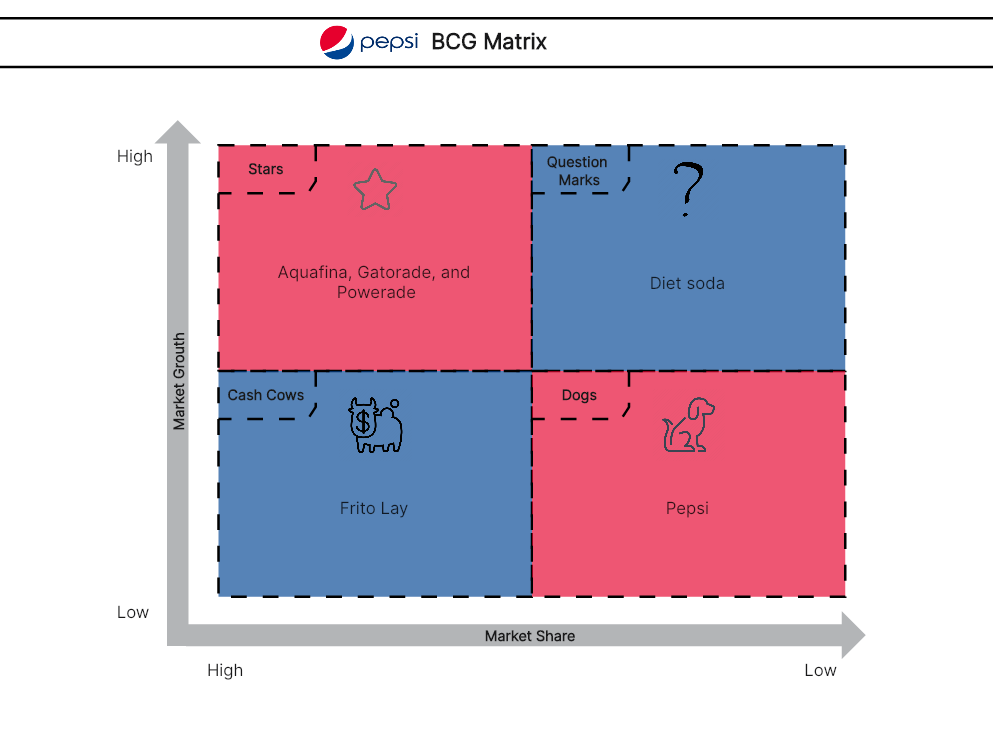
Stars
These products under this quadrant mean they have high-growth markets with a high market share. Since Stars hold a high market share, they're considered to grow more in the future. This also means investors are interested in investing their money in developing these products as they guarantee better sales and revenue.
The Stars of the BCG matrix of PepsiCo are Aquafina, Gatorade, and Powerade. Aquafina is a purified water bottle that holds a market share of about 15%. The brand is slowly and consistently catching up with the brand ahead of it and is expected to double its growth in the following years.
On the other hand, Powerade and Gatorade have been the leaders for the company in the sports drink market. Gatorade has about 775 market share while Powerade holds 205 market share. The growing demand for healthier options prompts companies like PepsiCo to invest in healthier food and drinks.
Question Mark
The elements you place in this quadrant are those products with low market share but with a high growth market. They're technically in the development stage of the life cycle and have the chance of generating better revenues by taking the Star position, or they could also become a liability for the company in the future. Excellent product development is necessary to make the Question Mark products successful.
The BCG matrix of PepsiCo shows that Diet Coke can potentially establish a strong position in the industry. There might be a low market for diet sodas, but today's healthy lifestyle trend will indeed open more opportunities for PepsiCo to develop product development strategies.
Cash Cows
Cash cows are the products in the BCG matrix of PepsiCo with low market growth but have high market share. They're generally one of the leaders in the industry. These products are considered money churners of the Pepsi BCG matrix and need a meager investment to keep their leadership within the market.
Frito Lay is a popular snack in the US, covering a market share of 36.6%. Since it holds a higher market share in the industry, PepsiCo does not need to invest so much to maintain its market position against its competitors.
Dogs
The final quadrant of the Pepsi BCG matrix is Dogs. These products were expected to have potential growth but failed to do so because of the slow market growth. As a result, they fail to generate sales for the company, making them liabilities in the organization. The company either discontinues the production or continues manufacturing to break even.
Surprisingly, Pepsi BCG Matrix has Pepsi on its Dogs quadrant. This soft drinks brand has been famous since it was introduced to the market. While some customers might still patronize Pepsi, it's not as in demand as decades back. The decline in the need for carbonated drinks is the result of the popularity of healthy and low-calorie beverages. With how people are conscious of what they drink today, Pepsi will have to stay in the Dogs section of the BCG matrix for a long time.
Mastering BCG Matrix Creation on Boardmix
The Boston Consulting Group (BCG) Matrix is a vital tool for strategic management, allowing you to visualize a company's product portfolio and identify growth opportunities. Here's how you can create a BCG Matrix on Boardmix:
1. Login and Create a New Board
First, log into your Boardmix account. Once logged in, click on ‘New Board'. This gives you a fresh canvas to work on.

2. Draw the BCG Matrix Grid or Use a Template
The BCG Matrix consists of a 2x2 grid. Use the ‘shape' tool in the toolbar to create this grid. You will need two perpendicular lines intersecting in the middle to form four quadrants. You can also search for the BCG Matrix template in the template library and use it for free.
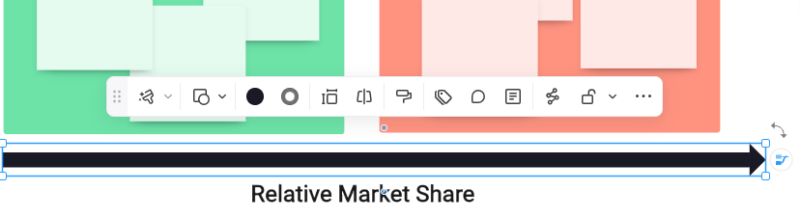
3. Label the Axes
Next, label your axes. The y-axis usually represents the market growth rate, while the x-axis represents the relative market share. You can add these labels using the 'text' tool from the toolbar.
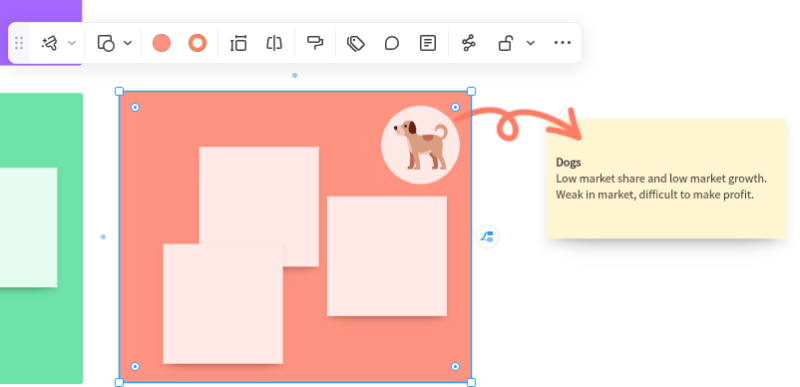
4. Add Quadrant Labels
Each quadrant in the BCG Matrix represents a different product category: Cash Cows (high market share, low market growth), Dogs (low for both), Stars (high for both), and Question Marks (low market share, high market growth). Use the text tool again to add these labels.
5. Plot Products
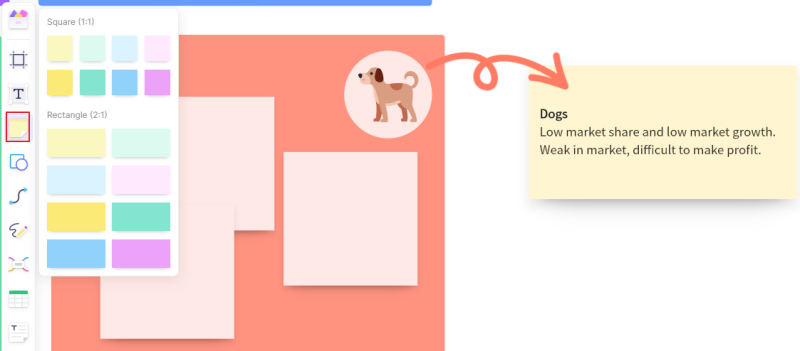
Start plotting your products or business units in the appropriate quadrants based on their market share and growth rate. You can use different shapes or colors for each product to make them distinguishable.
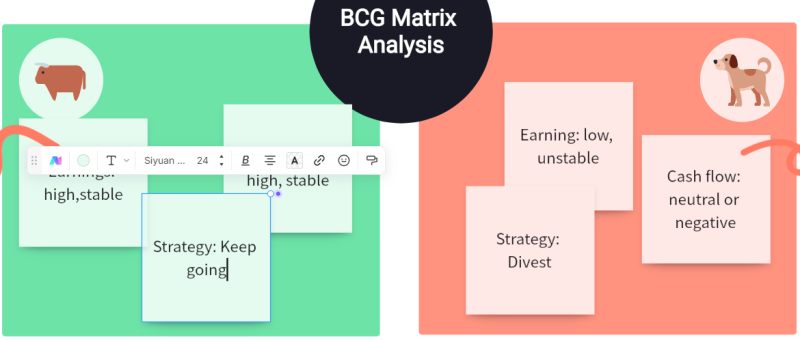
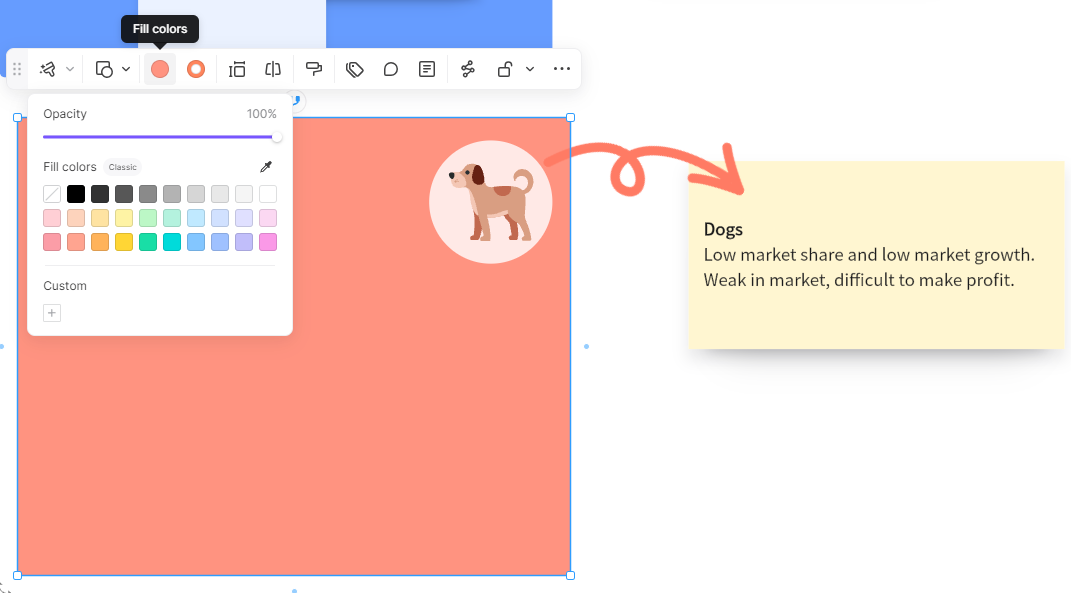
6. Customize Your Diagram
Boardmix offers various customization options. Feel free to change colors, add patterns, or adjust sizes as needed to create a visually engaging BCG Matrix
 .
.7. Add Notes or Annotations
If needed, add any notes or annotations for clarification using the text tool. This can be especially helpful when sharing your BCG Matrix with others who might not be familiar with all the products or units plotted.
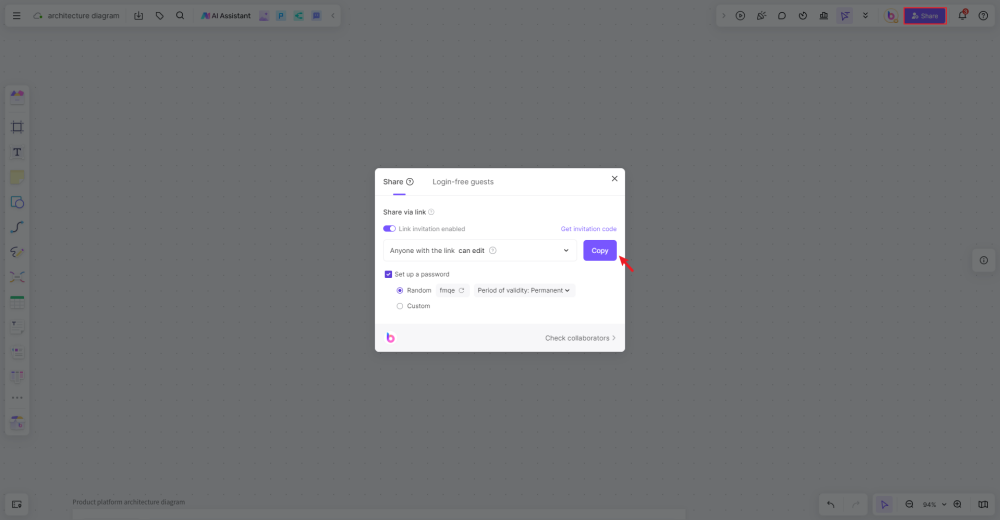
8. Save and Share Your BCG Matrix
Once you're happy with your BCG Matrix, save it on Boardmix's secure cloud storage for future reference. You can also share your diagram with colleagues or stakeholders via email or direct link.
Creating a BCG Matrix on Boardmix can significantly enhance your strategic planning process by providing a clear visualization of your product portfolio's current state and highlighting potential areas of growth or investment.
Key Takeaways
The BCG matrix is a great tool to understand better how your services or products perform in specific markets. Furthermore, it lets companies assess where to invest to drive sales and revenue. It's also a visual illustration that allows companies to maximize and maintain their market leaders' position in the industry.
You can adapt the pre-built template from Boardmix as you create your BCG matrix. The online BCG matrix lets creators customize the diagram with different colors, lines, and shapes and insert images. You can save it in your workspace or have others view the matrix through a link and authorize them to edit the template. Get the template here.
References
BCG Matrix of Pepsi | BCG Matrix analysis of Pepsi. (2018, August 26). https://heartofcodes.com/bcg-matrix-of-pepsi/
PepsiCo, Inc. (2023, August 16). https://www.britannica.com/topic/PepsiCo-Inc
BCG Matrix of PepsiCo. (2017, March 15). https://bcgmatrixanalysis.com/bcg-matrix-of-pepsico/


