


Some call the BCG Matrix the Growth-Share matrix, which is a diagramming tool used in corporate strategies to analyze product lines and business units based on two specific variables: market growth rate and relative market share.
Like any other established company, there is also a BCG Matrix for Samsung. The diagram is just one of the company's many strategic planning tools to ensure it can better serve its target customers and continuously expand to other market groups.
Whether it is for a school project or you want to get inspiration in making your company's BCG Matrix, Samsung's model will help you. Read through this article to learn more about the Samsung BCG matrix.
Background of Samsung
Samsung is a huge company offering a diverse collection of products. Before it became a powerhouse provider in the electronics industry, it used to be a trading company in 1938. Over the following decades, Samsung diversified into textiles, food processing, securities, retail, and insurance. It is now globally known as one of the leading providers of mobile phones, televisions, cameras, microwaves, laundry machines, and all other electronics consumers can think of.
What is interesting about Samsung is that it spreads possible risks among various business units. If something terrible happens in the camera industry, the company can still generate positive cash flow from other product categories. It helps Samsung cope with possible financial setbacks. At the same time, stakeholders must also decide what products to prioritize to ensure better profits. Here lies the essence of the Samsung BCG matrix.
Samsung BCG Matrix Analysis
The following is what a BCG Matrix for Samsung looks like. If you're creating your BCG template, remember it must have four quadrants. Every section has labels; you must fill in each section with related information. The analysis for each quadrant includes the following.
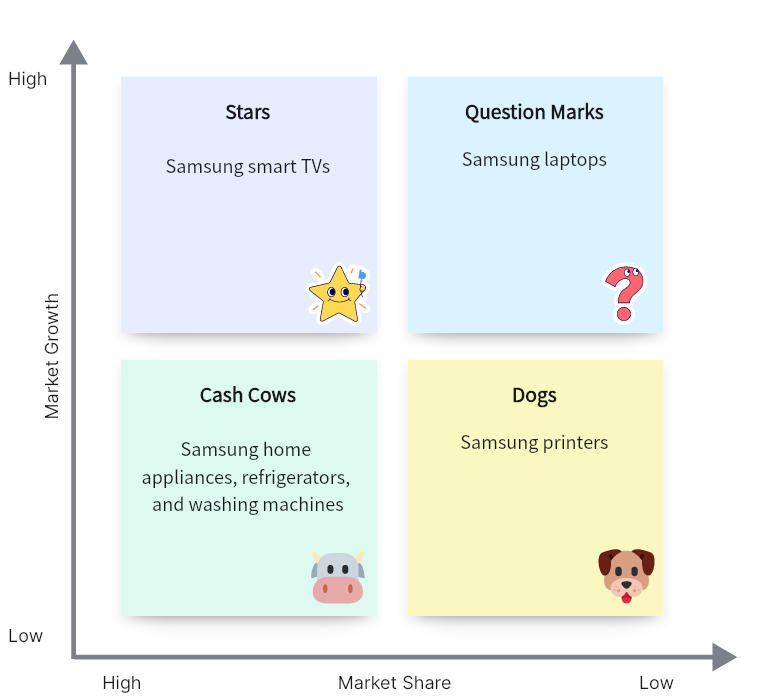
Stars
The stars are your business units or products with high market shares. They can even be your market leaders and generate huge cash because of the higher relative market share. At the same time, these elements here need significant investments to be ahead of the competition and keep the growth rate.
Samsung has a firm hold on the TV market. This is why you will see on the BCG Matrix for Samsung that smart TVs have a high market share and market growth. While the competition might be challenging, the brand still gains considerable traction from global markets. Samsung also continues to innovate technologies on its smart TVs to keep current customers and reach more in the future.
Question Mark
The products you see in this quadrant are those that carve a part in the industry but are still in the stage of development. The question mark in this section also means the company has yet to develop a significant position in the industry. However, these products also have the potential to secure a market share within a high-growth market.
Samsung's laptops fall under the question mark quadrant of its BC matrix. While the company has introduced its laptops to customers, there are not consistent developments like how they do with their mobile phones. There is a low market share for Samsung's laptops, but if managed effectively, they can generate a wider share within its market and have the chance to be moved to the start quadrant.
Cash Cows
While looking at the BCG Matrix for Samsung, some of its products, which used to be stars, now fall under the cash cows quadrant. They are those products that have declining market growth and stagnant revenue. However, they continue to have a large market share in a stagnating market, and cash flows and profits are expected to be high. Since there is a lower growth rate, the investments necessary must also be low.
Samsung's home appliances, refrigerators, and washing machines are examples of cash cows in the Samsung BCG matrix. The company's home appliances have been household names over the years. It has solidified its position in terms of quality and trust.
Dogs
Dogs are referred to as products or business units in a declining market with a low relative market share. They generally break even and generate barely sufficient cash to maintain the company's market share. In short, the business units here will not impress most investors.
Within the Samsung BCG Matrix framework, printers are categorized as dogs. This classification stems from their modest sales performance and relatively limited contribution to overall business growth. While resources were invested in their creation, there exists an opportunity to repurpose their technology in products with higher potential. Typically, dogs hold the highest likelihood of being liquidated or divested due to their low profitability and market prospects.
BCG Matrix Template
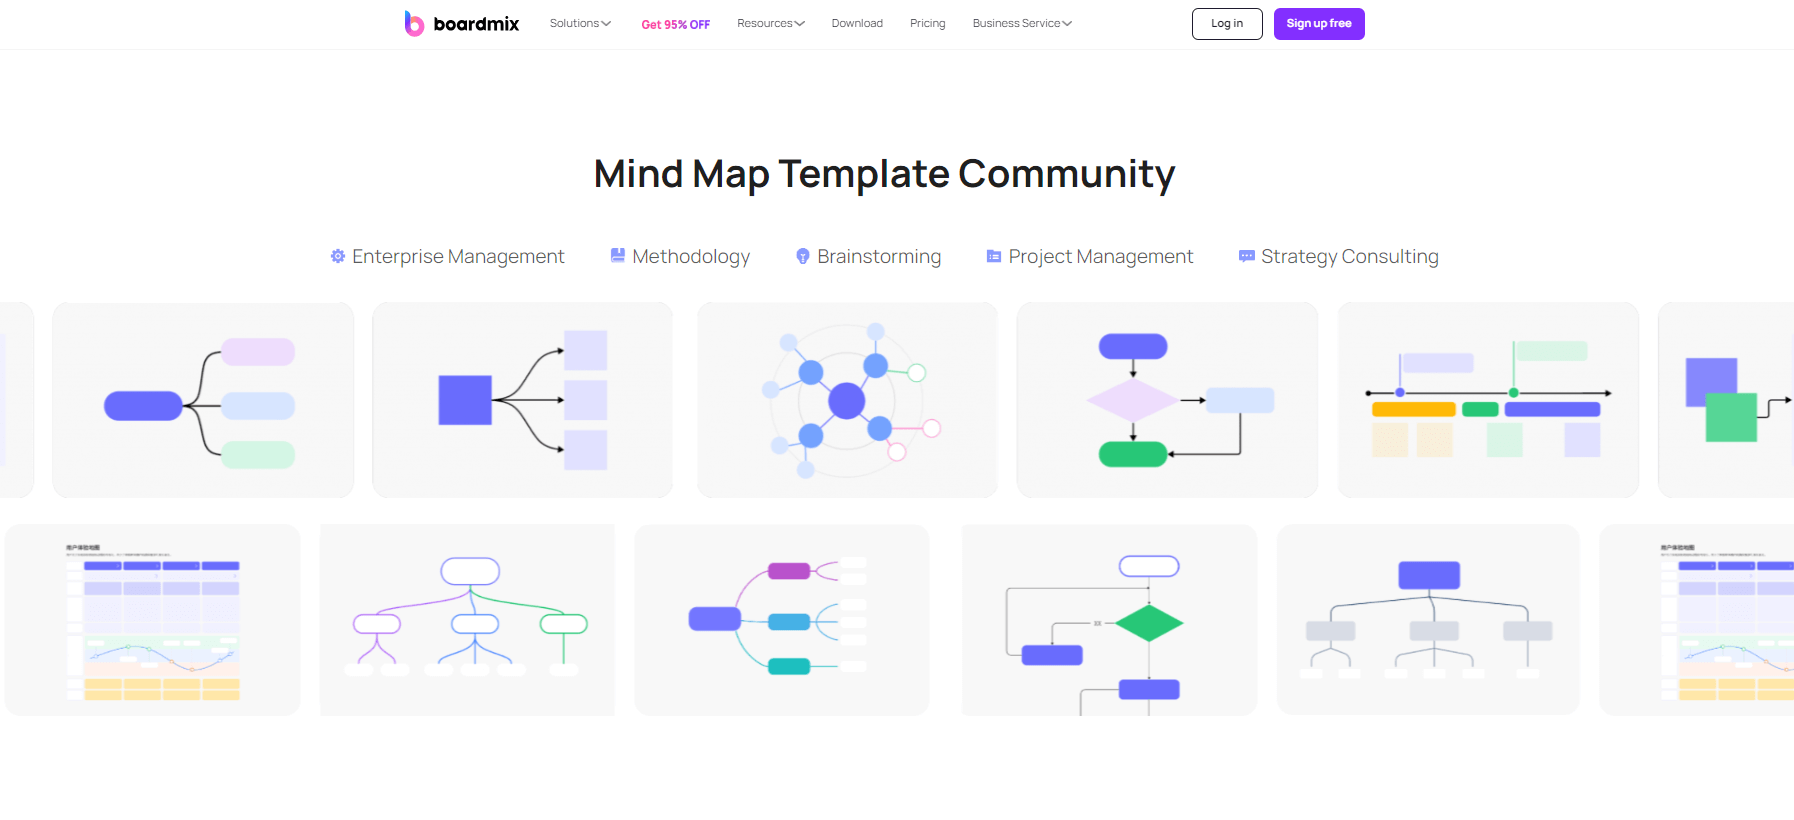
There are some free online whiteboard like Boardmix offers online BCG Matrix Template for free. Here's a step-by-step guide for you to try this template.
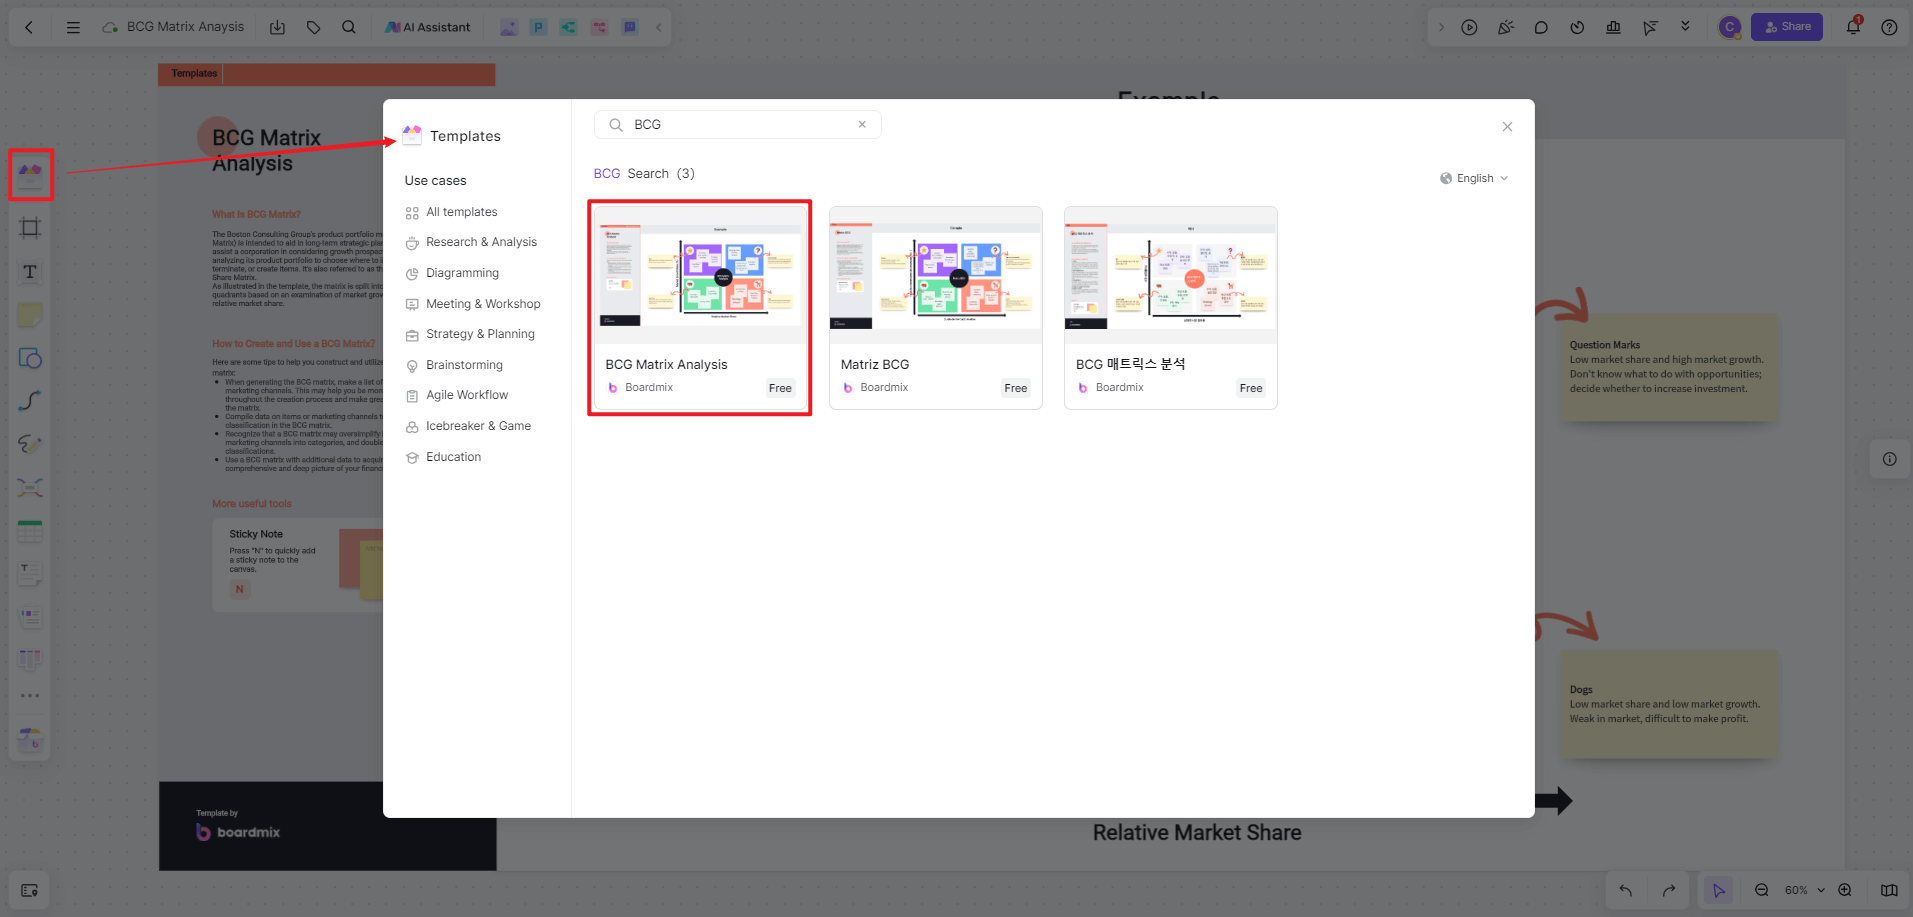
Step 1: Open a New Canvas& Locate the BCG Matrix Template
After logging in, click on 'Create New Board'. Name your board according to your preference and click 'Create'. Go to the template library on the right side of the screen. Scroll down and select 'BCG Matrix' from the list of available templates. Click 'Add' to insert the BCG Matrix template onto your canvas.
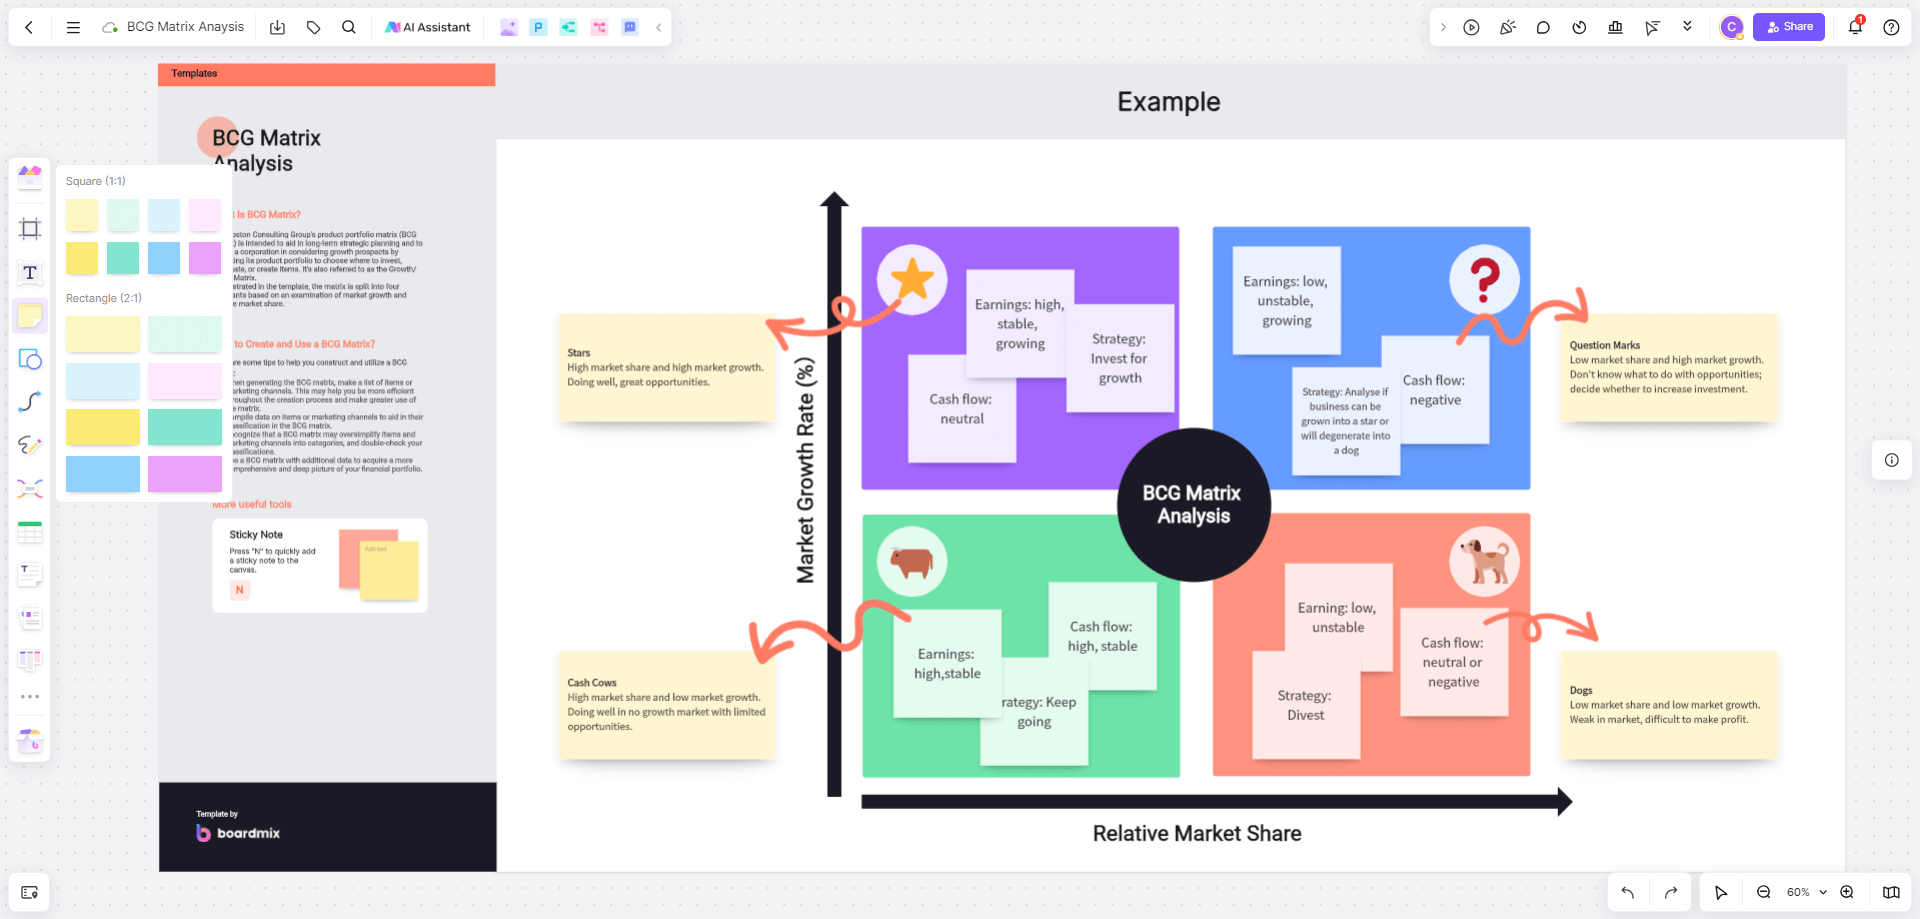
Step 2: Customize Your BCG Matrix
Each box of the BCG Matrix represents a different category – Star, Cash Cow, Question Mark, and Dog. Begin by labeling each of your product portfolios into these categories. You can use text boxes or sticky notes for labeling. You can also customize the color and size of your text and sticky notes for easy identification.
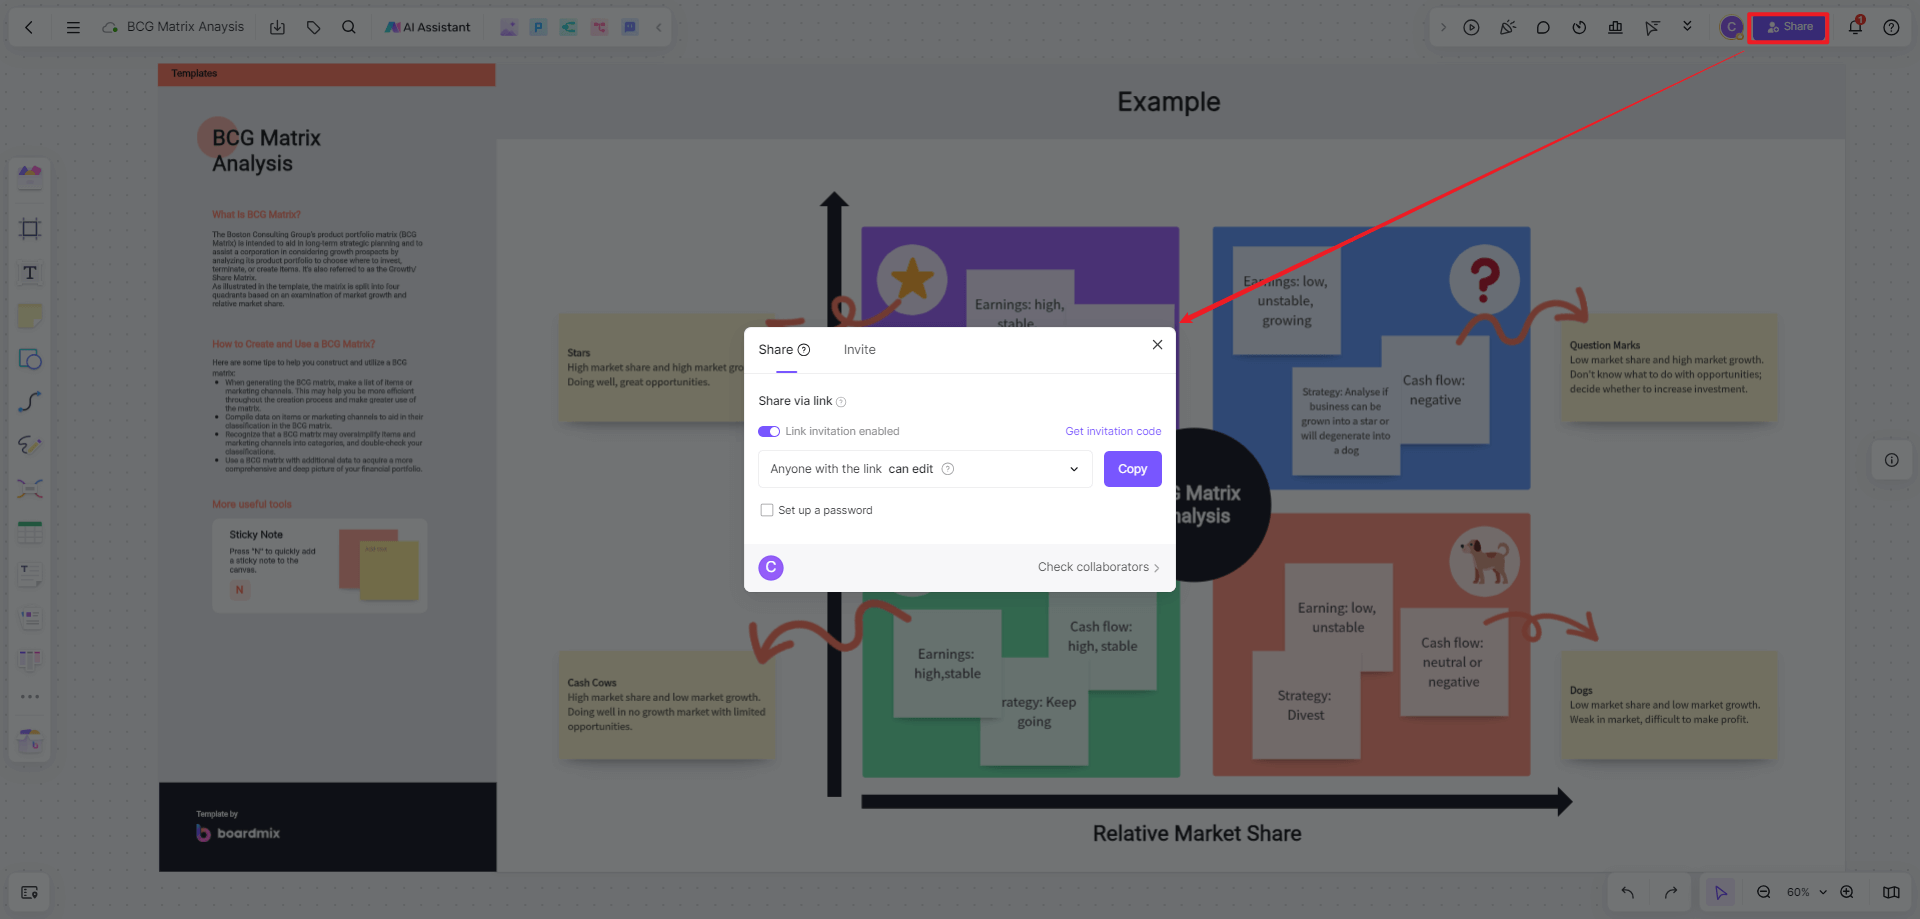
Step 3: Collaborate and Discuss
Boardmix allows real-time collaboration. Invite team members to view, comment, or edit the BCG matrix. You can discuss each product’s placement and strategize on how to leverage ‘Stars’, maintain ‘Cash Cows’, potentially convert ‘Question Marks’, and decide about ‘Dogs’.
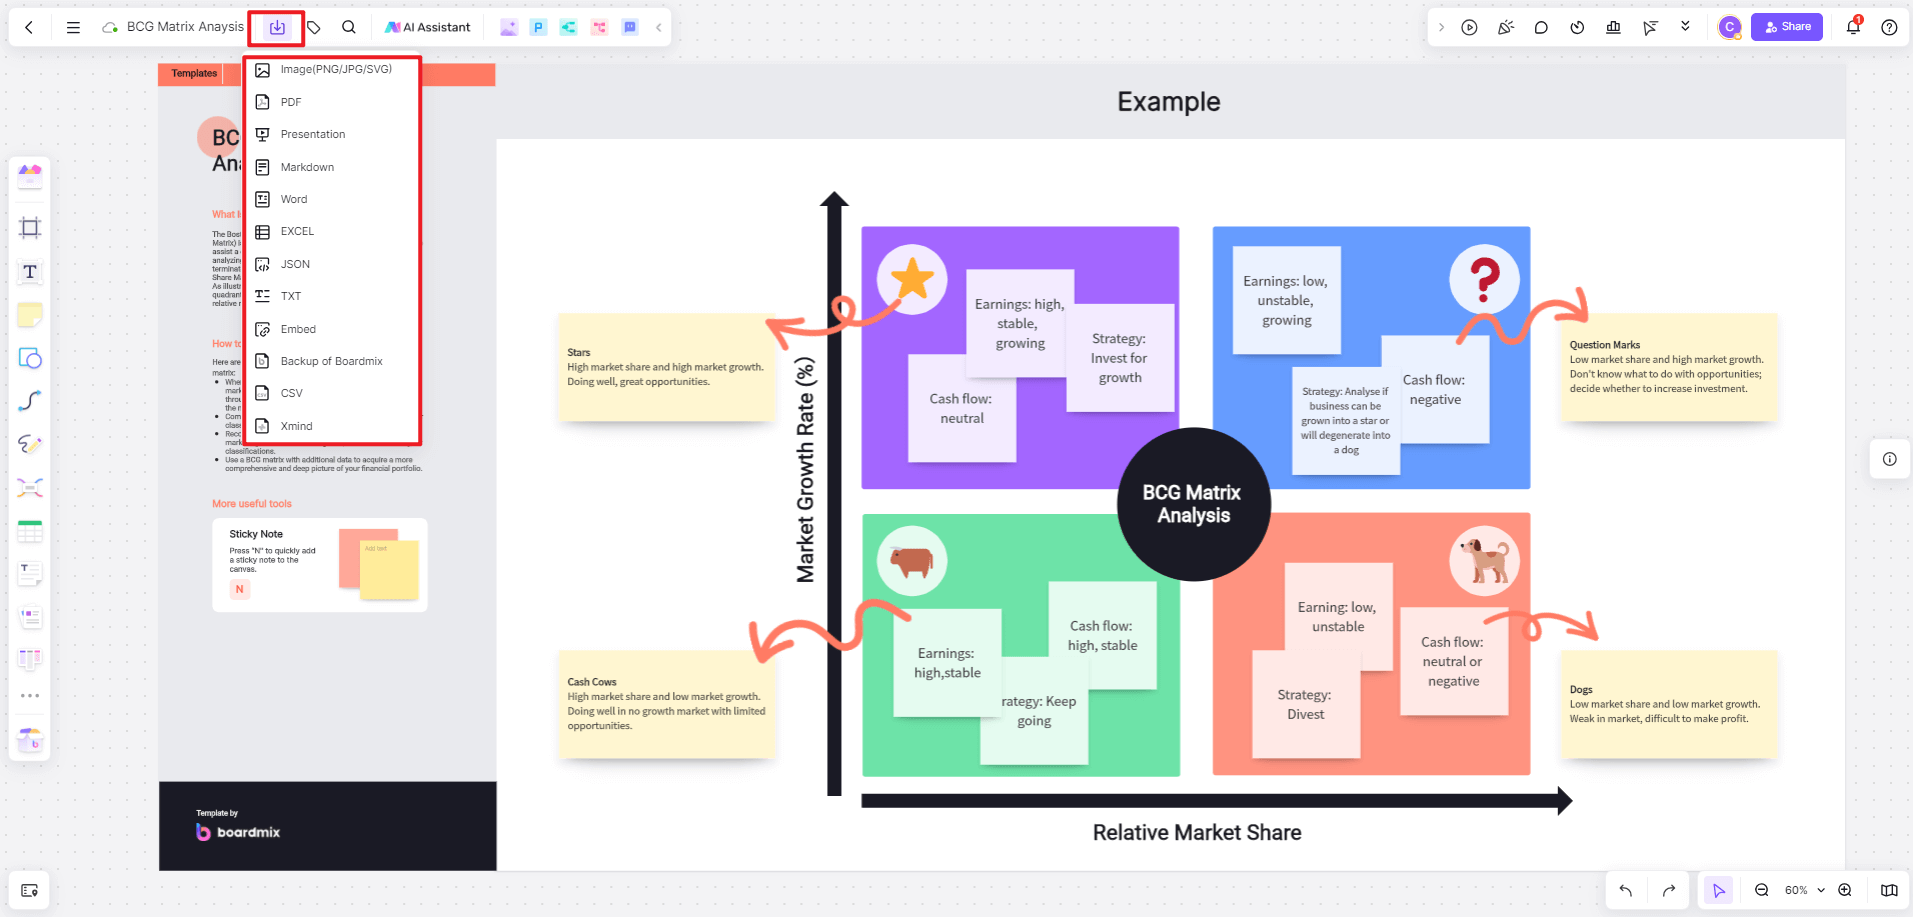
Step 4: Save and Export Your BCG Matrix
Once you are satisfied with your BCG Matrix, you can save your work. Boardmix also allows you to export your work in various formats such as PDF or JPEG for further use or presentation.
Key Takeaways
The simplicity of BCG Matrix for Samsung allows its creatives, marketing, and sales personnel to create strategic plans for products that potentially drive sales for the company. Its illustration also uses a straightforward template so the audience can quickly grasp what message the matrix is trying to convey. To make it even easier, we have pre-built templates to assist you in your journey to BCG Matrix.
Creating the BCG matrix is also easy, given that you understand what each quadrant means. You can also make it more fun by using pre-built templates online. This means you need not create a new diagram. All you need is access to these templates and tweak some sections to make it your own. Check on Boardmix's BCG matrix templates here to start. After creating the matrix, share it with your peers and colleagues through a unique link available on the workspace page.
Boardmix is an instrumental tool designed to tap into your creativity and bring structure to your ideas. With its digital canvas, it empowers users for online collaboration involving seneries like design research, marketing analysis, business plan, daily meeting, weekly plan and online education. It offers one-stop solution of online whiteboard, flowcharts, mind maps, brainstorming, hybrid work, scrum tool and so on. Boardmix also integrated comprehensive AI-generation features like AI Presentation, AI Image, AI Mind Map and so on. BoardMix's online whiteboard combines advanced technology with ease of use, simplifying team brainstorming, data analysis, document drafting, and information visualization. Try to build your online template with Boardmix right now!
References
BCG Matrix of Samsung | BCG Matrix Analysis of Samsung. (2018, July 25). https://heartofcodes.com/bcg-matrix-of-samsung/
Bruin. L. (2017, November 30). BCG Matrix: Portfolio Analysis in Corporate Strategy. B2U.
https://www.business-to-you.com/bcg-matrix/
BCG Matrix for Samsung. (2016, October 11).
https://bcgmatrixanalysis.com/bcg-matrix-for-samsung/


